Estimated zip code population in 2022: 1,061 Zip code population in 2010: 718 Zip code population in 2000: 743
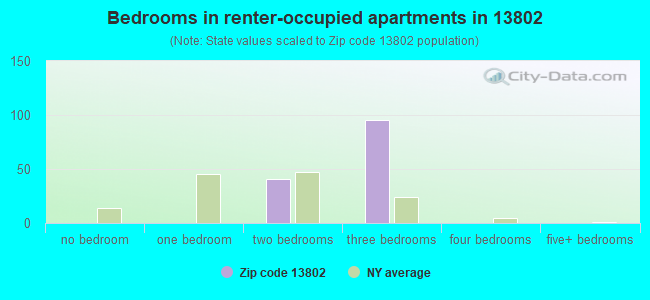
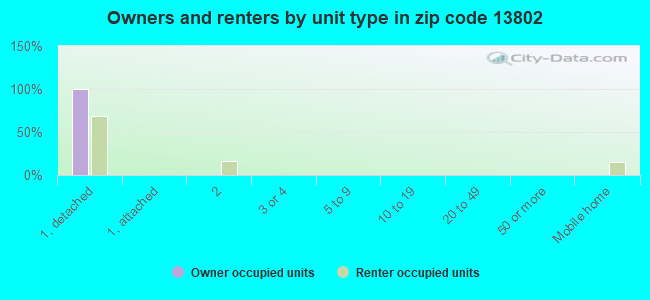
Houses and condos: 554 Renter-occupied apartments: 136
% of renters here:
25%
State:
46%
March 2022 cost of living index in zip code 13802: 94.8 (less than average, U.S. average is 100)
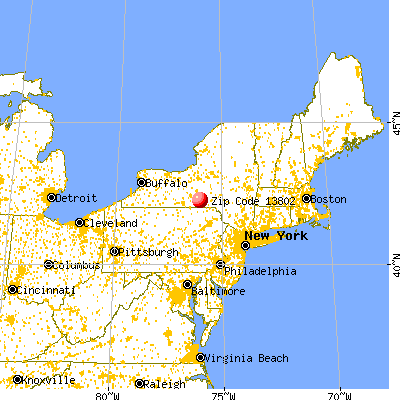
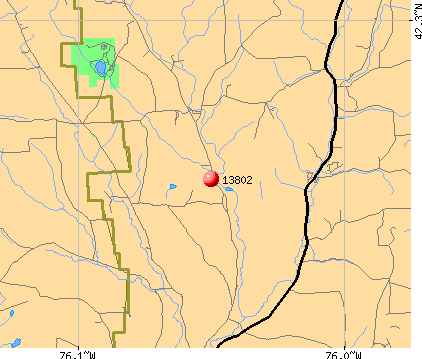
Land area: 10.1 sq. mi. Water area: 0.0 sq. mi.
Population density: 106 people per square mile
(very low).
OSM Map
General Map
Google Map
MSN Map
OSM Map
General Map
Google Map
MSN Map
OSM Map
General Map
Google Map
MSN Map
OSM Map
General Map
Google Map
MSN Map
Please wait while loading the map...
Median real estate property taxes paid for housing units with mortgages in 2022: $1,545 (1.7%) Median real estate property taxes paid for housing units with no mortgage in 2022: $1,284 (2.6%)
Business Search- 14 Million verified businesses
Males: 509
(48.0%)
Females: 551
(52.0%)
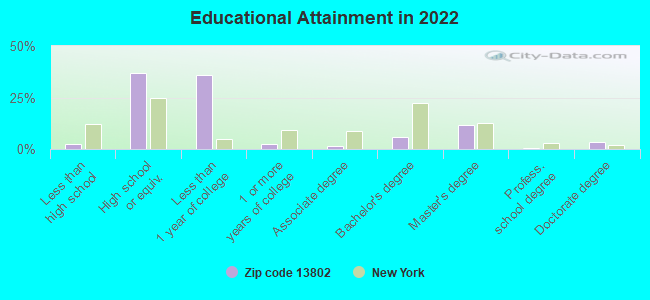
For population 25 years and over in 13802:
High school or higher: 98.5%
Bachelor's degree or higher: 21.4%
Graduate or professional degree: 15.4%
Mean travel time to work (commute): 17.8 minutes
For population 15 years and over in 13802:
Never married: 26.5%
Now married: 25.9%
Separated: 0.0%
Widowed: 1.7%
Divorced: 45.9%
Zip code 13802 compared to state average:
Median household income significantly below state average.
Median house value significantly below state average.
Unemployed percentage significantly below state average.
Black race population percentage significantly below state average.
Hispanic race population percentage significantly below state average.
Foreign-born population percentage significantly below state average.
Renting percentage below state average.
Length of stay since moving in significantly above state average.
Number of rooms per house above state average.
Number of college students below state average.
Percentage of population with a bachelor's degree or higher below state average.
Averages for the 2020 tax year for zip code 13802, filed in 2021:
Average Adjusted Gross Income (AGI) in 2020: $55,638 (Individual Income Tax Returns)
Here:
$55,638
State:
$90,930
Salary/wage: $53,331 (reported on 76.2% of returns)
Here:
$53,331
State:
$72,104
(% of AGI for various income ranges: 1054.5% for AGIs below $25k, 3037.1% for AGIs $25k-50k, 5320.0% for AGIs $50k-75k, 10460.0% for AGIs $75k-100k, 26606.7% for AGIs $100k-200k)
Taxable interest for individuals: $335 (reported on 40.5% of returns)
This zip code:
$335
New York:
$3,075
(% of AGI for various income ranges: 10.0% for AGIs below $25k, 30.0% for AGIs $25k-50k, 28.0% for AGIs $50k-75k, 36.7% for AGIs $100k-200k)
Ordinary dividends: $1,100 (reported on 19.0% of returns)
Here:
$1,100
State:
$11,095
(% of AGI for various income ranges: 28.6% for AGIs $25k-50k, 98.0% for AGIs $50k-75k, 63.3% for AGIs $100k-200k)
Net capital gain/loss in AGI: +$2,933 (reported on 14.3% of returns)
Here:
+$2,933
State:
+$44,925
(% of AGI for various income ranges: 72.9% for AGIs $25k-50k, 416.7% for AGIs $100k-200k)
Profit/loss from business: +$4,900 (reported on 9.5% of returns)
Here:
+$4,900
State:
+$14,940
(% of AGI for various income ranges: 95.5% for AGIs below $25k, 182.0% for AGIs $50k-75k)
Taxable individual retirement arrangement distribution: $8,140 (reported on 11.9% of returns)
13802:
$8,140
New York:
$19,609
(% of AGI for various income ranges: 581.4% for AGIs $25k-50k)
Earned income credit: $2,150 (reported on 14.3% of returns)
Here:
$2,150
State:
$2,138
(% of AGI for various income ranges: 117.3% for AGIs below $25k)
Percentage of individuals using paid preparers for their 2020 taxes: 92.9%
Here:
93%
State:
95%
(% for various income ranges: 100.0% for AGIs below $25k, 100.0% for AGIs $25k-50k, 85.7% for AGIs $50k-75k, 80.0% for AGIs $75k-100k, 85.7% for AGIs $100k-200k)
Averages for the 2012 tax year for zip code 13802, filed in 2013:
Average Adjusted Gross Income (AGI) in 2012: $43,747 (Individual Income Tax Returns)
Here:
$43,747
State:
$77,088
Salary/wage: $39,211 (reported on 83.7% of returns)
Here:
$39,211
State:
$60,593
(% of AGI for various income ranges: 76.3% for AGIs below $25k, 70.2% for AGIs $25k-50k, 77.2% for AGIs $50k-75k, 78.2% for AGIs $75k-100k, 74.2% for AGIs $100k-200k)
Taxable interest for individuals: $550 (reported on 46.5% of returns)
This zip code:
$550
New York:
$3,125
(% of AGI for various income ranges: 1.8% for AGIs below $25k, 1.1% for AGIs $25k-50k, 0.5% for AGIs $50k-75k, 0.2% for AGIs $100k-200k)
Ordinary dividends: $956 (reported on 20.9% of returns)
Here:
$956
State:
$10,299
(% of AGI for various income ranges: 0.4% for AGIs below $25k, 1.0% for AGIs $25k-50k, 1.0% for AGIs $75k-100k)
Net capital gain/loss in AGI: +$140 (reported on 11.6% of returns)
Here:
+$140
State:
+$42,474
Profit/loss from business: +$4,317 (reported on 14.0% of returns)
Here:
+$4,317
State:
+$16,168
Taxable individual retirement arrangement distribution: $5,500 (reported on 9.3% of returns)
13802:
$5,500
New York:
$17,621
Total itemized deductions: $18,027 (21% of AGI, reported on 25.6% of returns)
Here:
$18,027
State:
$34,985
Here:
20.6% of AGI
State:
21.3% of AGI
(% of AGI for various income ranges: 11.1% for AGIs below $25k, 10.3% for AGIs $50k-75k, 13.8% for AGIs $75k-100k, 15.2% for AGIs $100k-200k)
Charity contributions: $2,725 (reported on 18.6% of returns)
Here:
$2,725
State:
$5,572
(% of AGI for various income ranges: 1.7% for AGIs $50k-75k, 1.9% for AGIs $75k-100k, 1.5% for AGIs $100k-200k)
Taxes paid: $9,155 (reported on 25.6% of returns)
13802:
$9,155
State:
$18,656
(% of AGI for various income ranges: 5.1% for AGIs below $25k, 4.7% for AGIs $50k-75k, 6.6% for AGIs $75k-100k, 8.5% for AGIs $100k-200k)
Earned income credit: $2,000 (reported on 14.0% of returns)
Here:
$2,000
State:
$2,230
(% of AGI for various income ranges: 3.6% for AGIs below $25k, 1.1% for AGIs $25k-50k)
Percentage of individuals using paid preparers for their 2012 taxes: 44.2%
Here:
44%
State:
66%
(% for various income ranges: 38.9% for AGIs below $25k, 50.0% for AGIs $25k-50k, 50.0% for AGIs $50k-75k, 40.0% for AGIs $75k-100k, 50.0% for AGIs $100k-200k)
Averages for the 2004 tax year for zip code 13802, filed in 2005:
Average Adjusted Gross Income (AGI) in 2004: $35,295 (Individual Income Tax Returns)
Here:
$35,295
State:
$59,519
Salary/wage: $32,903 (reported on 83.3% of returns)
Here:
$32,903
State:
$50,673
(% of AGI for various income ranges: 81.6% for AGIs below $10k, 66.6% for AGIs $10k-25k, 77.1% for AGIs $25k-50k, 78.6% for AGIs $50k-75k, 77.8% for AGIs $75k-100k, 84.8% for AGIs over 100k)
Taxable interest for individuals: $631 (reported on 54.5% of returns)
This zip code:
$631
New York:
$2,377
(% of AGI for various income ranges: 1.9% for AGIs below $10k, 2.3% for AGIs $10k-25k, 1.1% for AGIs $25k-50k, 0.4% for AGIs $50k-75k, 1.0% for AGIs $75k-100k, 0.3% for AGIs over 100k)
Taxable dividends: $542 (reported on 25.2% of returns)
Here:
$542
State:
$5,394
(% of AGI for various income ranges: 0.4% for AGIs below $10k, 1.2% for AGIs $10k-25k, 0.3% for AGIs $25k-50k, 0.4% for AGIs $50k-75k, 0.1% for AGIs $75k-100k, 0.2% for AGIs over 100k)
Net capital gain/loss: +$603 (reported on 15.6% of returns)
Here:
+$603
State:
+$23,581
(% of AGI for various income ranges: 0.9% for AGIs $10k-25k, 1.1% for AGIs $25k-50k, 0.0% for AGIs $50k-75k, -0.8% for AGIs $75k-100k)
Profit/loss from business: +$2,507 (reported on 14.7% of returns)
Here:
+$2,507
State:
+$13,809
IRA payment deduction: $3,000 (reported on 2.1% of returns)
13802:
$3,000
New York:
$3,115
Total itemized deductions: $15,478 (22% of AGI, reported on 24.1% of returns)
Here:
$15,478
State:
$25,864
Here:
21.8% of AGI
State:
21.9% of AGI
(% of AGI for various income ranges: 6.0% for AGIs $10k-25k, 7.3% for AGIs $25k-50k, 11.1% for AGIs $50k-75k, 13.2% for AGIs $75k-100k, 17.9% for AGIs over 100k)
Charity contributions deductions: $1,816 (3% of AGI, reported on 20.9% of returns)
Here:
$1,816
State:
$4,439
Here:
2.5% of AGI
State:
3.6% of AGI
(% of AGI for various income ranges: 3.2% for AGIs below $10k, 0.7% for AGIs $25k-50k, 1.1% for AGIs $50k-75k, 0.8% for AGIs $75k-100k, 2.3% for AGIs over 100k)
Total tax: $4,186 (reported on 73.5% of returns)
13802:
$4,186
State:
$11,730
(% of AGI for various income ranges: 2.6% for AGIs below $10k, 4.1% for AGIs $10k-25k, 6.9% for AGIs $25k-50k, 8.3% for AGIs $50k-75k, 11.5% for AGIs $75k-100k, 14.0% for AGIs over 100k)
Earned income credit: $1,605 (reported on 16.2% of returns)
Here:
$1,605
State:
$1,757
Percentage of individuals using paid preparers for their 2004 taxes: 57.7%
Here:
58%
State:
67%
(% for various income ranges: 46.4% for AGIs below $10k, 56.2% for AGIs $10k-25k, 62.6% for AGIs $25k-50k, 59.7% for AGIs $50k-75k, 72.7% for AGIs $75k-100k, 68.2% for AGIs over 100k)
Household received Food Stamps/SNAP in the past 12 months: 13 Household did not receive Food Stamps/SNAP in the past 12 months: 529
Women who had a birth in the past 12 months: 3 (0 now married, 3 unmarried) Women who did not have a birth in the past 12 months: 280 (57 now married, 225 unmarried)
Housing units in zip code 13802 with a mortgage: 132 Houses without a mortgage: 32
Median monthly owner costs for units with a mortgage: $1,477 Median monthly owner costs for units without a mortgage: $454
Residents with income below the poverty level in 2022:
This zip code:
50.4%
Whole state:
14.3%
Residents with income below 50% of the poverty level in 2022:
This zip code:
18.6%
Whole state:
6.8%
Median number of rooms in houses and condos:
Here:
6.8
State:
6.3
Median number of rooms in apartments:
Here:
4.9
State:
3.8
Notable locations in this zip code not listed on our city pages
In group quarters: 9 (-1 institutionalized population)
Size of family households: 43 2-persons, 122 3-persons, 30 4-persons, 19 5-persons
Size of nonfamily households: 262 1-person, 79 2-persons
100 married couples with children.
203 single-parent households (3 men, 200 women).
98.7% of residents of 13802 zip code speak English at home.
0.5% of residents speak other Indo-European language at home (100% very well).
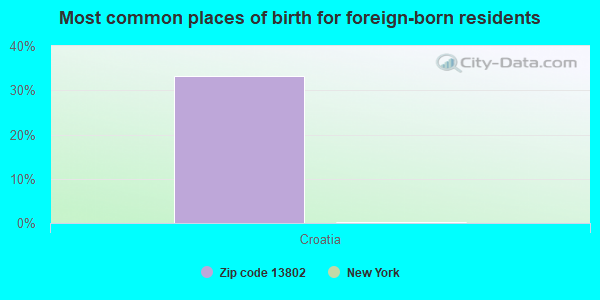
Foreign born population: 10 (1.0%) (100.0% of them are naturalized citizens)
This zip code:
1.0%
Whole state:
22.7%
33%Croatia
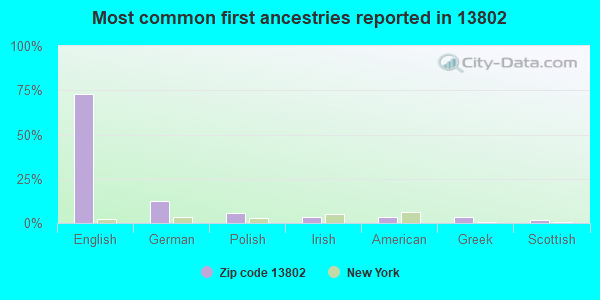
73%English
13%German
6%Polish
4%Irish
3%American
3%Greek
2%Scottish
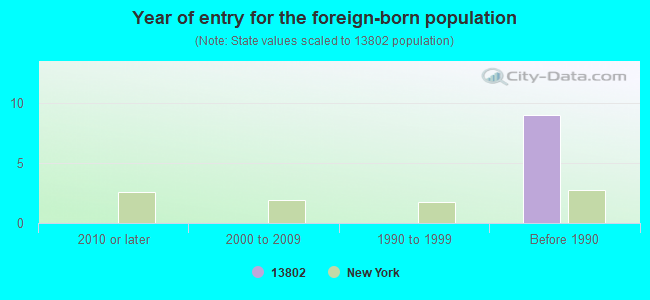
Year of entry for the foreign-born population
02010 or later
02000 to 2009
01990 to 1999
9Before 1990
Facilities with environmental interests located in this zip code:
ALLYNS TOWING & COLLISION (60-1/2 MAIN ST in MAINE, NY)
Conditionally Exempt Small Quantity Generators, less than 100 kg/month of hazardous waste (Resource Conservation and Recovery Act (tracking hazardous waste))
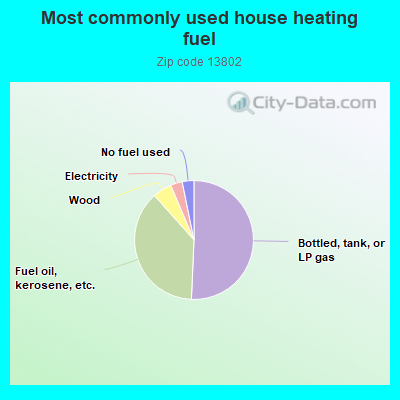
50.9%Bottled, tank, or LP gas
37.9%Fuel oil, kerosene, etc.
5.2%Wood
3.2%Electricity
3.2%No fuel used
Population in 1990: 254. Population change in the 1990s: +489 (+192.5%).
Place of birth for U.S.-born residents:
This state: 828
Northeast: 30
South: 62
West: 135
70% of the 13802 zip code residents lived in the same house 5 years ago. Out of people who lived in different houses, 71% lived in this county. Out of people who lived in different counties, 50% lived in New York.
100% of the 13802 zip code residents lived in the same house 1 year ago. Out of people who lived in different houses, 67% moved from different state.
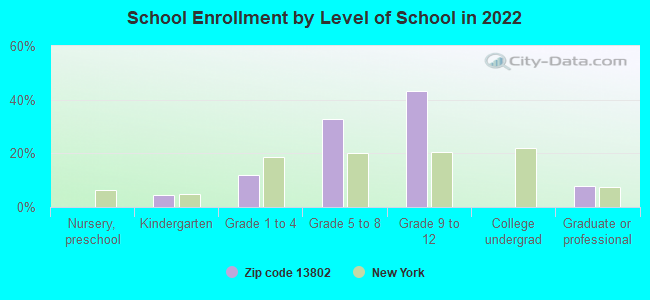
Private vs. public school enrollment:
Students in private schools in grades 1 to 8 (elementary and middle school):
Here:
0.0%
New York:
15.6%
Students in private schools in grades 9 to 12 (high school):
Here:
0.0%
New York:
15.0%
Occupation by median earnings in the past 12 months ($)
71,049Health diagnosing and treating practitioners and other technical occupations
53,268Education, training, and library occupations
52,523Building and grounds cleaning and maintenance occupations
10,747Construction and extraction occupations
Top industries in this zip code by the number of employees in 2005:
Other Services (except Public Administration): Religious Organizations (5-9 employees: 2 establishments, 1-4 employees: 2 establishments)
Wholesale Trade: Other Grocery and Related Products Merchant Wholesalers (10-19: 1)
Accommodation and Food Services: Full-Service Restaurants (1-4: 1)
Other Services (except Public Administration): General Automotive Repair (1-4: 1)
Other Services (except Public Administration): Cemeteries and Crematories (1-4: 1)
Management of Companies and Enterprises: Offices of Other Holding Companies (1-4: 1)
People in group quarters in 2010:
6 people in group homes intended for adults
Fatal accident statistics in 2010:
Fatal accident count: 1
Vehicles involved in fatal accidents: 1
Fatal accidents caused by drunken drivers: 1
Fatalities: 1
Persons involved in fatal accidents: 2
Pedestrians involved in fatal accidents: 0
Home Mortgage Disclosure Act Aggregated Statistics For Year 2009 (Based on 4 partial tracts)
A) FHA, FSA/RHS & VA Home Purchase Loans
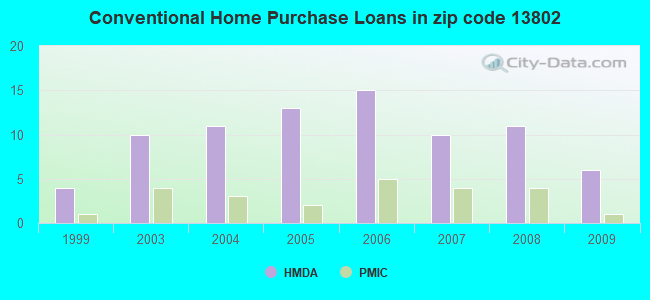
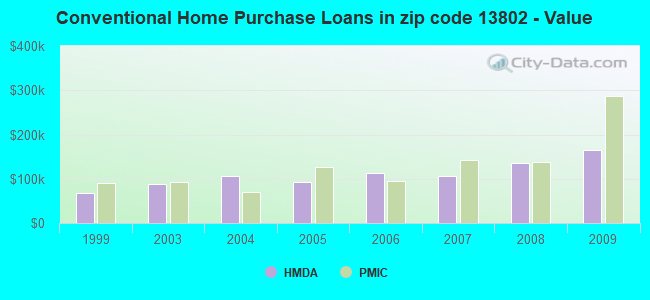
B) Conventional Home Purchase Loans
C) Refinancings
D) Home Improvement Loans
G) Loans On Manufactured Home Dwelling (A B C & D)
Number
Average Value
Number
Average Value
Number
Average Value
Number
Average Value
Number
Average Value
LOANS ORIGINATED
4
$104,218
6
$164,720
13
$115,708
4
$35,918
1
$119,860
APPLICATIONS APPROVED, NOT ACCEPTED
0
$0
1
$159,250
0
$0
1
$53,660
0
$0
APPLICATIONS DENIED
1
$119,350
1
$114,590
8
$106,678
3
$31,500
1
$35,040
APPLICATIONS WITHDRAWN
1
$68,230
1
$76,970
6
$140,448
3
$69,000
0
$0
FILES CLOSED FOR INCOMPLETENESS
0
$0
0
$0
1
$25,560
0
$0
1
$20,620
Aggregated Statistics For Year 2008 (Based on 4 partial tracts)
A) FHA, FSA/RHS & VA Home Purchase Loans
B) Conventional Home Purchase Loans
C) Refinancings
D) Home Improvement Loans
F) Non-occupant Loans on < 5 Family Dwellings (A B C & D)
G) Loans On Manufactured Home Dwelling (A B C & D)
Number
Average Value
Number
Average Value
Number
Average Value
Number
Average Value
Number
Average Value
Number
Average Value
LOANS ORIGINATED
5
$105,866
11
$136,430
9
$91,506
7
$35,006
1
$174,710
4
$61,182
APPLICATIONS APPROVED, NOT ACCEPTED
1
$43,480
1
$118,880
4
$96,470
1
$48,260
0
$0
1
$51,950
APPLICATIONS DENIED
1
$74,640
5
$136,786
6
$106,898
10
$25,169
1
$125,010
4
$45,298
APPLICATIONS WITHDRAWN
1
$52,740
1
$70,150
4
$117,052
2
$49,590
0
$0
0
$0
FILES CLOSED FOR INCOMPLETENESS
0
$0
0
$0
1
$134,650
1
$47,080
0
$0
0
$0
Aggregated Statistics For Year 2007 (Based on 4 partial tracts)
A) FHA, FSA/RHS & VA Home Purchase Loans
B) Conventional Home Purchase Loans
C) Refinancings
D) Home Improvement Loans
F) Non-occupant Loans on < 5 Family Dwellings (A B C & D)
G) Loans On Manufactured Home Dwelling (A B C & D)
Number
Average Value
Number
Average Value
Number
Average Value
Number
Average Value
Number
Average Value
Number
Average Value
LOANS ORIGINATED
3
$104,693
10
$105,514
15
$88,209
8
$45,830
1
$218,680
3
$129,837
APPLICATIONS APPROVED, NOT ACCEPTED
0
$0
3
$71,860
4
$81,498
1
$25,360
0
$0
2
$53,985
APPLICATIONS DENIED
1
$64,040
3
$84,410
15
$86,989
9
$27,362
1
$103,190
3
$54,890
APPLICATIONS WITHDRAWN
0
$0
2
$58,715
8
$88,398
1
$76,660
0
$0
0
$0
FILES CLOSED FOR INCOMPLETENESS
0
$0
1
$99,540
1
$176,550
1
$65,430
0
$0
0
$0
Aggregated Statistics For Year 2006 (Based on 4 partial tracts)
A) FHA, FSA/RHS & VA Home Purchase Loans
B) Conventional Home Purchase Loans
C) Refinancings
D) Home Improvement Loans
F) Non-occupant Loans on < 5 Family Dwellings (A B C & D)
G) Loans On Manufactured Home Dwelling (A B C & D)
Number
Average Value
Number
Average Value
Number
Average Value
Number
Average Value
Number
Average Value
Number
Average Value
LOANS ORIGINATED
2
$93,580
15
$112,889
20
$77,380
12
$22,949
1
$122,890
4
$40,748
APPLICATIONS APPROVED, NOT ACCEPTED
1
$52,710
4
$93,562
5
$100,652
1
$19,300
1
$34,050
1
$51,790
APPLICATIONS DENIED
0
$0
4
$74,742
16
$81,099
11
$18,593
2
$73,105
4
$61,205
APPLICATIONS WITHDRAWN
0
$0
1
$15,230
11
$95,357
2
$32,320
0
$0
0
$0
FILES CLOSED FOR INCOMPLETENESS
0
$0
0
$0
1
$34,490
0
$0
0
$0
0
$0
Aggregated Statistics For Year 2005 (Based on 4 partial tracts)
A) FHA, FSA/RHS & VA Home Purchase Loans
B) Conventional Home Purchase Loans
C) Refinancings
D) Home Improvement Loans
G) Loans On Manufactured Home Dwelling (A B C & D)
Number
Average Value
Number
Average Value
Number
Average Value
Number
Average Value
Number
Average Value
LOANS ORIGINATED
4
$94,325
13
$93,435
19
$80,927
8
$24,575
4
$42,588
APPLICATIONS APPROVED, NOT ACCEPTED
1
$52,970
3
$85,810
4
$79,580
2
$12,195
1
$66,420
APPLICATIONS DENIED
0
$0
6
$79,768
15
$80,844
7
$29,489
4
$52,368
APPLICATIONS WITHDRAWN
0
$0
1
$107,630
13
$90,751
2
$130,175
1
$88,460
FILES CLOSED FOR INCOMPLETENESS
0
$0
0
$0
7
$94,826
1
$31,130
0
$0
Aggregated Statistics For Year 2004 (Based on 4 partial tracts)
A) FHA, FSA/RHS & VA Home Purchase Loans
B) Conventional Home Purchase Loans
C) Refinancings
D) Home Improvement Loans
G) Loans On Manufactured Home Dwelling (A B C & D)
Number
Average Value
Number
Average Value
Number
Average Value
Number
Average Value
Number
Average Value
LOANS ORIGINATED
3
$109,820
11
$106,569
19
$69,341
7
$50,896
1
$74,850
APPLICATIONS APPROVED, NOT ACCEPTED
0
$0
1
$84,980
2
$112,025
1
$22,830
0
$0
APPLICATIONS DENIED
0
$0
1
$28,720
13
$73,578
4
$29,268
0
$0
APPLICATIONS WITHDRAWN
0
$0
1
$103,340
9
$74,443
1
$33,430
0
$0
FILES CLOSED FOR INCOMPLETENESS
0
$0
1
$51,060
4
$87,840
0
$0
0
$0
Aggregated Statistics For Year 2003 (Based on 4 partial tracts)
A) FHA, FSA/RHS & VA Home Purchase Loans
B) Conventional Home Purchase Loans
C) Refinancings
D) Home Improvement Loans
F) Non-occupant Loans on < 5 Family Dwellings (A B C & D)
Number
Average Value
Number
Average Value
Number
Average Value
Number
Average Value
Number
Average Value
LOANS ORIGINATED
2
$83,245
10
$88,959
37
$79,956
7
$15,200
2
$48,375
APPLICATIONS APPROVED, NOT ACCEPTED
1
$25,680
1
$60,730
4
$78,805
0
$0
0
$0
APPLICATIONS DENIED
0
$0
2
$60,075
18
$59,772
3
$20,043
1
$33,210
APPLICATIONS WITHDRAWN
0
$0
0
$0
12
$75,740
0
$0
0
$0
FILES CLOSED FOR INCOMPLETENESS
0
$0
0
$0
1
$52,260
0
$0
0
$0
Aggregated Statistics For Year 1999 (Based on 2 partial tracts)
Detailed PMIC statistics for the following Tracts:0102.00
, 0120.00
2002 - 2018 National Fire Incident Reporting System (NFIRS) incidents
Based on the data from the years 2002 - 2018 the average number of fires per year is 11. The highest number of reported fire incidents - 33 took place in 2005, and the least - 1 in 2011. The data has a declining trend.
When looking into fire subcategories, the most reports belonged to: Structure Fires (58.9%), and Outside Fires (24.9%).
Fire incident types reported to NFIRS in Zip Code 13802


 Nearest zip codes: 13777, 13790, 13797, 13760, 13905, 13811.


 Based on the data from the years 2002 - 2018 the average number of fires per year is 11. The highest number of reported fire incidents - 33 took place in 2005, and the least - 1 in 2011. The data has a declining trend.
 When looking into fire subcategories, the most reports belonged to: Structure Fires (58.9%), and Outside Fires (24.9%).