Estimated zip code population in 2022: 2,028 Zip code population in 2010: 2,250 Zip code population in 2000: 2,405
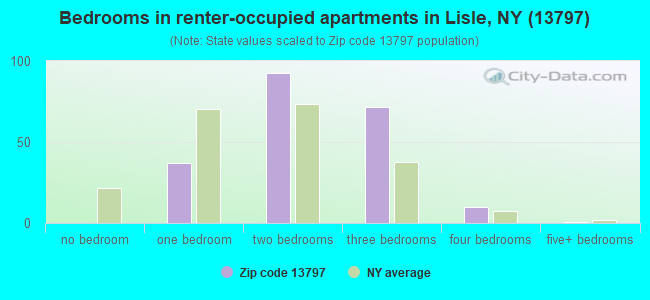
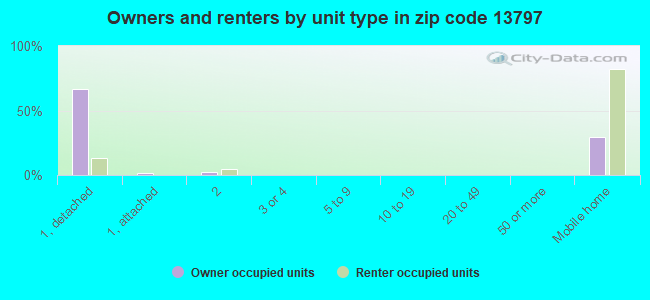
Houses and condos: 852 Renter-occupied apartments: 214
% of renters here:
27%
State:
46%
March 2022 cost of living index in zip code 13797: 93.0 (less than average, U.S. average is 100)
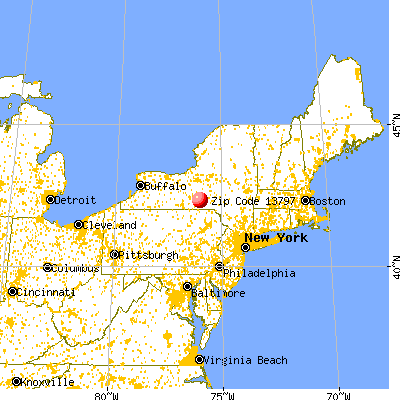
Land area: 33.3 sq. mi. Water area: 0.1 sq. mi.
Population density: 61 people per square mile
(very low).
OSM Map
General Map
Google Map
MSN Map
OSM Map
General Map
Google Map
MSN Map
OSM Map
General Map
Google Map
MSN Map
OSM Map
General Map
Google Map
MSN Map
Please wait while loading the map...
Real estate property taxes paid for housing units in 2022:
This zip code:
2.7% ($2,787)
New York:
1.5% ($6,180)
Median real estate property taxes paid for housing units with mortgages in 2022: $2,928 (2.5%) Median real estate property taxes paid for housing units with no mortgage in 2022: $2,411 (2.9%)
Business Search- 14 Million verified businesses
Males: 960
(47.4%)
Females: 1,067
(52.6%)
For population 25 years and over in 13797:
High school or higher: 86.2%
Bachelor's degree or higher: 17.7%
Graduate or professional degree: 9.0%
Unemployed: 6.1%
Mean travel time to work (commute): 33.0 minutes
For population 15 years and over in 13797:
Never married: 26.2%
Now married: 56.5%
Separated: 2.2%
Widowed: 4.1%
Divorced: 10.9%
Zip code 13797 compared to state average:
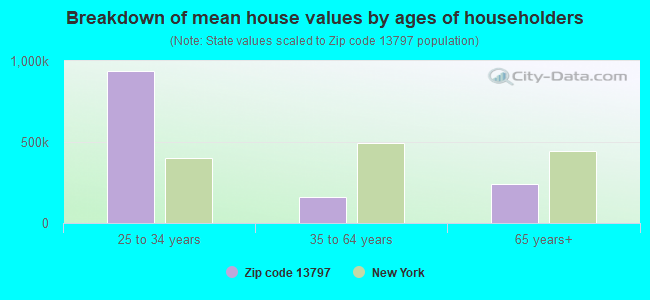
Median house value significantly below state average.
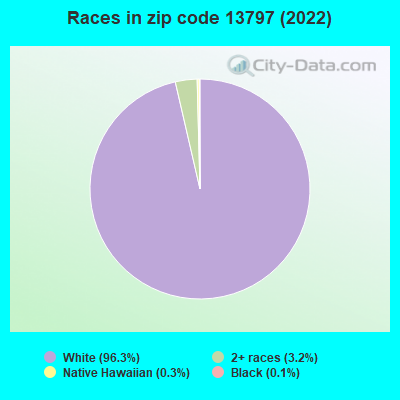
Black race population percentage significantly below state average.
Hispanic race population percentage significantly below state average.
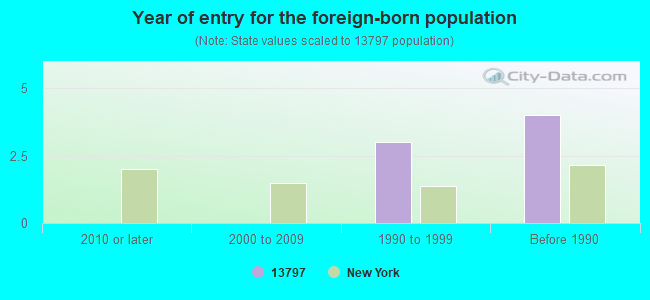
Foreign-born population percentage significantly below state average.
Renting percentage below state average.
Length of stay since moving in significantly above state average.
House age below state average.
Number of college students below state average.
Percentage of population with a bachelor's degree or higher significantly below state average.
Estimated median house/condo value in 2022: $103,514
13797:
$103,514
New York:
$400,400
According to our research of New York and other state lists, there were 2 registered sex offenders living in 13797 zip code as of May 28, 2024. The ratio of all residents to sex offenders in zip code 13797 is 1,134 to 1. The ratio of registered sex offenders to all residents in this zip code is near the state average.
Median resident age:
This zip code:
40.6 years
New York median age:
40.0 years
Average household size:
This zip code:
2.5 people
New York:
2.5 people
Averages for the 2020 tax year for zip code 13797, filed in 2021:
Average Adjusted Gross Income (AGI) in 2020: $50,018 (Individual Income Tax Returns)
Here:
$50,018
State:
$90,930
Salary/wage: $45,695 (reported on 81.5% of returns)
Here:
$45,695
State:
$72,104
(% of AGI for various income ranges: 1115.3% for AGIs below $25k, 3530.4% for AGIs $25k-50k, 5667.5% for AGIs $50k-75k, 9288.3% for AGIs $75k-100k, 16654.3% for AGIs $100k-200k)
Taxable interest for individuals: $753 (reported on 34.8% of returns)
This zip code:
$753
New York:
$3,075
(% of AGI for various income ranges: 12.1% for AGIs below $25k, 22.6% for AGIs $25k-50k, 22.5% for AGIs $50k-75k, 65.0% for AGIs $75k-100k, 142.9% for AGIs $100k-200k)
Ordinary dividends: $1,838 (reported on 14.1% of returns)
Here:
$1,838
State:
$11,095
(% of AGI for various income ranges: 8.9% for AGIs below $25k, 17.8% for AGIs $25k-50k, 70.8% for AGIs $50k-75k, 137.1% for AGIs $100k-200k)
Net capital gain/loss in AGI: +$2,410 (reported on 10.9% of returns)
Here:
+$2,410
State:
+$44,925
(% of AGI for various income ranges: 10.5% for AGIs below $25k, 75.0% for AGIs $50k-75k, 187.1% for AGIs $100k-200k)
Profit/loss from business: +$6,150 (reported on 10.9% of returns)
Here:
+$6,150
State:
+$14,940
(% of AGI for various income ranges: 189.5% for AGIs below $25k, 116.7% for AGIs $50k-75k, 164.3% for AGIs $100k-200k)
Taxable individual retirement arrangement distribution: $10,025 (reported on 8.7% of returns)
13797:
$10,025
New York:
$19,609
(% of AGI for various income ranges: 55.8% for AGIs below $25k, 139.1% for AGIs $25k-50k, 626.7% for AGIs $75k-100k)
Earned income credit: $2,257 (reported on 15.2% of returns)
Here:
$2,257
State:
$2,138
(% of AGI for various income ranges: 85.3% for AGIs below $25k, 67.0% for AGIs $25k-50k)
Percentage of individuals using paid preparers for their 2020 taxes: 94.6%
Here:
95%
State:
95%
(% for various income ranges: 93.1% for AGIs below $25k, 96.3% for AGIs $25k-50k, 100.0% for AGIs $50k-75k, 88.9% for AGIs $75k-100k, 91.7% for AGIs $100k-200k)
Averages for the 2012 tax year for zip code 13797, filed in 2013:
Average Adjusted Gross Income (AGI) in 2012: $40,937 (Individual Income Tax Returns)
Here:
$40,937
State:
$77,088
Salary/wage: $36,645 (reported on 86.3% of returns)
Here:
$36,645
State:
$60,593
(% of AGI for various income ranges: 71.4% for AGIs below $25k, 82.3% for AGIs $25k-50k, 74.4% for AGIs $50k-75k, 81.4% for AGIs $75k-100k, 75.3% for AGIs $100k-200k)
Taxable interest for individuals: $575 (reported on 33.7% of returns)
This zip code:
$575
New York:
$3,125
(% of AGI for various income ranges: 1.2% for AGIs below $25k, 0.3% for AGIs $25k-50k, 0.7% for AGIs $50k-75k, 0.2% for AGIs $75k-100k, 0.3% for AGIs $100k-200k)
Ordinary dividends: $1,313 (reported on 15.8% of returns)
Here:
$1,313
State:
$10,299
(% of AGI for various income ranges: 1.4% for AGIs below $25k, 0.3% for AGIs $25k-50k, 0.3% for AGIs $50k-75k, 0.3% for AGIs $75k-100k, 0.5% for AGIs $100k-200k)
Profit/loss from business: +$3,910 (reported on 10.5% of returns)
Here:
+$3,910
State:
+$16,168
(% of AGI for various income ranges: 4.0% for AGIs below $25k, 2.0% for AGIs $25k-50k)
Taxable individual retirement arrangement distribution: $9,988 (reported on 8.4% of returns)
13797:
$9,988
New York:
$17,621
Total itemized deductions: $17,176 (20% of AGI, reported on 17.9% of returns)
Here:
$17,176
State:
$34,985
Here:
19.7% of AGI
State:
21.3% of AGI
(% of AGI for various income ranges: 4.6% for AGIs below $25k, 5.5% for AGIs $25k-50k, 5.7% for AGIs $50k-75k, 8.6% for AGIs $75k-100k, 11.5% for AGIs $100k-200k)
Charity contributions: $1,990 (reported on 10.5% of returns)
Here:
$1,990
State:
$5,572
(% of AGI for various income ranges: 0.5% for AGIs $25k-50k, 0.8% for AGIs $75k-100k, 1.0% for AGIs $100k-200k)
Taxes paid: $8,024 (reported on 17.9% of returns)
13797:
$8,024
State:
$18,656
(% of AGI for various income ranges: 1.4% for AGIs below $25k, 1.7% for AGIs $25k-50k, 2.3% for AGIs $50k-75k, 4.0% for AGIs $75k-100k, 6.9% for AGIs $100k-200k)
Earned income credit: $1,995 (reported on 21.1% of returns)
Here:
$1,995
State:
$2,230
(% of AGI for various income ranges: 5.5% for AGIs below $25k, 1.3% for AGIs $25k-50k)
Percentage of individuals using paid preparers for their 2012 taxes: 56.8%
Here:
57%
State:
66%
(% for various income ranges: 52.4% for AGIs below $25k, 60.0% for AGIs $25k-50k, 53.8% for AGIs $50k-75k, 62.5% for AGIs $75k-100k, 71.4% for AGIs $100k-200k)
Averages for the 2004 tax year for zip code 13797, filed in 2005:
Average Adjusted Gross Income (AGI) in 2004: $32,193 (Individual Income Tax Returns)
Here:
$32,193
State:
$59,519
Salary/wage: $30,615 (reported on 86.7% of returns)
Here:
$30,615
State:
$50,673
(% of AGI for various income ranges: 105.3% for AGIs below $10k, 70.9% for AGIs $10k-25k, 82.4% for AGIs $25k-50k, 85.3% for AGIs $50k-75k, 90.3% for AGIs $75k-100k, 75.6% for AGIs over 100k)
Taxable interest for individuals: $827 (reported on 44.1% of returns)
This zip code:
$827
New York:
$2,377
(% of AGI for various income ranges: 4.0% for AGIs below $10k, 3.0% for AGIs $10k-25k, 1.2% for AGIs $25k-50k, 0.3% for AGIs $50k-75k, 0.9% for AGIs $75k-100k, 0.3% for AGIs over 100k)
Taxable dividends: $966 (reported on 19.3% of returns)
Here:
$966
State:
$5,394
(% of AGI for various income ranges: 2.1% for AGIs below $10k, 1.6% for AGIs $10k-25k, 0.4% for AGIs $25k-50k, 0.3% for AGIs $50k-75k, 0.6% for AGIs $75k-100k, 0.2% for AGIs over 100k)
Net capital gain/loss: +$1,330 (reported on 12.7% of returns)
Here:
+$1,330
State:
+$23,581
(% of AGI for various income ranges: 1.5% for AGIs below $10k, 0.1% for AGIs $10k-25k, 0.5% for AGIs $25k-50k, 1.3% for AGIs $50k-75k, -0.0% for AGIs $75k-100k)
Profit/loss from business: +$2,347 (reported on 13.4% of returns)
Here:
+$2,347
State:
+$13,809
(% of AGI for various income ranges: 6.9% for AGIs below $10k, 4.3% for AGIs $10k-25k, 0.2% for AGIs $25k-50k, 0.1% for AGIs $50k-75k, 1.0% for AGIs $75k-100k)
IRA payment deduction: $1,600 (reported on 1.1% of returns)
13797:
$1,600
New York:
$3,115
Total itemized deductions: $15,596 (23% of AGI, reported on 16.7% of returns)
Here:
$15,596
State:
$25,864
Here:
22.7% of AGI
State:
21.9% of AGI
(% of AGI for various income ranges: 6.2% for AGIs $10k-25k, 5.5% for AGIs $25k-50k, 8.1% for AGIs $50k-75k, 14.7% for AGIs $75k-100k, 11.7% for AGIs over 100k)
Charity contributions deductions: $1,824 (3% of AGI, reported on 13.2% of returns)
Here:
$1,824
State:
$4,439
Here:
2.6% of AGI
State:
3.6% of AGI
(% of AGI for various income ranges: 0.4% for AGIs $10k-25k, 0.3% for AGIs $25k-50k, 0.6% for AGIs $50k-75k, 2.3% for AGIs $75k-100k, 1.3% for AGIs over 100k)
Total tax: $3,811 (reported on 68.5% of returns)
13797:
$3,811
State:
$11,730
(% of AGI for various income ranges: 2.7% for AGIs below $10k, 3.6% for AGIs $10k-25k, 6.0% for AGIs $25k-50k, 7.9% for AGIs $50k-75k, 8.8% for AGIs $75k-100k, 18.4% for AGIs over 100k)
Earned income credit: $1,787 (reported on 20.8% of returns)
Here:
$1,787
State:
$1,757
Percentage of individuals using paid preparers for their 2004 taxes: 59.0%
Here:
59%
State:
67%
(% for various income ranges: 48.7% for AGIs below $10k, 63.5% for AGIs $10k-25k, 61.5% for AGIs $25k-50k, 63.9% for AGIs $50k-75k, 55.8% for AGIs $75k-100k, 68.0% for AGIs over 100k)
Household received Food Stamps/SNAP in the past 12 months: 174 Household did not receive Food Stamps/SNAP in the past 12 months: 633
Women who had a birth in the past 12 months: 8 (8 now married, 0 unmarried) Women who did not have a birth in the past 12 months: 377 (164 now married, 211 unmarried)
Housing units in zip code 13797 with a mortgage: 310 (28 second mortgage, 3 home equity loan, 25 both second mortgage and home equity loan) Houses without a mortgage: 6
Median monthly owner costs for units with a mortgage: $1,210 Median monthly owner costs for units without a mortgage: $641
Residents with income below the poverty level in 2022:
This zip code:
21.1%
Whole state:
14.3%
Residents with income below 50% of the poverty level in 2022:
This zip code:
20.0%
Whole state:
6.8%
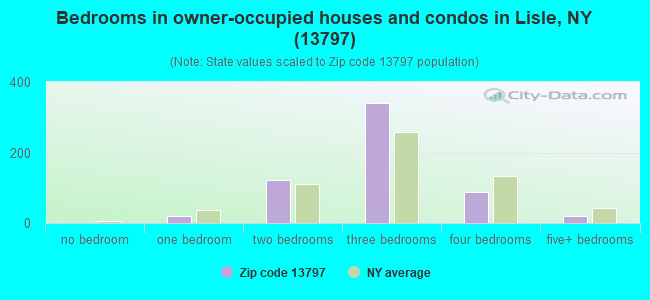
Median number of rooms in houses and condos:
Here:
6.2
State:
6.3
Median number of rooms in apartments:
Here:
4.2
State:
3.8
Notable locations in this zip code not listed on our city pages
Churches in zip code 13797 include: Christian Fellowship Church (A), Lisle Associated Church (B), Saint Patrick's Catholic Church (C). Display/hide their locations on the map
Size of family households: 253 2-persons, 141 3-persons, 98 4-persons, 14 5-persons, 51 6-persons, 8 7-or-more-persons
Size of nonfamily households: 181 1-person, 45 2-persons, 4 3-persons
383 married couples with children.
115 single-parent households (82 men, 33 women).
98.7% of residents of 13797 zip code speak English at home.
0.5% of residents speak Spanish at home (100% very well).
0.5% of residents speak Asian or Pacific Island language at home (100% very well).
Foreign born population: 4 (0.2%) (100.0% of them are naturalized citizens)
This zip code:
0.2%
Whole state:
22.7%
167%Cambodia
22%German
20%Irish
8%American
8%English
4%Italian
4%Polish
3%French
Year of entry for the foreign-born population
02010 or later
02000 to 2009
31990 to 1999
4Before 1990
Facilities with environmental interests located in this zip code:
GLEZEN BROS (1024 CALDWELL ROAD in LISLE, NY)
STATE MASTER (New York facility tracking) - National Pollutant Discharge Elimination System Permit National Pollutant Discharge Elimination System NON-MAJOR (Tracking pollutant discharge elimination systems) - permit Business SIC classification: GENERAL FARMS, PRIMARILY LIVESTOCK AND ANIMAL SPECIALTIES Organizations: DALE/GREGORY GLEZEN (CONTACT/OWNER)
Alternative names: 1, DALE/GREGORY GLEZEN, GIEZEN BROS.
Housing units lacking complete plumbing facilities: 4.4% Housing units lacking complete kitchen facilities: 3.4%
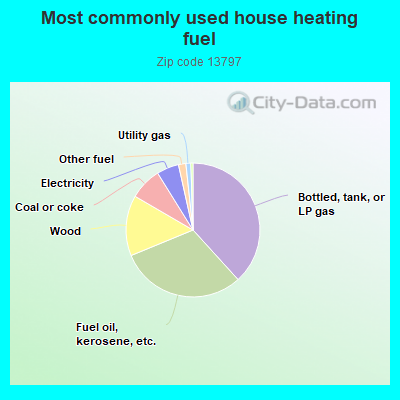
38.5%Bottled, tank, or LP gas
30.7%Fuel oil, kerosene, etc.
14.7%Wood
7.8%Coal or coke
5.4%Electricity
1.8%Other fuel
1.2%Utility gas
0.5%Solar energy
Population in 1990: 2,331. Population change in the 1990s: +74 (+3.2%).
Place of birth for U.S.-born residents:
This state: 1,720
Northeast: 169
Midwest: 27
South: 52
West: 44
73% of the 13797 zip code residents lived in the same house 5 years ago. Out of people who lived in different houses, 77% lived in this county. Out of people who lived in different counties, 50% lived in New York.
97% of the 13797 zip code residents lived in the same house 1 year ago. Out of people who lived in different houses, 53% moved from this county. Out of people who lived in different houses, 41% moved from different county within same state.
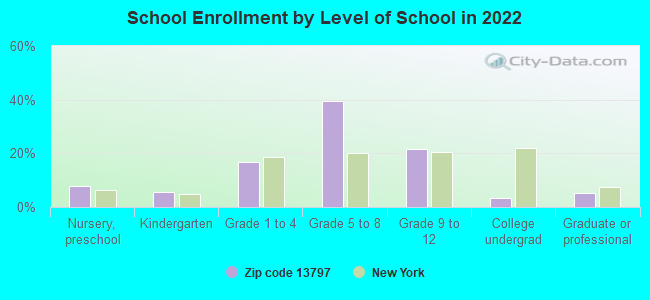
Private vs. public school enrollment:
Students in private schools in grades 1 to 8 (elementary and middle school): 34
Here:
11.8%
New York:
15.6%
Students in private schools in grades 9 to 12 (high school): 12
Here:
10.7%
New York:
15.0%
Students in private undergraduate colleges: 5
Here:
33.2%
New York:
39.2%
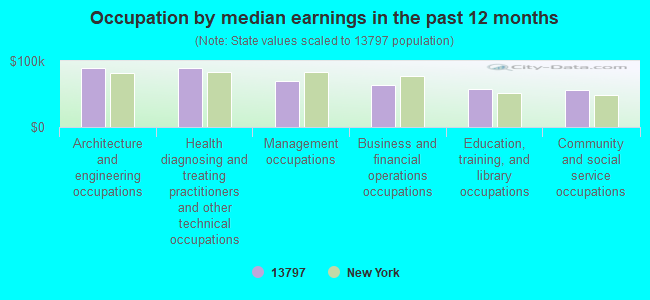
Occupation by median earnings in the past 12 months ($)
90,124Architecture and engineering occupations
89,942Health diagnosing and treating practitioners and other technical occupations
69,638Management occupations
63,636Business and financial operations occupations
56,884Education, training, and library occupations
56,654Community and social service occupations
Companies with federal contracts located in this zip code:
PENDELL CONSTRUCTION (199 SMITH HILL ROAD in LISLE, NY; small business) : $112,140 in 24 contractsfrom 2004 to 2005
Contracts for Maintenance, Repair or Alteration of Real Property -- Other Non-Building Facilities by Army, U.S. Army Corps of Engineers - civil program financing only Signed by year:2000: $0; 2001: $0; 2002: $0; 2003: $0; 2004: $65,828; 2005: $46,312; 2006: $0.
Biggest contracts:
$18,290 with Army for Maintenance, Repair or Alteration of Real Property -- Other Non-Building Facilities. Signed on 2004-07-30. Completion date: 2004-06-02.
$18,290 with U.S. Army Corps of Engineers - civil program financing only for Maintenance, Repair or Alteration of Real Property -- Other Non-Building Facilities. Signed on 2004-07-30. Completion date: 2004-06-02.
$7,497 with Army for Maintenance, Repair or Alteration of Real Property -- Other Non-Building Facilities. Signed on 2005-06-10. Completion date: 2005-06-15.
$7,497 with U.S. Army Corps of Engineers - civil program financing only for Maintenance, Repair or Alteration of Real Property -- Other Non-Building Facilities. Signed on 2005-06-10. Completion date: 2005-06-15.
Top industries in this zip code by the number of employees in 2005:
Construction: All Other Specialty Trade Contractors (5-9 employees: 1 establishment)
Health Care and Social Assistance: Offices of Physicians (except Mental Health Specialists) (5-9: 1)
Real Estate and Rental and Leasing: Other Commercial and Industrial Machinery and Equipment Rental and Leasing (5-9: 1)
Other Services (except Public Administration): Beauty Salons (1-4: 1)
Construction: Site Preparation Contractors (1-4: 1)
Information: Libraries and Archives (1-4: 1)
Accommodation and Food Services: Drinking Places (Alcoholic Beverages) (1-4: 1)
Accommodation and Food Services: Limited-Service Restaurants (1-4: 1)
Construction: Flooring Contractors (1-4: 1)
Fatal accident statistics in 2013:
Fatal accident count: 1
Vehicles involved in fatal accidents: 1
Fatal accidents caused by drunken drivers: 0
Fatalities: 1
Persons involved in fatal accidents: 1
Pedestrians involved in fatal accidents: 0
Fatal accident statistics in 2011:
Fatal accident count: 1
Vehicles involved in fatal accidents: 2
Fatal accidents caused by drunken drivers: 0
Fatalities: 1
Persons involved in fatal accidents: 3
Pedestrians involved in fatal accidents: 1
Home Mortgage Disclosure Act Aggregated Statistics For Year 2009 (Based on 4 partial tracts)
A) FHA, FSA/RHS & VA Home Purchase Loans
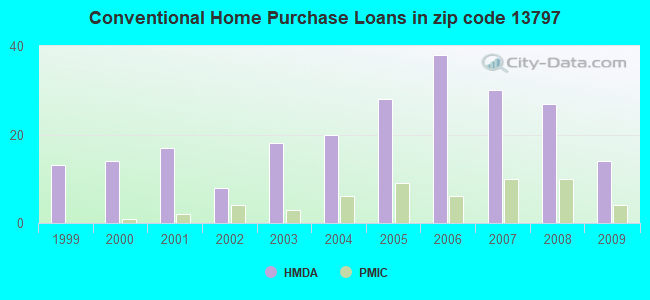
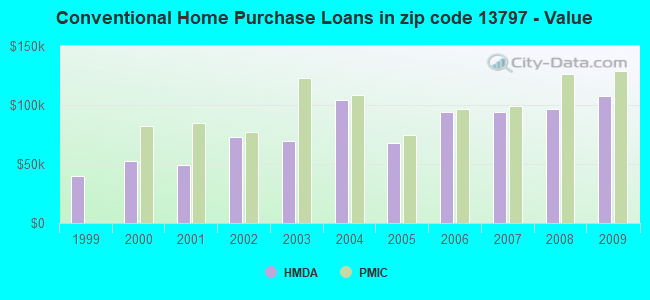
B) Conventional Home Purchase Loans
C) Refinancings
D) Home Improvement Loans
F) Non-occupant Loans on < 5 Family Dwellings (A B C & D)
G) Loans On Manufactured Home Dwelling (A B C & D)
Number
Average Value
Number
Average Value
Number
Average Value
Number
Average Value
Number
Average Value
Number
Average Value
LOANS ORIGINATED
12
$112,405
14
$107,488
32
$109,075
13
$47,863
3
$232,347
6
$75,490
APPLICATIONS APPROVED, NOT ACCEPTED
2
$117,900
3
$51,417
3
$48,640
1
$68,520
0
$0
6
$57,077
APPLICATIONS DENIED
3
$117,370
5
$52,748
17
$69,475
7
$19,809
3
$33,837
5
$48,972
APPLICATIONS WITHDRAWN
2
$75,480
4
$44,888
15
$114,816
2
$94,100
0
$0
2
$3,170
FILES CLOSED FOR INCOMPLETENESS
0
$0
1
$84,590
3
$79,643
0
$0
0
$0
2
$49,150
Aggregated Statistics For Year 2008 (Based on 4 partial tracts)
A) FHA, FSA/RHS & VA Home Purchase Loans
B) Conventional Home Purchase Loans
C) Refinancings
D) Home Improvement Loans
F) Non-occupant Loans on < 5 Family Dwellings (A B C & D)
G) Loans On Manufactured Home Dwelling (A B C & D)
Number
Average Value
Number
Average Value
Number
Average Value
Number
Average Value
Number
Average Value
Number
Average Value
LOANS ORIGINATED
7
$128,501
27
$96,949
26
$76,466
13
$27,439
2
$135,245
18
$56,854
APPLICATIONS APPROVED, NOT ACCEPTED
4
$108,315
1
$109,970
10
$91,681
0
$0
0
$0
3
$82,033
APPLICATIONS DENIED
2
$68,960
11
$143,519
21
$83,370
23
$29,400
2
$162,165
12
$58,736
APPLICATIONS WITHDRAWN
2
$88,340
2
$94,290
6
$99,043
6
$39,563
1
$35,950
3
$70,450
FILES CLOSED FOR INCOMPLETENESS
0
$0
0
$0
0
$0
0
$0
0
$0
0
$0
Aggregated Statistics For Year 2007 (Based on 4 partial tracts)
A) FHA, FSA/RHS & VA Home Purchase Loans
B) Conventional Home Purchase Loans
C) Refinancings
D) Home Improvement Loans
F) Non-occupant Loans on < 5 Family Dwellings (A B C & D)
G) Loans On Manufactured Home Dwelling (A B C & D)
Number
Average Value
Number
Average Value
Number
Average Value
Number
Average Value
Number
Average Value
Number
Average Value
LOANS ORIGINATED
7
$107,304
30
$94,462
34
$77,391
20
$26,774
3
$75,237
16
$57,951
APPLICATIONS APPROVED, NOT ACCEPTED
0
$0
2
$37,155
8
$92,496
1
$2,740
1
$158,610
3
$50,047
APPLICATIONS DENIED
1
$84,050
13
$69,900
32
$80,377
14
$26,576
1
$230,230
15
$47,759
APPLICATIONS WITHDRAWN
2
$105,740
2
$71,465
12
$76,451
3
$47,793
0
$0
2
$105,740
FILES CLOSED FOR INCOMPLETENESS
0
$0
1
$79,480
0
$0
2
$57,100
0
$0
0
$0
Aggregated Statistics For Year 2006 (Based on 4 partial tracts)
A) FHA, FSA/RHS & VA Home Purchase Loans
B) Conventional Home Purchase Loans
C) Refinancings
D) Home Improvement Loans
F) Non-occupant Loans on < 5 Family Dwellings (A B C & D)
G) Loans On Manufactured Home Dwelling (A B C & D)
Number
Average Value
Number
Average Value
Number
Average Value
Number
Average Value
Number
Average Value
Number
Average Value
LOANS ORIGINATED
2
$61,800
38
$94,359
45
$68,422
30
$26,782
6
$97,428
22
$47,940
APPLICATIONS APPROVED, NOT ACCEPTED
2
$87,900
11
$66,300
10
$82,260
1
$10,570
3
$77,843
5
$48,640
APPLICATIONS DENIED
1
$144,860
15
$66,893
31
$67,261
17
$17,887
8
$62,249
8
$56,741
APPLICATIONS WITHDRAWN
2
$56,040
2
$52,970
27
$87,600
4
$32,928
0
$0
0
$0
FILES CLOSED FOR INCOMPLETENESS
0
$0
0
$0
3
$121,677
0
$0
0
$0
0
$0
Aggregated Statistics For Year 2005 (Based on 4 partial tracts)
A) FHA, FSA/RHS & VA Home Purchase Loans
B) Conventional Home Purchase Loans
C) Refinancings
D) Home Improvement Loans
F) Non-occupant Loans on < 5 Family Dwellings (A B C & D)
G) Loans On Manufactured Home Dwelling (A B C & D)
Number
Average Value
Number
Average Value
Number
Average Value
Number
Average Value
Number
Average Value
Number
Average Value
LOANS ORIGINATED
6
$96,782
28
$68,105
43
$68,304
18
$23,017
0
$0
18
$37,507
APPLICATIONS APPROVED, NOT ACCEPTED
1
$129,730
12
$59,791
13
$85,920
3
$18,013
0
$0
11
$48,646
APPLICATIONS DENIED
0
$0
13
$93,985
36
$73,098
14
$32,179
2
$2,115
13
$69,398
APPLICATIONS WITHDRAWN
2
$106,725
3
$85,583
31
$96,088
2
$637,085
1
$101,510
5
$69,232
FILES CLOSED FOR INCOMPLETENESS
0
$0
0
$0
15
$89,467
1
$65,780
0
$0
0
$0
Aggregated Statistics For Year 2004 (Based on 4 partial tracts)
A) FHA, FSA/RHS & VA Home Purchase Loans
B) Conventional Home Purchase Loans
C) Refinancings
D) Home Improvement Loans
F) Non-occupant Loans on < 5 Family Dwellings (A B C & D)
G) Loans On Manufactured Home Dwelling (A B C & D)
Number
Average Value
Number
Average Value
Number
Average Value
Number
Average Value
Number
Average Value
Number
Average Value
LOANS ORIGINATED
8
$95,225
20
$104,014
36
$59,709
20
$33,874
3
$64,150
10
$55,217
APPLICATIONS APPROVED, NOT ACCEPTED
0
$0
1
$9,520
5
$86,162
2
$7,930
0
$0
1
$9,520
APPLICATIONS DENIED
2
$78,775
11
$62,291
48
$73,782
13
$20,949
1
$119,490
19
$60,161
APPLICATIONS WITHDRAWN
0
$0
1
$76,130
23
$90,462
1
$77,190
0
$0
2
$62,915
FILES CLOSED FOR INCOMPLETENESS
0
$0
2
$79,940
6
$89,022
2
$26,435
0
$0
1
$26,430
Aggregated Statistics For Year 2003 (Based on 4 partial tracts)
A) FHA, FSA/RHS & VA Home Purchase Loans
B) Conventional Home Purchase Loans
C) Refinancings
D) Home Improvement Loans
F) Non-occupant Loans on < 5 Family Dwellings (A B C & D)
Number
Average Value
Number
Average Value
Number
Average Value
Number
Average Value
Number
Average Value
LOANS ORIGINATED
6
$74,927
18
$69,880
70
$71,207
15
$12,633
2
$64,865
APPLICATIONS APPROVED, NOT ACCEPTED
2
$40,200
4
$54,192
7
$65,253
1
$26,430
0
$0
APPLICATIONS DENIED
2
$76,660
13
$50,517
37
$60,065
4
$13,848
1
$38,370
APPLICATIONS WITHDRAWN
2
$79,515
0
$0
14
$75,864
1
$1,060
0
$0
FILES CLOSED FOR INCOMPLETENESS
0
$0
0
$0
2
$98,865
1
$91,360
0
$0
Aggregated Statistics For Year 2002 (Based on 2 partial tracts)
A) FHA, FSA/RHS & VA Home Purchase Loans
B) Conventional Home Purchase Loans
C) Refinancings
D) Home Improvement Loans
F) Non-occupant Loans on < 5 Family Dwellings (A B C & D)
Number
Average Value
Number
Average Value
Number
Average Value
Number
Average Value
Number
Average Value
LOANS ORIGINATED
2
$71,905
8
$73,225
20
$69,524
11
$12,112
1
$7,400
APPLICATIONS APPROVED, NOT ACCEPTED
0
$0
2
$37,010
4
$70,318
1
$17,980
2
$37,010
APPLICATIONS DENIED
1
$68,730
2
$60,800
24
$60,008
10
$9,622
1
$26,430
APPLICATIONS WITHDRAWN
0
$0
2
$92,520
8
$63,576
2
$13,745
0
$0
FILES CLOSED FOR INCOMPLETENESS
0
$0
0
$0
1
$100,450
0
$0
0
$0
Aggregated Statistics For Year 2001 (Based on 2 partial tracts)
A) FHA, FSA/RHS & VA Home Purchase Loans
B) Conventional Home Purchase Loans
C) Refinancings
D) Home Improvement Loans
F) Non-occupant Loans on < 5 Family Dwellings (A B C & D)
Number
Average Value
Number
Average Value
Number
Average Value
Number
Average Value
Number
Average Value
LOANS ORIGINATED
2
$63,975
17
$49,200
27
$61,486
7
$11,027
1
$88,820
APPLICATIONS APPROVED, NOT ACCEPTED
1
$41,240
7
$28,247
3
$42,650
1
$14,800
0
$0
APPLICATIONS DENIED
2
$71,375
13
$49,210
20
$44,146
12
$19,209
1
$52,870
APPLICATIONS WITHDRAWN
0
$0
0
$0
12
$49,169
0
$0
0
$0
FILES CLOSED FOR INCOMPLETENESS
0
$0
0
$0
2
$59,215
0
$0
0
$0
Aggregated Statistics For Year 2000 (Based on 2 partial tracts)
A) FHA, FSA/RHS & VA Home Purchase Loans
B) Conventional Home Purchase Loans
C) Refinancings
D) Home Improvement Loans
F) Non-occupant Loans on < 5 Family Dwellings (A B C & D)
Number
Average Value
Number
Average Value
Number
Average Value
Number
Average Value
Number
Average Value
LOANS ORIGINATED
7
$64,653
14
$52,644
8
$54,985
5
$9,516
0
$0
APPLICATIONS APPROVED, NOT ACCEPTED
0
$0
6
$71,727
4
$48,640
1
$20,090
0
$0
APPLICATIONS DENIED
1
$96,220
35
$48,157
19
$46,081
7
$12,084
3
$44,057
APPLICATIONS WITHDRAWN
0
$0
1
$70,850
2
$23,790
0
$0
0
$0
FILES CLOSED FOR INCOMPLETENESS
0
$0
0
$0
2
$43,355
0
$0
0
$0
Aggregated Statistics For Year 1999 (Based on 2 partial tracts)
A) FHA, FSA/RHS & VA Home Purchase Loans
B) Conventional Home Purchase Loans
C) Refinancings
D) Home Improvement Loans
F) Non-occupant Loans on < 5 Family Dwellings (A B C & D)
Detailed PMIC statistics for the following Tracts:0119.03
, 0120.00
2002 - 2018 National Fire Incident Reporting System (NFIRS) incidents
According to the data from the years 2002 - 2018 the average number of fires per year is 9. The highest number of reported fire incidents - 31 took place in 2004, and the least - 0 in 2014. The data has a dropping trend.
When looking into fire subcategories, the most incidents belonged to: Structure Fires (52.3%), and Outside Fires (31.0%).
Fire incident types reported to NFIRS in Zip Code 13797


 Nearest zip codes: 13794, 13777, 13802, 13862, 13803, 13835.
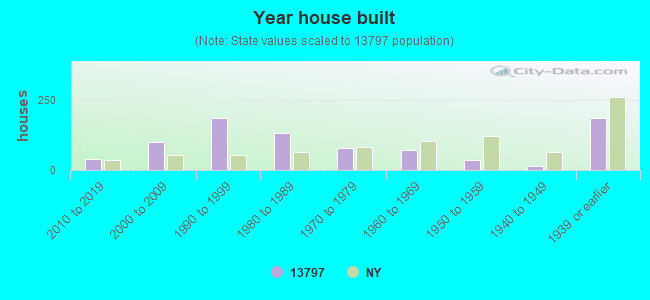


 According to the data from the years 2002 - 2018 the average number of fires per year is 9. The highest number of reported fire incidents - 31 took place in 2004, and the least - 0 in 2014. The data has a dropping trend.
 When looking into fire subcategories, the most incidents belonged to: Structure Fires (52.3%), and Outside Fires (31.0%).