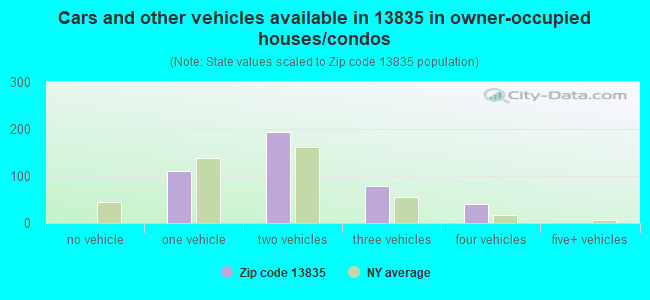
Estimated zip code population in 2022: 1,280 Zip code population in 2010: 1,511 Zip code population in 2000: 1,545
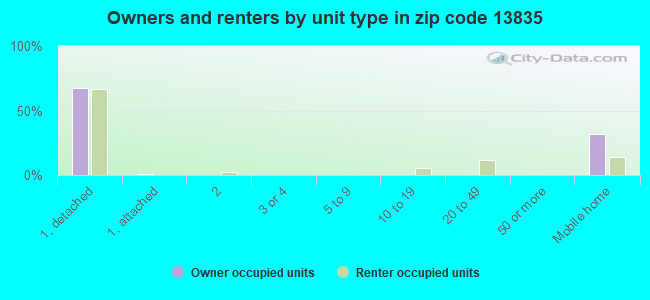
Houses and condos: 630 Renter-occupied apartments: 120
% of renters here:
22%
State:
46%
March 2022 cost of living index in zip code 13835: 93.3 (less than average, U.S. average is 100)
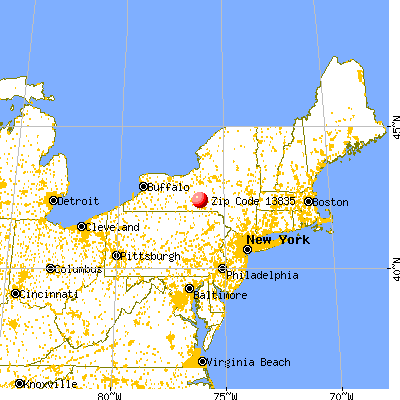
Land area: 42.2 sq. mi. Water area: 0.0 sq. mi.
Population density: 30 people per square mile
(very low).
OSM Map
General Map
Google Map
MSN Map
OSM Map
General Map
Google Map
MSN Map
OSM Map
General Map
Google Map
MSN Map
OSM Map
General Map
Google Map
MSN Map
Please wait while loading the map...
Real estate property taxes paid for housing units in 2022:
This zip code:
2.9% ($2,951)
New York:
1.5% ($6,180)
Median real estate property taxes paid for housing units with mortgages in 2022: $2,985 (2.3%) Median real estate property taxes paid for housing units with no mortgage in 2022: $2,907 (3.7%)
Averages for the 2020 tax year for zip code 13835, filed in 2021:
Average Adjusted Gross Income (AGI) in 2020: $49,998 (Individual Income Tax Returns)
Here:
$49,998
State:
$90,930
Salary/wage: $43,924 (reported on 82.3% of returns)
Here:
$43,924
State:
$72,104
(% of AGI for various income ranges: 1205.0% for AGIs below $25k, 3168.9% for AGIs $25k-50k, 5993.8% for AGIs $50k-75k, 9600.0% for AGIs $75k-100k, 15937.5% for AGIs $100k-200k)
Taxable interest for individuals: $412 (reported on 25.8% of returns)
This zip code:
$412
New York:
$3,075
(% of AGI for various income ranges: 8.6% for AGIs below $25k, 13.9% for AGIs $25k-50k, 3.8% for AGIs $50k-75k, 15.0% for AGIs $75k-100k, 50.0% for AGIs $100k-200k)
Ordinary dividends: $1,912 (reported on 12.9% of returns)
Here:
$1,912
State:
$11,095
(% of AGI for various income ranges: 27.9% for AGIs below $25k, 28.7% for AGIs $50k-75k, 227.5% for AGIs $100k-200k)
Net capital gain/loss in AGI: +$7,600 (reported on 9.7% of returns)
Here:
+$7,600
State:
+$44,925
(% of AGI for various income ranges: 45.0% for AGIs $25k-50k, 937.5% for AGIs $100k-200k)
Profit/loss from business: +$4,788 (reported on 12.9% of returns)
Here:
+$4,788
State:
+$14,940
(% of AGI for various income ranges: 105.0% for AGIs below $25k, 122.2% for AGIs $25k-50k, 40.0% for AGIs $75k-100k)
Taxable individual retirement arrangement distribution: $11,850 (reported on 9.7% of returns)
13835:
$11,850
New York:
$19,609
(% of AGI for various income ranges: 182.1% for AGIs below $25k, 570.0% for AGIs $50k-75k)
Earned income credit: $2,482 (reported on 17.7% of returns)
Here:
$2,482
State:
$2,138
(% of AGI for various income ranges: 107.9% for AGIs below $25k, 67.8% for AGIs $25k-50k)
Percentage of individuals using paid preparers for their 2020 taxes: 100.0%
Here:
100%
State:
95%
(% for various income ranges: 100.0% for AGIs below $25k, 100.0% for AGIs $25k-50k, 100.0% for AGIs $50k-75k, 100.0% for AGIs $75k-100k, 100.0% for AGIs $100k-200k)
Averages for the 2012 tax year for zip code 13835, filed in 2013:
Average Adjusted Gross Income (AGI) in 2012: $39,905 (Individual Income Tax Returns)
Here:
$39,905
State:
$77,088
Salary/wage: $37,555 (reported on 84.8% of returns)
Here:
$37,555
State:
$60,593
(% of AGI for various income ranges: 77.7% for AGIs below $25k, 83.7% for AGIs $25k-50k, 80.7% for AGIs $50k-75k, 81.2% for AGIs $75k-100k, 73.0% for AGIs $100k-200k)
Taxable interest for individuals: $447 (reported on 28.8% of returns)
This zip code:
$447
New York:
$3,125
(% of AGI for various income ranges: 0.4% for AGIs below $25k, 0.6% for AGIs $25k-50k, 0.3% for AGIs $50k-75k, 0.2% for AGIs $75k-100k)
Ordinary dividends: $838 (reported on 12.1% of returns)
Here:
$838
State:
$10,299
Net capital gain/loss in AGI: +$3,650 (reported on 6.1% of returns)
Here:
+$3,650
State:
+$42,474
Profit/loss from business: +$4,625 (reported on 12.1% of returns)
Here:
+$4,625
State:
+$16,168
Taxable individual retirement arrangement distribution: $10,300 (reported on 7.6% of returns)
13835:
$10,300
New York:
$17,621
Total itemized deductions: $17,000 (22% of AGI, reported on 19.7% of returns)
Here:
$17,000
State:
$34,985
Here:
22.4% of AGI
State:
21.3% of AGI
(% of AGI for various income ranges: 9.2% for AGIs $25k-50k, 7.1% for AGIs $50k-75k, 9.1% for AGIs $75k-100k, 13.3% for AGIs $100k-200k)
Charity contributions: $1,414 (reported on 10.6% of returns)
Here:
$1,414
State:
$5,572
(% of AGI for various income ranges: 1.3% for AGIs $50k-75k, 0.5% for AGIs $100k-200k)
Taxes paid: $7,831 (reported on 19.7% of returns)
13835:
$7,831
State:
$18,656
(% of AGI for various income ranges: 2.7% for AGIs $25k-50k, 3.2% for AGIs $50k-75k, 5.2% for AGIs $75k-100k, 7.5% for AGIs $100k-200k)
Earned income credit: $2,092 (reported on 18.2% of returns)
Here:
$2,092
State:
$2,230
(% of AGI for various income ranges: 6.1% for AGIs below $25k, 0.8% for AGIs $25k-50k)
Percentage of individuals using paid preparers for their 2012 taxes: 47.0%
Here:
47%
State:
66%
(% for various income ranges: 42.3% for AGIs below $25k, 50.0% for AGIs $25k-50k, 50.0% for AGIs $50k-75k, 50.0% for AGIs $75k-100k, 50.0% for AGIs $100k-200k)
Averages for the 2004 tax year for zip code 13835, filed in 2005:
Average Adjusted Gross Income (AGI) in 2004: $32,695 (Individual Income Tax Returns)
Here:
$32,695
State:
$59,519
Salary/wage: $31,170 (reported on 89.1% of returns)
Here:
$31,170
State:
$50,673
(% of AGI for various income ranges: 84.9% for AGIs below $10k, 78.8% for AGIs $10k-25k, 90.3% for AGIs $25k-50k, 88.4% for AGIs $50k-75k, 82.3% for AGIs $75k-100k, 66.4% for AGIs over 100k)
Taxable interest for individuals: $797 (reported on 39.3% of returns)
This zip code:
$797
New York:
$2,377
(% of AGI for various income ranges: 3.4% for AGIs below $10k, 3.3% for AGIs $10k-25k, 0.5% for AGIs $25k-50k, 0.5% for AGIs $50k-75k, 0.6% for AGIs $75k-100k)
Taxable dividends: $854 (reported on 14.5% of returns)
Here:
$854
State:
$5,394
(% of AGI for various income ranges: 1.0% for AGIs below $10k, 1.4% for AGIs $10k-25k, 0.2% for AGIs $25k-50k, 0.1% for AGIs $50k-75k, 0.4% for AGIs $75k-100k)
Net capital gain/loss: +$44 (reported on 7.3% of returns)
Here:
+$44
State:
+$23,581
Profit/loss from business: +$3,638 (reported on 13.1% of returns)
Here:
+$3,638
State:
+$13,809
(% of AGI for various income ranges: 10.8% for AGIs below $10k, 1.9% for AGIs $10k-25k, 2.4% for AGIs $25k-50k, 0.1% for AGIs $50k-75k)
IRA payment deduction: $1,714 (reported on 2.3% of returns)
13835:
$1,714
New York:
$3,115
Total itemized deductions: $12,974 (22% of AGI, reported on 18.9% of returns)
Here:
$12,974
State:
$25,864
Here:
22.0% of AGI
State:
21.9% of AGI
(% of AGI for various income ranges: 4.9% for AGIs $10k-25k, 5.9% for AGIs $25k-50k, 10.7% for AGIs $50k-75k, 8.6% for AGIs $75k-100k, 10.8% for AGIs over 100k)
Charity contributions deductions: $1,094 (2% of AGI, reported on 13.9% of returns)
Here:
$1,094
State:
$4,439
Here:
1.7% of AGI
State:
3.6% of AGI
Total tax: $3,670 (reported on 73.1% of returns)
13835:
$3,670
State:
$11,730
(% of AGI for various income ranges: 2.4% for AGIs below $10k, 3.7% for AGIs $10k-25k, 6.5% for AGIs $25k-50k, 8.9% for AGIs $50k-75k, 12.1% for AGIs $75k-100k, 17.4% for AGIs over 100k)
Earned income credit: $1,616 (reported on 20.4% of returns)
Here:
$1,616
State:
$1,757
Percentage of individuals using paid preparers for their 2004 taxes: 59.4%
Here:
59%
State:
67%
(% for various income ranges: 53.0% for AGIs below $10k, 61.8% for AGIs $10k-25k, 61.4% for AGIs $25k-50k, 57.7% for AGIs $50k-75k, 83.9% for AGIs $75k-100k)
Household received Food Stamps/SNAP in the past 12 months: 92 Household did not receive Food Stamps/SNAP in the past 12 months: 458
Women who had a birth in the past 12 months: 2 (2 now married, 0 unmarried) Women who did not have a birth in the past 12 months: 193 (90 now married, 102 unmarried)
Housing units in zip code 13835 with a mortgage: 212 (16 second mortgage, 17 both second mortgage and home equity loan) Houses without a mortgage: 12
Median monthly owner costs for units with a mortgage: $1,292 Median monthly owner costs for units without a mortgage: $629
Residents with income below the poverty level in 2022:
This zip code:
10.8%
Whole state:
14.3%
Residents with income below 50% of the poverty level in 2022:
This zip code:
4.0%
Whole state:
6.8%
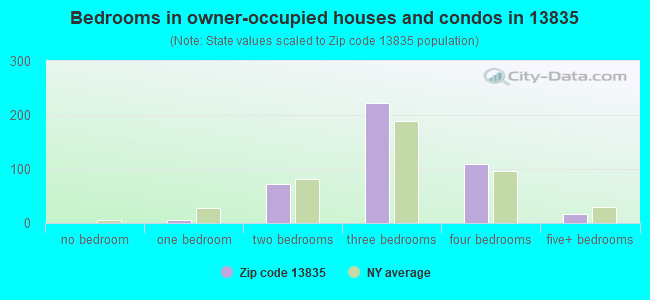
Median number of rooms in houses and condos:
Here:
6.7
State:
6.3
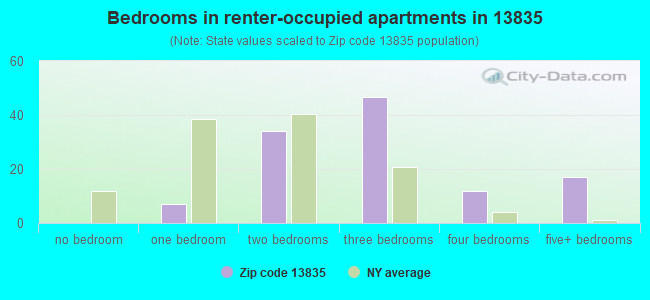
Median number of rooms in apartments:
Here:
6.4
State:
3.8
Notable locations in this zip code not listed on our city pages
Size of family households: 208 2-persons, 62 3-persons, 42 4-persons, 27 5-persons, 18 6-persons
Size of nonfamily households: 135 1-person, 58 2-persons
156 married couples with children.
49 single-parent households (11 men, 38 women).
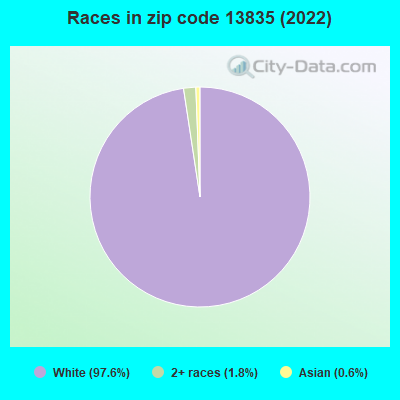
99.4% of residents of 13835 zip code speak English at home.
0.5% of residents speak other Indo-European language at home (100% very well).
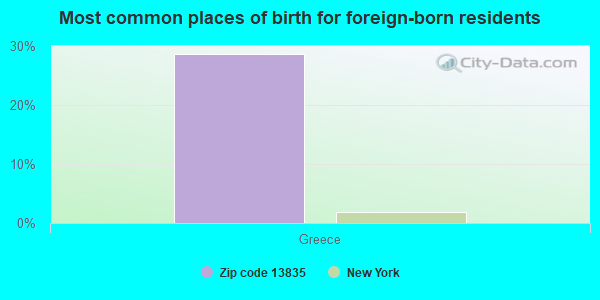
Foreign born population: 7 (0.6%) (38.7% of them are naturalized citizens)
This zip code:
0.6%
Whole state:
22.7%
29%Greece
32%English
23%American
15%European
8%German
7%Irish
3%Pennsylvania German
1%Scottish
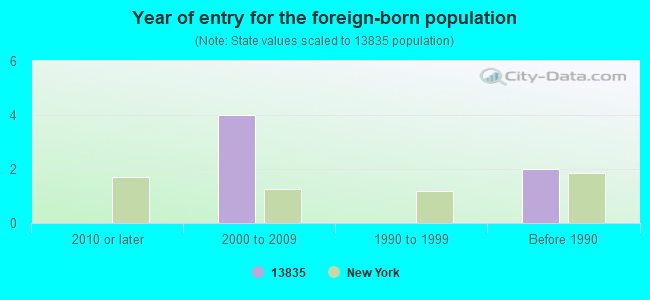
Year of entry for the foreign-born population
02010 or later
42000 to 2009
01990 to 1999
2Before 1990
Facilities with environmental interests located in this zip code:
A T & T (APPROX 3 MI W OF RICHFORD ON in RICHFORD, NY)
Conditionally Exempt Small Quantity Generators, less than 100 kg/month of hazardous waste (Resource Conservation and Recovery Act (tracking hazardous waste)) - notification
Housing units lacking complete plumbing facilities: 8.1% Housing units lacking complete kitchen facilities: 1.9%
32.1%Wood
27.8%Fuel oil, kerosene, etc.
22.2%Bottled, tank, or LP gas
10.3%Coal or coke
5.2%Electricity
2.1%Other fuel
Population in 1990: 1,383. Population change in the 1990s: +162 (+11.7%).
Place of birth for U.S.-born residents:
This state: 1,023
Northeast: 123
Midwest: 50
South: 53
West: 19
66% of the 13835 zip code residents lived in the same house 5 years ago. Out of people who lived in different houses, 47% lived in this county. Out of people who lived in different counties, 50% lived in New York.
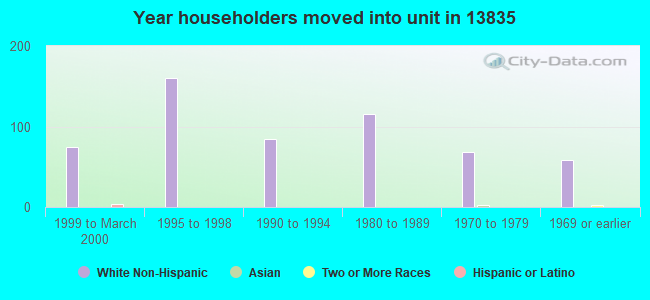
90% of the 13835 zip code residents lived in the same house 1 year ago. Out of people who lived in different houses, 81% moved from this county. Out of people who lived in different houses, 11% moved from different county within same state. Out of people who lived in different houses, 4% moved from different state.
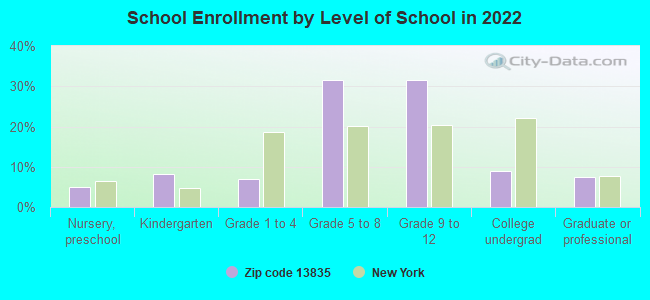
Private vs. public school enrollment:
Students in private schools in grades 1 to 8 (elementary and middle school):
Here:
0.0%
New York:
15.6%
Students in private schools in grades 9 to 12 (high school): 3
Here:
3.8%
New York:
15.0%
Students in private undergraduate colleges:
Here:
0.0%
New York:
39.2%
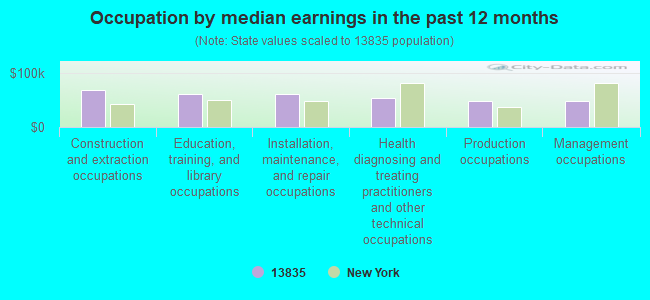
Occupation by median earnings in the past 12 months ($)
68,379Construction and extraction occupations
61,224Education, training, and library occupations
60,796Installation, maintenance, and repair occupations
54,478Health diagnosing and treating practitioners and other technical occupations
49,315Production occupations
48,929Management occupations
Top industries in this zip code by the number of employees in 2005:
Construction: Water and Sewer Line and Related Structures Construction (5-9 employees: 1 establishment)
Construction: Site Preparation Contractors (1-4: 1)
Construction: New Single-Family Housing Construction (except Operative Builders) (1-4: 1)
Real Estate and Rental and Leasing: Offices of Real Estate Appraisers (1-4: 1)
Professional, Scientific, and Technical Services: Graphic Design Services (1-4: 1)
Arts, Entertainment, and Recreation: Other Spectator Sports (1-4: 1)
Administrative and Support and Waste Management and Remediation Services: Employment Placement Agencies (1-4: 1)
Accommodation and Food Services: Full-Service Restaurants (1-4: 1)
Fatal accident statistics in 2012:
Fatal accident count: 3
Vehicles involved in fatal accidents: 4
Fatal accidents caused by drunken drivers: 1
Fatalities: 3
Persons involved in fatal accidents: 5
Pedestrians involved in fatal accidents: 0
Home Mortgage Disclosure Act Aggregated Statistics For Year 2009 (Based on 4 partial tracts)
A) FHA, FSA/RHS & VA Home Purchase Loans
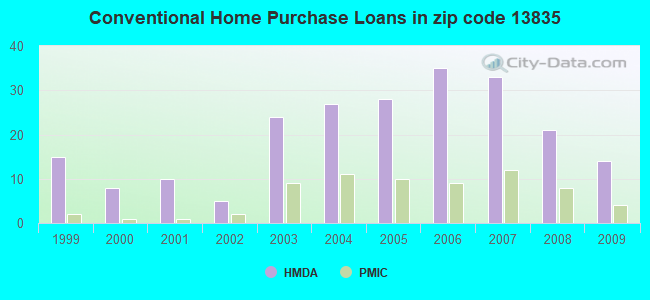
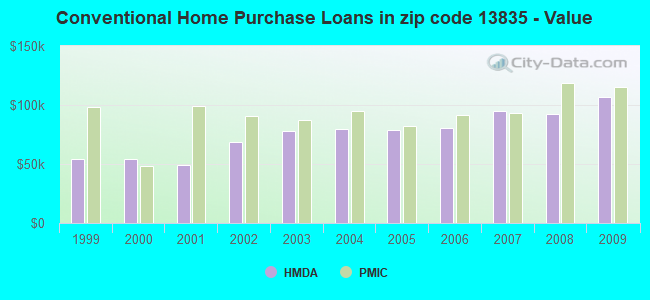
B) Conventional Home Purchase Loans
C) Refinancings
D) Home Improvement Loans
F) Non-occupant Loans on < 5 Family Dwellings (A B C & D)
G) Loans On Manufactured Home Dwelling (A B C & D)
Number
Average Value
Number
Average Value
Number
Average Value
Number
Average Value
Number
Average Value
Number
Average Value
LOANS ORIGINATED
13
$107,676
14
$106,999
29
$107,608
12
$36,989
2
$145,095
3
$36,087
APPLICATIONS APPROVED, NOT ACCEPTED
2
$80,580
4
$83,302
4
$84,972
1
$38,170
0
$0
5
$54,178
APPLICATIONS DENIED
4
$110,745
5
$79,810
25
$83,394
7
$18,356
3
$44,730
7
$51,821
APPLICATIONS WITHDRAWN
2
$124,470
2
$46,530
12
$110,203
1
$5,930
0
$0
2
$15,380
FILES CLOSED FOR INCOMPLETENESS
0
$0
1
$49,440
2
$88,425
1
$17,050
0
$0
1
$57,220
Aggregated Statistics For Year 2008 (Based on 4 partial tracts)
A) FHA, FSA/RHS & VA Home Purchase Loans
B) Conventional Home Purchase Loans
C) Refinancings
D) Home Improvement Loans
F) Non-occupant Loans on < 5 Family Dwellings (A B C & D)
G) Loans On Manufactured Home Dwelling (A B C & D)
Number
Average Value
Number
Average Value
Number
Average Value
Number
Average Value
Number
Average Value
Number
Average Value
LOANS ORIGINATED
7
$102,206
21
$92,002
28
$79,965
15
$31,134
2
$85,000
13
$53,208
APPLICATIONS APPROVED, NOT ACCEPTED
1
$173,660
5
$84,900
7
$105,683
2
$17,605
0
$0
5
$72,150
APPLICATIONS DENIED
1
$167,410
9
$76,982
30
$82,389
21
$26,400
1
$94,870
11
$53,869
APPLICATIONS WITHDRAWN
1
$40,790
1
$124,190
10
$87,431
6
$37,005
1
$71,040
2
$78,285
FILES CLOSED FOR INCOMPLETENESS
0
$0
1
$91,540
1
$66,340
1
$11,120
0
$0
1
$15,570
Aggregated Statistics For Year 2007 (Based on 4 partial tracts)
A) FHA, FSA/RHS & VA Home Purchase Loans
B) Conventional Home Purchase Loans
C) Refinancings
D) Home Improvement Loans
F) Non-occupant Loans on < 5 Family Dwellings (A B C & D)
G) Loans On Manufactured Home Dwelling (A B C & D)
Number
Average Value
Number
Average Value
Number
Average Value
Number
Average Value
Number
Average Value
Number
Average Value
LOANS ORIGINATED
6
$103,118
33
$95,225
36
$77,315
22
$27,812
3
$83,407
15
$57,201
APPLICATIONS APPROVED, NOT ACCEPTED
0
$0
4
$70,265
5
$79,502
1
$46,330
1
$92,700
2
$89,015
APPLICATIONS DENIED
0
$0
12
$65,332
33
$89,710
15
$20,559
0
$0
10
$52,060
APPLICATIONS WITHDRAWN
1
$123,600
2
$105,075
15
$84,148
4
$19,890
0
$0
2
$91,820
FILES CLOSED FOR INCOMPLETENESS
0
$0
1
$42,620
0
$0
0
$0
0
$0
0
$0
Aggregated Statistics For Year 2006 (Based on 4 partial tracts)
A) FHA, FSA/RHS & VA Home Purchase Loans
B) Conventional Home Purchase Loans
C) Refinancings
D) Home Improvement Loans
F) Non-occupant Loans on < 5 Family Dwellings (A B C & D)
G) Loans On Manufactured Home Dwelling (A B C & D)
Number
Average Value
Number
Average Value
Number
Average Value
Number
Average Value
Number
Average Value
Number
Average Value
LOANS ORIGINATED
4
$82,495
35
$80,530
40
$75,933
24
$26,516
6
$76,902
14
$46,155
APPLICATIONS APPROVED, NOT ACCEPTED
1
$176,560
8
$61,262
9
$127,023
2
$37,185
2
$55,615
5
$53,184
APPLICATIONS DENIED
1
$121,730
14
$86,955
39
$99,527
19
$22,433
2
$40,405
11
$63,954
APPLICATIONS WITHDRAWN
2
$57,030
4
$83,822
31
$92,778
4
$50,965
1
$82,270
1
$59,300
FILES CLOSED FOR INCOMPLETENESS
0
$0
1
$71,530
3
$100,957
0
$0
0
$0
0
$0
Aggregated Statistics For Year 2005 (Based on 4 partial tracts)
A) FHA, FSA/RHS & VA Home Purchase Loans
B) Conventional Home Purchase Loans
C) Refinancings
D) Home Improvement Loans
F) Non-occupant Loans on < 5 Family Dwellings (A B C & D)
G) Loans On Manufactured Home Dwelling (A B C & D)
Number
Average Value
Number
Average Value
Number
Average Value
Number
Average Value
Number
Average Value
Number
Average Value
LOANS ORIGINATED
6
$87,235
28
$79,180
42
$62,290
19
$23,065
2
$73,750
12
$44,122
APPLICATIONS APPROVED, NOT ACCEPTED
1
$116,740
8
$52,189
12
$71,810
2
$36,940
0
$0
8
$55,141
APPLICATIONS DENIED
0
$0
10
$69,454
51
$84,996
17
$24,124
3
$28,250
15
$54,316
APPLICATIONS WITHDRAWN
2
$71,540
4
$66,258
33
$88,328
4
$251,398
2
$54,310
3
$79,113
FILES CLOSED FOR INCOMPLETENESS
0
$0
1
$151,200
11
$89,100
1
$27,800
0
$0
0
$0
Aggregated Statistics For Year 2004 (Based on 4 partial tracts)
A) FHA, FSA/RHS & VA Home Purchase Loans
B) Conventional Home Purchase Loans
C) Refinancings
D) Home Improvement Loans
F) Non-occupant Loans on < 5 Family Dwellings (A B C & D)
G) Loans On Manufactured Home Dwelling (A B C & D)
Number
Average Value
Number
Average Value
Number
Average Value
Number
Average Value
Number
Average Value
Number
Average Value
LOANS ORIGINATED
6
$91,177
27
$79,458
45
$67,214
18
$23,332
4
$76,020
13
$48,770
APPLICATIONS APPROVED, NOT ACCEPTED
0
$0
2
$20,385
11
$62,572
2
$12,975
1
$31,870
3
$37,430
APPLICATIONS DENIED
1
$92,080
12
$95,942
57
$69,364
15
$25,387
3
$209,073
20
$52,304
APPLICATIONS WITHDRAWN
0
$0
3
$81,047
29
$81,653
3
$39,743
1
$88,570
3
$78,127
FILES CLOSED FOR INCOMPLETENESS
0
$0
0
$0
8
$80,999
2
$21,010
0
$0
1
$15,450
Aggregated Statistics For Year 2003 (Based on 4 partial tracts)
A) FHA, FSA/RHS & VA Home Purchase Loans
B) Conventional Home Purchase Loans
C) Refinancings
D) Home Improvement Loans
F) Non-occupant Loans on < 5 Family Dwellings (A B C & D)
Number
Average Value
Number
Average Value
Number
Average Value
Number
Average Value
Number
Average Value
LOANS ORIGINATED
6
$70,595
24
$77,613
66
$65,986
15
$15,560
1
$58,180
APPLICATIONS APPROVED, NOT ACCEPTED
1
$79,680
3
$47,543
8
$78,394
3
$22,320
0
$0
APPLICATIONS DENIED
2
$57,960
6
$60,118
50
$60,955
6
$17,892
1
$63,370
APPLICATIONS WITHDRAWN
1
$39,550
3
$67,820
21
$65,381
1
$3,580
1
$54,110
FILES CLOSED FOR INCOMPLETENESS
0
$0
1
$81,900
3
$96,707
0
$0
0
$0
Aggregated Statistics For Year 2002 (Based on 2 partial tracts)
A) FHA, FSA/RHS & VA Home Purchase Loans
B) Conventional Home Purchase Loans
C) Refinancings
D) Home Improvement Loans
F) Non-occupant Loans on < 5 Family Dwellings (A B C & D)
Number
Average Value
Number
Average Value
Number
Average Value
Number
Average Value
Number
Average Value
LOANS ORIGINATED
1
$84,050
5
$68,474
12
$67,722
6
$12,978
1
$4,330
APPLICATIONS APPROVED, NOT ACCEPTED
0
$0
1
$43,260
2
$82,195
1
$10,510
1
$43,260
APPLICATIONS DENIED
1
$40,170
1
$71,070
14
$60,123
6
$9,373
1
$15,450
APPLICATIONS WITHDRAWN
0
$0
1
$108,150
5
$59,452
1
$16,070
0
$0
FILES CLOSED FOR INCOMPLETENESS
0
$0
0
$0
1
$58,710
0
$0
0
$0
Aggregated Statistics For Year 2001 (Based on 2 partial tracts)
A) FHA, FSA/RHS & VA Home Purchase Loans
B) Conventional Home Purchase Loans
C) Refinancings
D) Home Improvement Loans
F) Non-occupant Loans on < 5 Family Dwellings (A B C & D)
Number
Average Value
Number
Average Value
Number
Average Value
Number
Average Value
Number
Average Value
LOANS ORIGINATED
1
$74,780
10
$48,884
16
$60,641
4
$11,278
1
$51,910
APPLICATIONS APPROVED, NOT ACCEPTED
1
$24,100
4
$28,892
2
$37,390
1
$8,650
0
$0
APPLICATIONS DENIED
1
$83,430
7
$53,413
12
$43,002
7
$19,246
1
$30,900
APPLICATIONS WITHDRAWN
0
$0
0
$0
7
$49,263
0
$0
0
$0
FILES CLOSED FOR INCOMPLETENESS
0
$0
0
$0
1
$69,220
0
$0
0
$0
Aggregated Statistics For Year 2000 (Based on 2 partial tracts)
A) FHA, FSA/RHS & VA Home Purchase Loans
B) Conventional Home Purchase Loans
C) Refinancings
D) Home Improvement Loans
F) Non-occupant Loans on < 5 Family Dwellings (A B C & D)
Number
Average Value
Number
Average Value
Number
Average Value
Number
Average Value
Number
Average Value
LOANS ORIGINATED
4
$66,125
8
$53,844
5
$51,418
3
$9,270
0
$0
APPLICATIONS APPROVED, NOT ACCEPTED
0
$0
4
$62,882
2
$56,855
1
$11,740
0
$0
APPLICATIONS DENIED
1
$56,240
20
$49,254
11
$46,518
4
$12,360
2
$38,625
APPLICATIONS WITHDRAWN
0
$0
1
$41,410
1
$27,810
0
$0
0
$0
FILES CLOSED FOR INCOMPLETENESS
0
$0
0
$0
1
$50,680
0
$0
0
$0
Aggregated Statistics For Year 1999 (Based on 2 partial tracts)
A) FHA, FSA/RHS & VA Home Purchase Loans
B) Conventional Home Purchase Loans
C) Refinancings
D) Home Improvement Loans
F) Non-occupant Loans on < 5 Family Dwellings (A B C & D)
Detailed PMIC statistics for the following Tracts:0119.03
, 0201.00
2002 - 2018 National Fire Incident Reporting System (NFIRS) incidents
Based on the data from the years 2002 - 2018 the average number of fires per year is 6. The highest number of fires - 17 took place in 2006, and the least - 1 in 2002. The data has a constant trend.
When looking into fire subcategories, the most incidents belonged to: Structure Fires (49.5%), and Outside Fires (38.1%).
Fire incident types reported to NFIRS in Zip Code 13835


 Nearest zip codes: 13784, 13736, 13053, 13803, 13797, 13811.


 Based on the data from the years 2002 - 2018 the average number of fires per year is 6. The highest number of fires - 17 took place in 2006, and the least - 1 in 2002. The data has a constant trend.
 When looking into fire subcategories, the most incidents belonged to: Structure Fires (49.5%), and Outside Fires (38.1%).