Estimated zip code population in 2022: 1,916 Zip code population in 2010: 2,489 Zip code population in 2000: 2,427
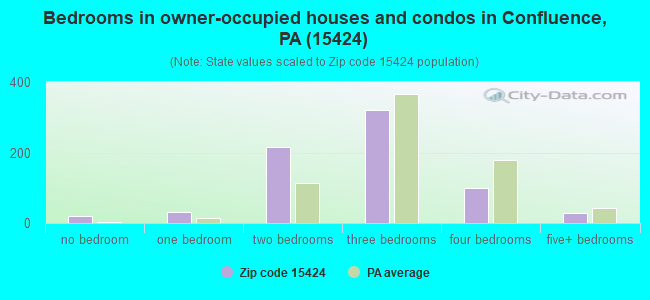
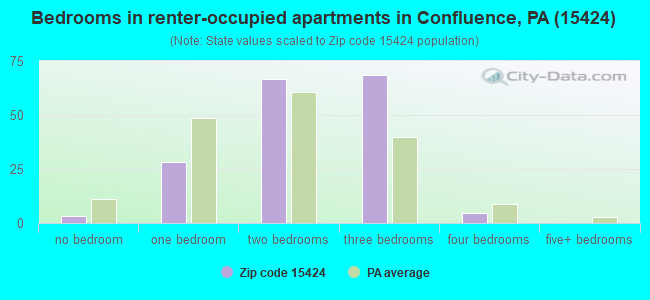
Houses and condos: 1,632 Renter-occupied apartments: 173
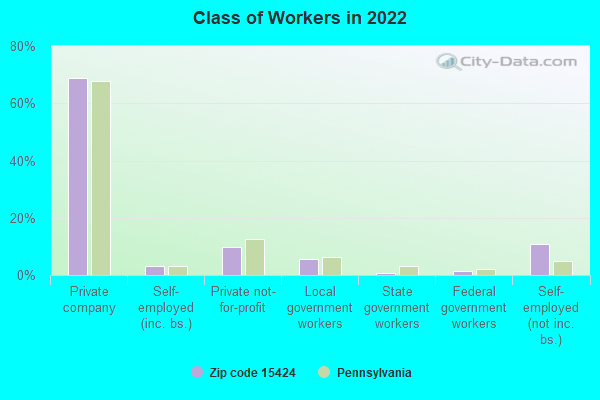
% of renters here:
20%
State:
31%
March 2022 cost of living index in zip code 15424: 91.5 (less than average, U.S. average is 100)
Land area: 72.5 sq. mi. Water area: 1.9 sq. mi.
Population density: 26 people per square mile
(very low).
OSM Map
General Map
Google Map
MSN Map
OSM Map
General Map
Google Map
MSN Map
OSM Map
General Map
Google Map
MSN Map
OSM Map
General Map
Google Map
MSN Map
Please wait while loading the map...
Real estate property taxes paid for housing units in 2022:
This zip code:
0.9% ($1,163)
Pennsylvania:
1.3% ($3,094)
Median real estate property taxes paid for housing units with mortgages in 2022: $1,300 (0.9%) Median real estate property taxes paid for housing units with no mortgage in 2022: $1,006 (0.8%)
Business Search- 14 Million verified businesses
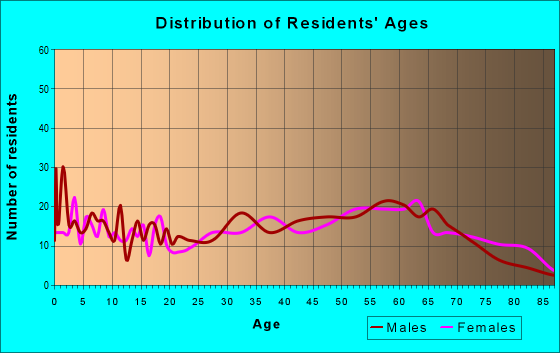
Males: 961
(50.2%)
Females: 955
(49.8%)
For population 25 years and over in 15424:
High school or higher: 90.0%
Bachelor's degree or higher: 13.4%
Graduate or professional degree: 4.8%
Unemployed: 12.0%
Mean travel time to work (commute): 35.8 minutes
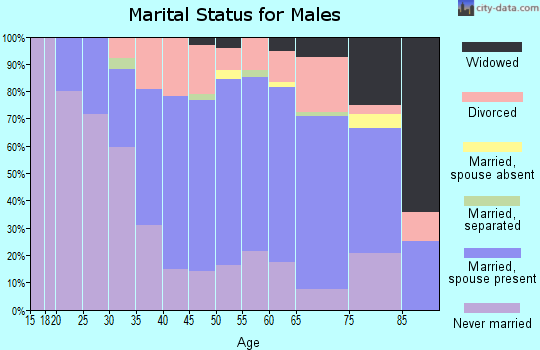
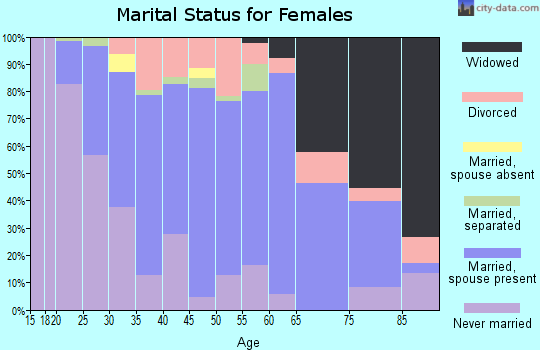
For population 15 years and over in 15424:
Never married: 27.7%
Now married: 49.2%
Separated: 2.5%
Widowed: 7.7%
Divorced: 12.8%
Zip code 15424 compared to state average:
Median household income below state average.
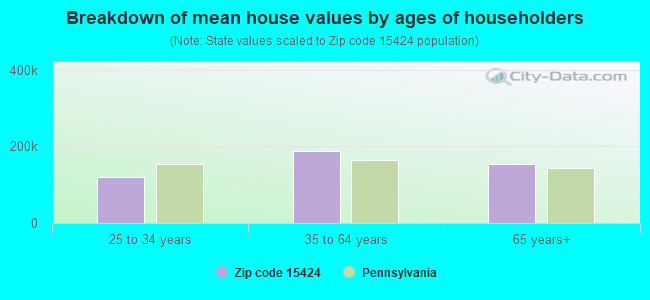
Median house value below state average.
Unemployed percentage above state average.
Black race population percentage significantly below state average.
Hispanic race population percentage below state average.
Median age significantly above state average.
Foreign-born population percentage significantly below state average.
Renting percentage below state average.
Length of stay since moving in significantly above state average.
Number of college students below state average.
Percentage of population with a bachelor's degree or higher significantly below state average.
Averages for the 2020 tax year for zip code 15424, filed in 2021:
Average Adjusted Gross Income (AGI) in 2020: $46,183 (Individual Income Tax Returns)
Here:
$46,183
State:
$75,707
Salary/wage: $35,565 (reported on 81.2% of returns)
Here:
$35,565
State:
$62,806
(% of AGI for various income ranges: 952.4% for AGIs below $25k, 3120.0% for AGIs $25k-50k, 5340.0% for AGIs $50k-75k, 8444.3% for AGIs $75k-100k, 16682.0% for AGIs $100k-200k)
Taxable interest for individuals: $750 (reported on 28.6% of returns)
This zip code:
$750
Pennsylvania:
$1,633
(% of AGI for various income ranges: 16.2% for AGIs below $25k, 18.2% for AGIs $25k-50k, 50.0% for AGIs $50k-75k, 50.0% for AGIs $75k-100k, 70.0% for AGIs $100k-200k)
Ordinary dividends: $2,167 (reported on 13.4% of returns)
Here:
$2,167
State:
$7,382
(% of AGI for various income ranges: 6.5% for AGIs below $25k, 30.9% for AGIs $25k-50k, 46.7% for AGIs $50k-75k, 82.9% for AGIs $75k-100k, 214.0% for AGIs $100k-200k)
Net capital gain/loss in AGI: +$5,869 (reported on 11.6% of returns)
Here:
+$5,869
State:
+$23,522
(% of AGI for various income ranges: 26.4% for AGIs $25k-50k, 119.3% for AGIs $50k-75k, 1068.0% for AGIs $100k-200k)
Profit/loss from business: +$8,767 (reported on 10.7% of returns)
Here:
+$8,767
State:
+$16,274
(% of AGI for various income ranges: 52.1% for AGIs below $25k, 74.5% for AGIs $25k-50k, 181.3% for AGIs $50k-75k, 627.1% for AGIs $75k-100k)
Taxable individual retirement arrangement distribution: $11,364 (reported on 9.8% of returns)
15424:
$11,364
Pennsylvania:
$18,583
(% of AGI for various income ranges: 44.1% for AGIs below $25k, 107.7% for AGIs $25k-50k, 237.3% for AGIs $50k-75k, 724.3% for AGIs $75k-100k)
Earned income credit: $1,941 (reported on 15.2% of returns)
Here:
$1,941
State:
$2,100
(% of AGI for various income ranges: 61.2% for AGIs below $25k, 55.5% for AGIs $25k-50k)
Percentage of individuals using paid preparers for their 2020 taxes: 95.5%
Here:
96%
State:
92%
(% for various income ranges: 93.3% for AGIs below $25k, 96.4% for AGIs $25k-50k, 95.0% for AGIs $50k-75k, 100.0% for AGIs $75k-100k, 100.0% for AGIs $100k-200k)
Averages for the 2012 tax year for zip code 15424, filed in 2013:
Average Adjusted Gross Income (AGI) in 2012: $36,176 (Individual Income Tax Returns)
Here:
$36,176
State:
$61,346
Salary/wage: $31,593 (reported on 80.7% of returns)
Here:
$31,593
State:
$51,902
(% of AGI for various income ranges: 70.6% for AGIs below $25k, 68.6% for AGIs $25k-50k, 72.3% for AGIs $50k-75k, 76.3% for AGIs $75k-100k, 65.3% for AGIs $100k-200k)
Taxable interest for individuals: $694 (reported on 29.4% of returns)
This zip code:
$694
Pennsylvania:
$1,588
(% of AGI for various income ranges: 1.4% for AGIs below $25k, 0.6% for AGIs $25k-50k, 0.4% for AGIs $50k-75k, 0.5% for AGIs $75k-100k)
Ordinary dividends: $1,120 (reported on 13.8% of returns)
Here:
$1,120
State:
$5,827
(% of AGI for various income ranges: 0.9% for AGIs below $25k, 0.5% for AGIs $25k-50k, 0.3% for AGIs $50k-75k, 0.4% for AGIs $75k-100k)
Net capital gain/loss in AGI: +$333 (reported on 8.3% of returns)
Here:
+$333
State:
+$14,495
(% of AGI for various income ranges: 0.2% for AGIs $50k-75k)
Profit/loss from business: +$6,514 (reported on 12.8% of returns)
Here:
+$6,514
State:
+$16,268
(% of AGI for various income ranges: 3.3% for AGIs below $25k, 2.5% for AGIs $25k-50k, 3.8% for AGIs $50k-75k, 0.5% for AGIs $75k-100k)
Taxable individual retirement arrangement distribution: $10,117 (reported on 11.0% of returns)
15424:
$10,117
Pennsylvania:
$14,550
(% of AGI for various income ranges: 2.5% for AGIs below $25k, 3.0% for AGIs $25k-50k, 1.9% for AGIs $50k-75k, 9.9% for AGIs $75k-100k)
Total itemized deductions: $17,985 (25% of AGI, reported on 11.9% of returns)
Here:
$17,985
State:
$23,538
Here:
25.0% of AGI
State:
18.4% of AGI
(% of AGI for various income ranges: 5.6% for AGIs $25k-50k, 6.3% for AGIs $50k-75k, 7.2% for AGIs $75k-100k, 10.8% for AGIs $100k-200k)
Charity contributions: $2,122 (reported on 8.3% of returns)
Here:
$2,122
State:
$4,025
(% of AGI for various income ranges: 0.9% for AGIs below $25k, 0.6% for AGIs $50k-75k, 1.0% for AGIs $100k-200k)
Taxes paid: $4,692 (reported on 11.9% of returns)
15424:
$4,692
State:
$9,982
(% of AGI for various income ranges: 1.1% for AGIs $25k-50k, 1.5% for AGIs $50k-75k, 2.2% for AGIs $75k-100k, 3.4% for AGIs $100k-200k)
Earned income credit: $2,200 (reported on 22.9% of returns)
Here:
$2,200
State:
$2,106
(% of AGI for various income ranges: 6.8% for AGIs below $25k, 1.0% for AGIs $25k-50k)
Percentage of individuals using paid preparers for their 2012 taxes: 56.9%
Here:
57%
State:
53%
(% for various income ranges: 54.7% for AGIs below $25k, 55.6% for AGIs $25k-50k, 61.1% for AGIs $50k-75k, 66.7% for AGIs $75k-100k, 60.0% for AGIs $100k-200k)
Averages for the 2004 tax year for zip code 15424, filed in 2005:
Average Adjusted Gross Income (AGI) in 2004: $29,700 (Individual Income Tax Returns)
Here:
$29,700
State:
$48,049
Salary/wage: $26,563 (reported on 82.9% of returns)
Here:
$26,563
State:
$42,646
(% of AGI for various income ranges: 81.9% for AGIs below $10k, 69.1% for AGIs $10k-25k, 78.6% for AGIs $25k-50k, 81.5% for AGIs $50k-75k, 75.9% for AGIs $75k-100k, 50.1% for AGIs over 100k)
Taxable interest for individuals: $1,084 (reported on 39.7% of returns)
This zip code:
$1,084
Pennsylvania:
$1,657
(% of AGI for various income ranges: 6.2% for AGIs below $10k, 3.1% for AGIs $10k-25k, 1.3% for AGIs $25k-50k, 0.4% for AGIs $50k-75k, 0.5% for AGIs $75k-100k, 0.7% for AGIs over 100k)
Taxable dividends: $1,395 (reported on 16.9% of returns)
Here:
$1,395
State:
$3,566
(% of AGI for various income ranges: 2.1% for AGIs below $10k, 1.4% for AGIs $10k-25k, 0.9% for AGIs $25k-50k, 0.2% for AGIs $50k-75k, 1.2% for AGIs over 100k)
Net capital gain/loss: +$1,202 (reported on 11.7% of returns)
Here:
+$1,202
State:
+$9,716
(% of AGI for various income ranges: -1.5% for AGIs below $10k, 1.2% for AGIs $10k-25k, 0.1% for AGIs $25k-50k, 1.2% for AGIs $50k-75k, -0.2% for AGIs over 100k)
Profit/loss from business: +$8,732 (reported on 12.1% of returns)
Here:
+$8,732
State:
+$14,267
(% of AGI for various income ranges: 11.4% for AGIs below $10k, 4.1% for AGIs $10k-25k, 2.6% for AGIs $25k-50k, -0.5% for AGIs $50k-75k, 14.2% for AGIs over 100k)
IRA payment deduction: $2,500 (reported on 2.9% of returns)
15424:
$2,500
Pennsylvania:
$2,903
Total itemized deductions: $15,852 (27% of AGI, reported on 14.6% of returns)
Here:
$15,852
State:
$18,804
Here:
26.7% of AGI
State:
19.5% of AGI
(% of AGI for various income ranges: 2.5% for AGIs $10k-25k, 7.2% for AGIs $25k-50k, 9.8% for AGIs $50k-75k, 10.3% for AGIs $75k-100k, 13.7% for AGIs over 100k)
Charity contributions deductions: $1,821 (3% of AGI, reported on 11.0% of returns)
Here:
$1,821
State:
$3,337
Here:
2.9% of AGI
State:
3.3% of AGI
(% of AGI for various income ranges: 1.6% for AGIs below $10k, 0.5% for AGIs $25k-50k, 1.2% for AGIs $50k-75k, 1.1% for AGIs $75k-100k, 0.6% for AGIs over 100k)
Total tax: $3,382 (reported on 67.9% of returns)
15424:
$3,382
State:
$8,008
(% of AGI for various income ranges: 2.7% for AGIs below $10k, 3.9% for AGIs $10k-25k, 6.1% for AGIs $25k-50k, 8.2% for AGIs $50k-75k, 11.1% for AGIs $75k-100k, 16.5% for AGIs over 100k)
Earned income credit: $1,611 (reported on 20.4% of returns)
Here:
$1,611
State:
$1,643
Percentage of individuals using paid preparers for their 2004 taxes: 51.2%
Here:
51%
State:
56%
(% for various income ranges: 42.7% for AGIs below $10k, 51.6% for AGIs $10k-25k, 55.0% for AGIs $25k-50k, 55.3% for AGIs $50k-75k, 60.7% for AGIs $75k-100k, 56.5% for AGIs over 100k)
Household received Food Stamps/SNAP in the past 12 months: 174 Household did not receive Food Stamps/SNAP in the past 12 months: 715
Women who had a birth in the past 12 months: 13 (7 now married, 5 unmarried) Women who did not have a birth in the past 12 months: 329 (116 now married, 212 unmarried)
Housing units in zip code 15424 with a mortgage: 276 (18 second mortgage, 12 both second mortgage and home equity loan) Houses without a mortgage: 35
Median monthly owner costs for units with a mortgage: $1,068 Median monthly owner costs for units without a mortgage: $461
Residents with income below the poverty level in 2022:
This zip code:
16.3%
Whole state:
11.8%
Residents with income below 50% of the poverty level in 2022:
This zip code:
8.1%
Whole state:
6.1%
Median number of rooms in houses and condos:
Here:
5.9
State:
6.8
Median number of rooms in apartments:
Here:
5.0
State:
4.3
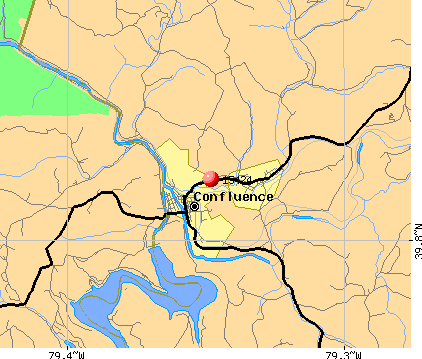
Notable locations in this zip code not listed on our city pages
Notable locations in zip code 15424: Bidwell Station (A), Confluence Oakland Junction Station (B), Ursina Junction Station (C), Lincoln Siding Station (D), Confluence Volunteer Fire Company (E). Display/hide their locations on the map
Churches in zip code 15424 include: Grace Church (A), Coffin Rock Church (B), Bethel Church (C), Johnson Chapel (D), Jersey Church (E), Fairoaks Church (F), Sillbaugh Church (G), Sugarloaf Chapel (H). Display/hide their locations on the map
Streams, rivers, and creeks: Casselman River (A), Tub Run (B), Licking Run (C), Laurel Hill Creek (D), Little Glade Run (E), Hen Run (F), Hall Run (G), Drake Run (H), Laurel Run (I). Display/hide their locations on the map
In group quarters: 59 (-1 institutionalized population)
Size of family households: 302 2-persons, 125 3-persons, 55 4-persons, 34 5-persons, 1 6-persons
Size of nonfamily households: 310 1-person, 55 2-persons, 4 3-persons
103 married couples with children.
86 single-parent households (15 men, 71 women).
97.5% of residents of 15424 zip code speak English at home.
2.3% of residents speak Spanish at home (95% very well, 5% well).
0.1% of residents speak other Indo-European language at home (100% very well).
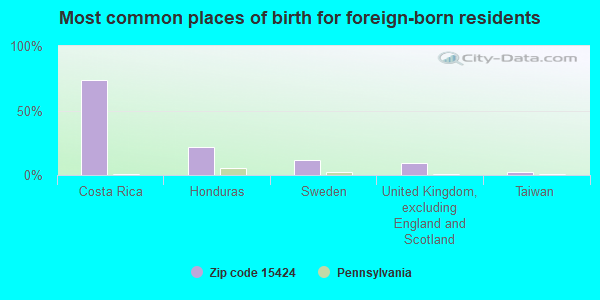
Foreign born population: 42 (2.2%) (30.1% of them are naturalized citizens)
This zip code:
2.2%
Whole state:
7.5%
74%Costa Rica
21%Honduras
12%Sweden
10%United Kingdom, excluding England and Scotland
2%Taiwan
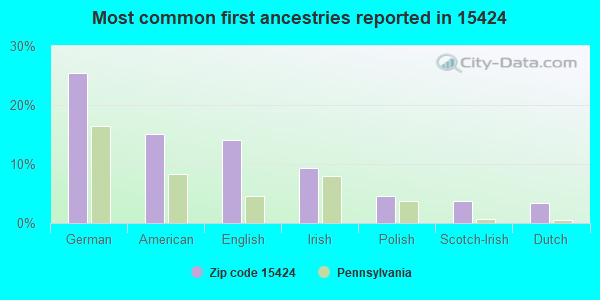
25%German
15%American
14%English
9%Irish
5%Polish
4%Scotch-Irish
3%Dutch
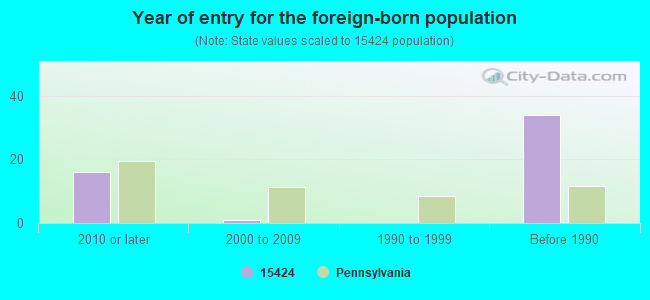
Year of entry for the foreign-born population
162010 or later
12000 to 2009
01990 to 1999
34Before 1990
Housing units lacking complete plumbing facilities: 8.2% Housing units lacking complete kitchen facilities: 5.2%
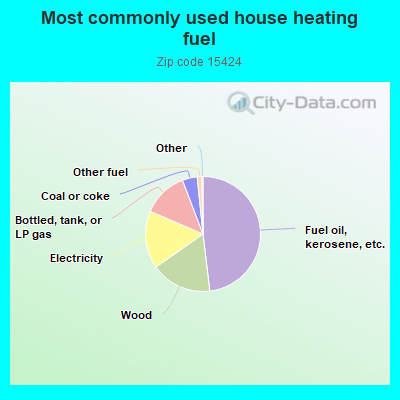
48.3%Fuel oil, kerosene, etc.
17.2%Wood
16.3%Electricity
12.8%Bottled, tank, or LP gas
4.2%Coal or coke
1.3%Other fuel
Population in 1990: 1,998. Population change in the 1990s: +429 (+21.5%).
Place of birth for U.S.-born residents:
This state: 1,522
Northeast: 37
Midwest: 23
South: 229
West: 41
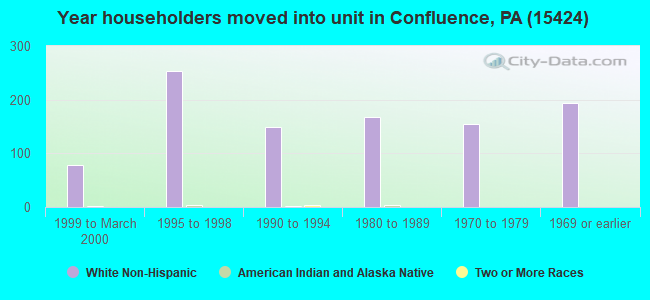
72% of the 15424 zip code residents lived in the same house 5 years ago. Out of people who lived in different houses, 59% lived in this county. Out of people who lived in different counties, 50% lived in Pennsylvania.
93% of the 15424 zip code residents lived in the same house 1 year ago. Out of people who lived in different houses, 32% moved from this county. Out of people who lived in different houses, 36% moved from different county within same state. Out of people who lived in different houses, 4% moved from different state. Out of people who lived in different houses, 30% moved from abroad.
Private vs. public school enrollment:
Students in private schools in grades 1 to 8 (elementary and middle school): 26
Here:
18.0%
Pennsylvania:
15.7%
Students in private schools in grades 9 to 12 (high school): 5
Here:
8.0%
Pennsylvania:
13.4%
Students in private undergraduate colleges: 8
Here:
24.1%
Pennsylvania:
39.8%
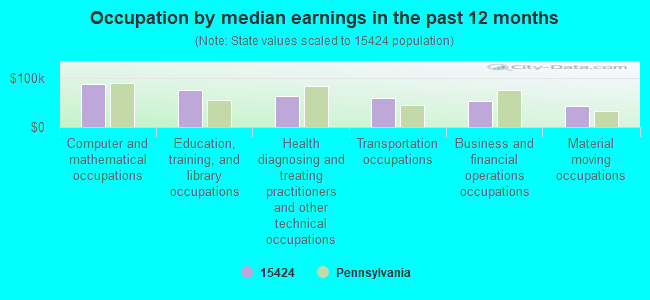
Occupation by median earnings in the past 12 months ($)
87,394Computer and mathematical occupations
74,517Education, training, and library occupations
62,683Health diagnosing and treating practitioners and other technical occupations
58,758Transportation occupations
53,767Business and financial operations occupations
43,650Material moving occupations
Top industries in this zip code by the number of employees in 2005:
Administrative and Support and Waste Management and Remediation Services: Landscaping Services (20-49 employees: 1 establishment)
Accommodation and Food Services: Full-Service Restaurants (10-19: 1, 1-4: 1)
Administrative and Support and Waste Management and Remediation Services: Janitorial Services (10-19: 1, 1-4: 1)
Health Care and Social Assistance: Offices of Physicians (except Mental Health Specialists) (5-9: 2)
Finance and Insurance: Commercial Banking (5-9: 1, 1-4: 1)
People in group quarters in 2010:
53 people in group homes intended for adults
13 people in nursing facilities/skilled-nursing facilities
11 people in workers' group living quarters and job corps centers
People in group quarters in 2000:
35 people in other noninstitutional group quarters
28 people in other nonhousehold living situations
27 people in nursing homes
Fatal accident statistics in 2014:
Fatal accident count: 1
Vehicles involved in fatal accidents: 1
Fatal accidents caused by drunken drivers: 1
Fatalities: 1
Persons involved in fatal accidents: 1
Pedestrians involved in fatal accidents: 0
Fatal accident statistics in 2013:
Fatal accident count: 2
Vehicles involved in fatal accidents: 2
Fatal accidents caused by drunken drivers: 1
Fatalities: 2
Persons involved in fatal accidents: 5
Pedestrians involved in fatal accidents: 0
Home Mortgage Disclosure Act Aggregated Statistics For Year 2009 (Based on 2 partial tracts)
A) FHA, FSA/RHS & VA Home Purchase Loans
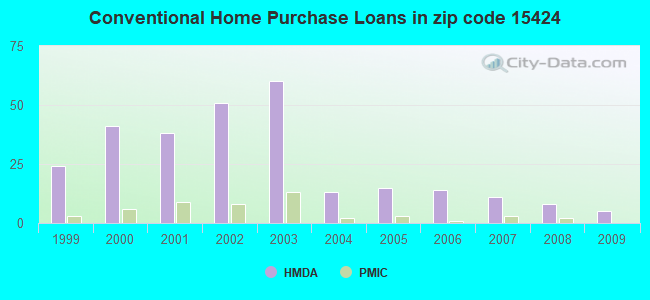
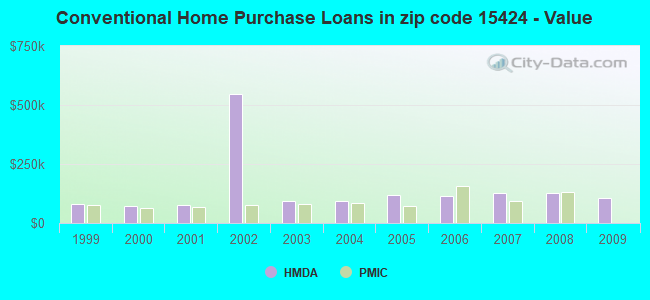
B) Conventional Home Purchase Loans
C) Refinancings
D) Home Improvement Loans
F) Non-occupant Loans on < 5 Family Dwellings (A B C & D)
G) Loans On Manufactured Home Dwelling (A B C & D)
Number
Average Value
Number
Average Value
Number
Average Value
Number
Average Value
Number
Average Value
Number
Average Value
LOANS ORIGINATED
2
$94,870
5
$105,338
21
$121,300
5
$53,218
3
$123,443
3
$52,120
APPLICATIONS APPROVED, NOT ACCEPTED
0
$0
0
$0
1
$106,980
1
$48,010
0
$0
0
$0
APPLICATIONS DENIED
0
$0
1
$85,720
11
$143,852
4
$23,145
2
$118,870
2
$64,350
APPLICATIONS WITHDRAWN
0
$0
0
$0
5
$142,418
0
$0
0
$0
0
$0
FILES CLOSED FOR INCOMPLETENESS
0
$0
0
$0
1
$86,410
0
$0
0
$0
0
$0
Aggregated Statistics For Year 2008 (Based on 2 partial tracts)
A) FHA, FSA/RHS & VA Home Purchase Loans
B) Conventional Home Purchase Loans
C) Refinancings
D) Home Improvement Loans
F) Non-occupant Loans on < 5 Family Dwellings (A B C & D)
G) Loans On Manufactured Home Dwelling (A B C & D)
Number
Average Value
Number
Average Value
Number
Average Value
Number
Average Value
Number
Average Value
Number
Average Value
LOANS ORIGINATED
1
$146,530
8
$126,444
17
$107,455
8
$44,405
3
$134,797
4
$63,322
APPLICATIONS APPROVED, NOT ACCEPTED
0
$0
1
$146,760
2
$95,670
0
$0
0
$0
1
$37,030
APPLICATIONS DENIED
0
$0
2
$96,810
15
$110,703
7
$53,199
1
$99,670
4
$80,352
APPLICATIONS WITHDRAWN
0
$0
1
$43,430
5
$135,468
0
$0
1
$37,720
0
$0
FILES CLOSED FOR INCOMPLETENESS
0
$0
0
$0
1
$143,330
0
$0
0
$0
0
$0
Aggregated Statistics For Year 2007 (Based on 2 partial tracts)
A) FHA, FSA/RHS & VA Home Purchase Loans
B) Conventional Home Purchase Loans
C) Refinancings
D) Home Improvement Loans
F) Non-occupant Loans on < 5 Family Dwellings (A B C & D)
G) Loans On Manufactured Home Dwelling (A B C & D)
Number
Average Value
Number
Average Value
Number
Average Value
Number
Average Value
Number
Average Value
Number
Average Value
LOANS ORIGINATED
2
$94,300
11
$125,917
16
$112,642
9
$48,234
5
$119,192
6
$62,942
APPLICATIONS APPROVED, NOT ACCEPTED
0
$0
2
$114,645
5
$89,748
1
$23,770
1
$49,610
1
$58,290
APPLICATIONS DENIED
0
$0
4
$76,068
22
$106,580
8
$63,665
2
$94,525
5
$101,544
APPLICATIONS WITHDRAWN
0
$0
2
$93,155
5
$113,478
2
$47,090
1
$120,930
0
$0
FILES CLOSED FOR INCOMPLETENESS
0
$0
0
$0
1
$223,340
0
$0
0
$0
0
$0
Aggregated Statistics For Year 2006 (Based on 2 partial tracts)
A) FHA, FSA/RHS & VA Home Purchase Loans
B) Conventional Home Purchase Loans
C) Refinancings
D) Home Improvement Loans
F) Non-occupant Loans on < 5 Family Dwellings (A B C & D)
G) Loans On Manufactured Home Dwelling (A B C & D)
Number
Average Value
Number
Average Value
Number
Average Value
Number
Average Value
Number
Average Value
Number
Average Value
LOANS ORIGINATED
1
$77,950
14
$116,161
21
$114,997
12
$34,309
7
$98,494
6
$63,780
APPLICATIONS APPROVED, NOT ACCEPTED
0
$0
4
$96,355
5
$153,664
1
$46,860
1
$229,290
1
$58,290
APPLICATIONS DENIED
0
$0
5
$86,366
24
$108,690
7
$61,264
1
$181,970
6
$76,162
APPLICATIONS WITHDRAWN
0
$0
2
$163,335
10
$168,981
1
$64,010
1
$89,840
0
$0
FILES CLOSED FOR INCOMPLETENESS
0
$0
0
$0
2
$119,785
0
$0
0
$0
0
$0
Aggregated Statistics For Year 2005 (Based on 2 partial tracts)
B) Conventional Home Purchase Loans
C) Refinancings
D) Home Improvement Loans
F) Non-occupant Loans on < 5 Family Dwellings (A B C & D)
G) Loans On Manufactured Home Dwelling (A B C & D)
Number
Average Value
Number
Average Value
Number
Average Value
Number
Average Value
Number
Average Value
LOANS ORIGINATED
15
$119,741
22
$92,448
11
$31,526
5
$117,180
5
$43,434
APPLICATIONS APPROVED, NOT ACCEPTED
2
$58,405
6
$99,783
2
$48,350
1
$72,470
2
$45,265
APPLICATIONS DENIED
4
$81,325
33
$85,302
11
$36,493
2
$119,670
10
$62,614
APPLICATIONS WITHDRAWN
2
$51,890
15
$114,605
1
$232,490
1
$88,240
3
$66,903
FILES CLOSED FOR INCOMPLETENESS
1
$60,810
3
$116,587
0
$0
1
$74,520
0
$0
Aggregated Statistics For Year 2004 (Based on 2 partial tracts)
A) FHA, FSA/RHS & VA Home Purchase Loans
B) Conventional Home Purchase Loans
C) Refinancings
D) Home Improvement Loans
F) Non-occupant Loans on < 5 Family Dwellings (A B C & D)
G) Loans On Manufactured Home Dwelling (A B C & D)
Number
Average Value
Number
Average Value
Number
Average Value
Number
Average Value
Number
Average Value
Number
Average Value
LOANS ORIGINATED
0
$0
13
$92,266
26
$78,375
13
$38,475
5
$63,002
3
$35,203
APPLICATIONS APPROVED, NOT ACCEPTED
0
$0
3
$124,360
9
$81,636
2
$31,890
1
$85,040
2
$65,495
APPLICATIONS DENIED
1
$81,380
6
$75,705
35
$79,749
5
$34,428
2
$84,470
8
$58,236
APPLICATIONS WITHDRAWN
0
$0
3
$103,633
18
$102,552
2
$21,145
1
$17,370
3
$80,010
FILES CLOSED FOR INCOMPLETENESS
0
$0
1
$91,210
5
$114,254
1
$29,720
0
$0
0
$0
Aggregated Statistics For Year 2003 (Based on 4 partial tracts)
A) FHA, FSA/RHS & VA Home Purchase Loans
B) Conventional Home Purchase Loans
C) Refinancings
D) Home Improvement Loans
F) Non-occupant Loans on < 5 Family Dwellings (A B C & D)
Number
Average Value
Number
Average Value
Number
Average Value
Number
Average Value
Number
Average Value
LOANS ORIGINATED
1
$122,170
60
$91,595
162
$80,931
36
$35,796
57
$105,669
APPLICATIONS APPROVED, NOT ACCEPTED
0
$0
5
$60,100
30
$82,000
6
$37,863
4
$71,058
APPLICATIONS DENIED
1
$25,910
13
$66,827
96
$78,152
23
$27,404
6
$80,602
APPLICATIONS WITHDRAWN
0
$0
7
$93,124
62
$85,040
1
$41,990
7
$101,886
FILES CLOSED FOR INCOMPLETENESS
0
$0
1
$180,680
5
$133,640
0
$0
2
$97,305
Aggregated Statistics For Year 2002 (Based on 4 partial tracts)
A) FHA, FSA/RHS & VA Home Purchase Loans
B) Conventional Home Purchase Loans
C) Refinancings
D) Home Improvement Loans
F) Non-occupant Loans on < 5 Family Dwellings (A B C & D)
Number
Average Value
Number
Average Value
Number
Average Value
Number
Average Value
Number
Average Value
LOANS ORIGINATED
2
$69,895
51
$545,627
102
$69,073
33
$29,870
28
$87,216
APPLICATIONS APPROVED, NOT ACCEPTED
0
$0
3
$39,670
23
$78,386
3
$38,840
4
$73,638
APPLICATIONS DENIED
1
$64,010
21
$43,142
92
$68,489
17
$23,430
3
$52,417
APPLICATIONS WITHDRAWN
1
$42,970
6
$78,273
52
$70,068
4
$20,102
2
$93,415
FILES CLOSED FOR INCOMPLETENESS
0
$0
1
$92,450
5
$82,778
0
$0
0
$0
Aggregated Statistics For Year 2001 (Based on 4 partial tracts)
A) FHA, FSA/RHS & VA Home Purchase Loans
B) Conventional Home Purchase Loans
C) Refinancings
D) Home Improvement Loans
E) Loans on Dwellings For 5+ Families
F) Non-occupant Loans on < 5 Family Dwellings (A B C & D)
Number
Average Value
Number
Average Value
Number
Average Value
Number
Average Value
Number
Average Value
Number
Average Value
LOANS ORIGINATED
6
$64,292
38
$78,186
97
$64,852
41
$19,584
1
$104,260
19
$90,343
APPLICATIONS APPROVED, NOT ACCEPTED
2
$63,165
9
$76,592
30
$68,950
4
$24,448
0
$0
4
$117,600
APPLICATIONS DENIED
0
$0
29
$49,535
92
$63,502
24
$20,670
1
$5,790
6
$66,688
APPLICATIONS WITHDRAWN
1
$26,640
4
$75,595
41
$66,678
5
$26,760
0
$0
2
$34,175
FILES CLOSED FOR INCOMPLETENESS
0
$0
1
$63,130
8
$69,046
0
$0
0
$0
0
$0
Aggregated Statistics For Year 2000 (Based on 4 partial tracts)
A) FHA, FSA/RHS & VA Home Purchase Loans
B) Conventional Home Purchase Loans
C) Refinancings
D) Home Improvement Loans
E) Loans on Dwellings For 5+ Families
F) Non-occupant Loans on < 5 Family Dwellings (A B C & D)
Number
Average Value
Number
Average Value
Number
Average Value
Number
Average Value
Number
Average Value
Number
Average Value
LOANS ORIGINATED
6
$63,582
41
$73,787
62
$53,657
41
$17,414
1
$28,960
20
$74,836
APPLICATIONS APPROVED, NOT ACCEPTED
1
$39,390
10
$53,896
17
$55,727
6
$14,848
0
$0
2
$45,770
APPLICATIONS DENIED
1
$16,220
17
$41,314
62
$54,876
19
$12,674
0
$0
4
$37,538
APPLICATIONS WITHDRAWN
0
$0
6
$75,270
22
$54,272
4
$27,762
0
$0
1
$13,240
FILES CLOSED FOR INCOMPLETENESS
0
$0
1
$41,120
6
$56,375
0
$0
0
$0
0
$0
Aggregated Statistics For Year 1999 (Based on 2 partial tracts)
A) FHA, FSA/RHS & VA Home Purchase Loans
B) Conventional Home Purchase Loans
C) Refinancings
D) Home Improvement Loans
F) Non-occupant Loans on < 5 Family Dwellings (A B C & D)
Detailed PMIC statistics for the following Tracts:0219.00
, 2627.00
2003 - 2018 National Fire Incident Reporting System (NFIRS) incidents
Based on the data from the years 2003 - 2018 the average number of fires per year is 10. The highest number of reported fire incidents - 23 took place in 2016, and the least - 2 in 2003. The data has an increasing trend.
When looking into fire subcategories, the most incidents belonged to: Structure Fires (70.8%), and Outside Fires (19.9%).
Fire incident types reported to NFIRS in Zip Code 15424
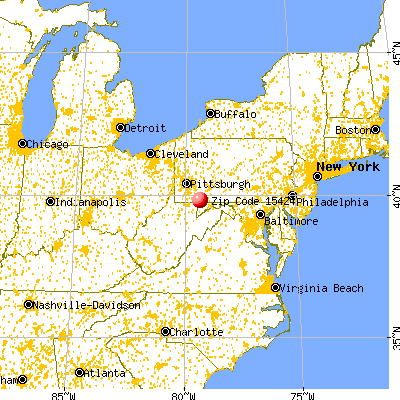


 Nearest zip codes: 15411, 15551, 15459, 15540, 15464, 15557.


 Based on the data from the years 2003 - 2018 the average number of fires per year is 10. The highest number of reported fire incidents - 23 took place in 2016, and the least - 2 in 2003. The data has an increasing trend.
 When looking into fire subcategories, the most incidents belonged to: Structure Fires (70.8%), and Outside Fires (19.9%).