Estimated zip code population in 2022: 549 Zip code population in 2010: 860 Zip code population in 2000: 875
Houses and condos: 323 Renter-occupied apartments: 40
% of renters here:
18%
State:
31%
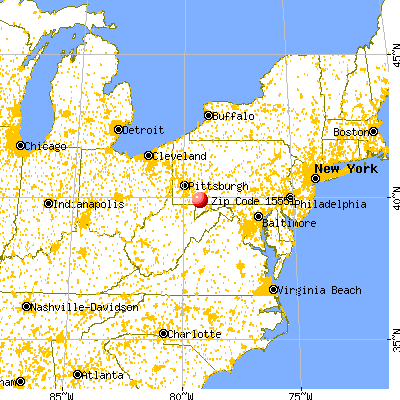
March 2022 cost of living index in zip code 15551: 91.3 (less than average, U.S. average is 100)
Land area: 35.9 sq. mi. Water area: 0.0 sq. mi.
Population density: 15 people per square mile
(very low).
OSM Map
General Map
Google Map
MSN Map
OSM Map
General Map
Google Map
MSN Map
OSM Map
General Map
Google Map
MSN Map
OSM Map
General Map
Google Map
MSN Map
Please wait while loading the map...
Real estate property taxes paid for housing units in 2022:
This zip code:
0.5% ($890)
Pennsylvania:
1.3% ($3,094)
Median real estate property taxes paid for housing units with mortgages in 2022: $993 (0.8%) Median real estate property taxes paid for housing units with no mortgage in 2022: $865 (0.4%)
Business Search- 14 Million verified businesses
Males: 295
(53.8%)
Females: 253
(46.2%)
For population 25 years and over in 15551:
High school or higher: 86.5%
Bachelor's degree or higher: 11.6%
Graduate or professional degree: 1.6%
Unemployed: 2.7%
Mean travel time to work (commute): 31.5 minutes
For population 15 years and over in 15551:
Never married: 17.9%
Now married: 70.7%
Separated: 0.4%
Widowed: 4.1%
Divorced: 6.9%
Zip code 15551 compared to state average:
Black race population percentage significantly below state average.
Hispanic race population percentage significantly below state average.
Median age significantly above state average.
Foreign-born population percentage significantly below state average.
Renting percentage below state average.
Length of stay since moving in significantly above state average.
Number of college students below state average.
Percentage of population with a bachelor's degree or higher significantly below state average.
Estimated median house/condo value in 2022: $175,605
15551:
$175,605
Pennsylvania:
$245,500
According to our research of Pennsylvania and other state lists, there was 1 registered sex offender living in 15551 zip code as of May 28, 2024. The ratio of all residents to sex offenders in zip code 15551 is 853 to 1. The ratio of registered sex offenders to all residents in this zip code is lower than the state average.
Median resident age:
This zip code:
52.3 years
Pennsylvania median age:
40.9 years
Average household size:
This zip code:
2.4 people
Pennsylvania:
2.4 people
Averages for the 2020 tax year for zip code 15551, filed in 2021:
Average Adjusted Gross Income (AGI) in 2020: $50,024 (Individual Income Tax Returns)
Here:
$50,024
State:
$75,707
Salary/wage: $46,964 (reported on 73.5% of returns)
Here:
$46,964
State:
$62,806
(% of AGI for various income ranges: 855.7% for AGIs below $25k, 3027.1% for AGIs $25k-50k, 5485.0% for AGIs $50k-75k, 7726.7% for AGIs $75k-100k, 15036.7% for AGIs $100k-200k)
Taxable interest for individuals: $642 (reported on 35.3% of returns)
This zip code:
$642
Pennsylvania:
$1,633
(% of AGI for various income ranges: 52.9% for AGIs below $25k, 22.9% for AGIs $25k-50k, 35.0% for AGIs $50k-75k, 33.3% for AGIs $100k-200k)
Ordinary dividends: $1,800 (reported on 14.7% of returns)
Here:
$1,800
State:
$7,382
(% of AGI for various income ranges: 28.6% for AGIs below $25k, 175.0% for AGIs $50k-75k)
Net capital gain/loss in AGI: +$660 (reported on 14.7% of returns)
Here:
+$660
State:
+$23,522
(% of AGI for various income ranges: 44.3% for AGIs below $25k, 5.0% for AGIs $50k-75k)
Profit/loss from business: +$3,283 (reported on 17.6% of returns)
Here:
+$3,283
State:
+$16,274
(% of AGI for various income ranges: 221.4% for AGIs below $25k, 105.0% for AGIs $50k-75k)
Taxable individual retirement arrangement distribution: $7,920 (reported on 14.7% of returns)
15551:
$7,920
Pennsylvania:
$18,583
(% of AGI for various income ranges: 565.7% for AGIs $25k-50k)
Earned income credit: $1,950 (reported on 11.8% of returns)
Here:
$1,950
State:
$2,100
(% of AGI for various income ranges: 111.4% for AGIs below $25k)
Percentage of individuals using paid preparers for their 2020 taxes: 94.1%
Here:
94%
State:
92%
(% for various income ranges: 90.9% for AGIs below $25k, 100.0% for AGIs $25k-50k, 83.3% for AGIs $50k-75k, 100.0% for AGIs $75k-100k, 100.0% for AGIs $100k-200k)
Averages for the 2012 tax year for zip code 15551, filed in 2013:
Average Adjusted Gross Income (AGI) in 2012: $44,985 (Individual Income Tax Returns)
Here:
$44,985
State:
$61,346
Salary/wage: $38,064 (reported on 84.8% of returns)
Here:
$38,064
State:
$51,902
(% of AGI for various income ranges: 68.1% for AGIs below $25k, 68.8% for AGIs $25k-50k, 75.5% for AGIs $50k-75k, 83.5% for AGIs $75k-100k, 63.1% for AGIs $100k-200k)
Taxable interest for individuals: $767 (reported on 36.4% of returns)
This zip code:
$767
Pennsylvania:
$1,588
(% of AGI for various income ranges: 1.3% for AGIs below $25k, 1.4% for AGIs $25k-50k, 0.4% for AGIs $50k-75k, 0.2% for AGIs $75k-100k)
Ordinary dividends: $2,025 (reported on 12.1% of returns)
Here:
$2,025
State:
$5,827
Net capital gain/loss in AGI: +$2,400 (reported on 9.1% of returns)
Here:
+$2,400
State:
+$14,495
Profit/loss from business: +$5,200 (reported on 15.2% of returns)
Here:
+$5,200
State:
+$16,268
Taxable individual retirement arrangement distribution: $5,200 (reported on 12.1% of returns)
15551:
$5,200
Pennsylvania:
$14,550
Total itemized deductions: $15,029 (20% of AGI, reported on 21.2% of returns)
Here:
$15,029
State:
$23,538
Here:
20.0% of AGI
State:
18.4% of AGI
Charity contributions: $5,275 (reported on 12.1% of returns)
Here:
$5,275
State:
$4,025
Taxes paid: $4,043 (reported on 21.2% of returns)
15551:
$4,043
State:
$9,982
Earned income credit: $1,900 (reported on 15.2% of returns)
Here:
$1,900
State:
$2,106
(% of AGI for various income ranges: 6.1% for AGIs below $25k)
Percentage of individuals using paid preparers for their 2012 taxes: 66.7%
Here:
67%
State:
53%
(% for various income ranges: 58.3% for AGIs below $25k, 60.0% for AGIs $25k-50k, 83.3% for AGIs $50k-75k, 133.3% for AGIs $75k-100k)
Averages for the 2004 tax year for zip code 15551, filed in 2005:
Average Adjusted Gross Income (AGI) in 2004: $31,590 (Individual Income Tax Returns)
Here:
$31,590
State:
$48,049
Salary/wage: $29,788 (reported on 84.4% of returns)
Here:
$29,788
State:
$42,646
(% of AGI for various income ranges: 83.0% for AGIs below $10k, 69.1% for AGIs $10k-25k, 77.2% for AGIs $25k-50k, 88.4% for AGIs $50k-75k, 77.8% for AGIs $75k-100k)
Taxable interest for individuals: $1,473 (reported on 43.4% of returns)
This zip code:
$1,473
Pennsylvania:
$1,657
(% of AGI for various income ranges: 7.1% for AGIs below $10k, 4.5% for AGIs $10k-25k, 2.7% for AGIs $25k-50k, 0.6% for AGIs $50k-75k, 0.2% for AGIs $75k-100k)
Taxable dividends: $712 (reported on 15.0% of returns)
Here:
$712
State:
$3,566
(% of AGI for various income ranges: 2.5% for AGIs below $10k, 0.5% for AGIs $10k-25k, 0.5% for AGIs $25k-50k, 0.0% for AGIs $50k-75k)
Net capital gain/loss: +$4,000 (reported on 11.3% of returns)
Here:
+$4,000
State:
+$9,716
Profit/loss from business: +$5,333 (reported on 13.0% of returns)
Here:
+$5,333
State:
+$14,267
Profit/loss from farming: +$500 (reported on 3.5% of returns)
Here:
+$500
State:
+$274
IRA payment deduction: $3,091 (reported on 3.2% of returns)
15551:
$3,091
Pennsylvania:
$2,903
Total itemized deductions: $14,136 (26% of AGI, reported on 12.7% of returns)
Here:
$14,136
State:
$18,804
Here:
26.4% of AGI
State:
19.5% of AGI
Charity contributions deductions: $3,105 (6% of AGI, reported on 11.0% of returns)
Here:
$3,105
State:
$3,337
Here:
6.1% of AGI
State:
3.3% of AGI
Total tax: $3,219 (reported on 72.5% of returns)
15551:
$3,219
State:
$8,008
(% of AGI for various income ranges: 2.8% for AGIs below $10k, 4.2% for AGIs $10k-25k, 5.9% for AGIs $25k-50k, 8.7% for AGIs $50k-75k, 11.6% for AGIs $75k-100k)
Earned income credit: $1,593 (reported on 15.6% of returns)
Here:
$1,593
State:
$1,643
Percentage of individuals using paid preparers for their 2004 taxes: 68.8%
Here:
69%
State:
56%
(% for various income ranges: 65.3% for AGIs below $10k, 62.9% for AGIs $10k-25k, 74.1% for AGIs $25k-50k, 66.7% for AGIs $50k-75k, 84.2% for AGIs $75k-100k)
Household received Food Stamps/SNAP in the past 12 months: 18 Household did not receive Food Stamps/SNAP in the past 12 months: 209
Women who had a birth in the past 12 months: 8 (6 now married, 1 unmarried) Women who did not have a birth in the past 12 months: 64 (38 now married, 25 unmarried)
Housing units in zip code 15551 with a mortgage: 78 (7 second mortgage, 4 both second mortgage and home equity loan) Median monthly owner costs for units with a mortgage: $1,051 Median monthly owner costs for units without a mortgage: $326
Residents with income below the poverty level in 2022:
This zip code:
9.1%
Whole state:
11.8%
Residents with income below 50% of the poverty level in 2022:
This zip code:
8.5%
Whole state:
6.1%
Median number of rooms in houses and condos:
Here:
6.4
State:
6.8
Median number of rooms in apartments:
Here:
5.4
State:
4.3
Notable locations in this zip code not listed on our city pages
Streams, rivers, and creeks: Isers Run (A), Mose King Run (B), Harbaugh Run (C), May Run (D), Cranberry Glade Run (E), Sandy Run (F). Display/hide their locations on the map
Size of family households: 108 2-persons, 26 3-persons, 33 4-persons, 10 5-persons
Size of nonfamily households: 46 1-person, 3 2-persons
70 married couples with children.
45 single-parent households (41 men, 4 women).
98.9% of residents of 15551 zip code speak English at home.
0.7% of residents speak other Indo-European language at home (100% very well).
Foreign born population: 3 (0.6%) (100.0% of them are naturalized citizens)
This zip code:
0.6%
Whole state:
7.5%
67%France
41%German
13%American
12%English
9%Irish
6%Italian
3%Polish
2%French
Year of entry for the foreign-born population
02010 or later
02000 to 2009
01990 to 1999
2Before 1990
Housing units lacking complete plumbing facilities: 4.9% Housing units lacking complete kitchen facilities: 8.2%
28.5%Fuel oil, kerosene, etc.
21.7%Electricity
16.8%Coal or coke
16.3%Bottled, tank, or LP gas
11.8%Wood
5.0%Other fuel
1.4%No fuel used
Population in 1990: 288. Population change in the 1990s: +587 (+203.8%).
Place of birth for U.S.-born residents:
This state: 498
Northeast: 5
Midwest: 18
South: 17
West: 2
80% of the 15551 zip code residents lived in the same house 5 years ago. Out of people who lived in different houses, 81% lived in this county. Out of people who lived in different counties, 50% lived in Pennsylvania.
98% of the 15551 zip code residents lived in the same house 1 year ago. Out of people who lived in different houses, 71% moved from this county. Out of people who lived in different houses, 14% moved from different county within same state.
Private vs. public school enrollment:
Students in private schools in grades 1 to 8 (elementary and middle school): 7
Here:
8.9%
Pennsylvania:
15.7%
Students in private schools in grades 9 to 12 (high school):
Here:
0.0%
Pennsylvania:
13.4%
Students in private undergraduate colleges: 3
Here:
36.8%
Pennsylvania:
39.8%
Occupation by median earnings in the past 12 months ($)
91,262Transportation occupations
48,344Health diagnosing and treating practitioners and other technical occupations
42,545Production occupations
38,617Office and administrative support occupations
36,938Installation, maintenance, and repair occupations
34,335Building and grounds cleaning and maintenance occupations
Top industries in this zip code by the number of employees in 2005:
Wholesale Trade: Other Electronic Parts and Equipment Merchant Wholesalers (1-4 employees: 1 establishment)
Other Services (except Public Administration): Religious Organizations (1-4: 1)
Construction: Site Preparation Contractors (1-4: 1)
Construction: New Single-Family Housing Construction (except Operative Builders) (1-4: 1)
People in group quarters in 2000:
7 people in other noninstitutional group quarters
Fatal accident statistics in 2012:
Fatal accident count: 1
Vehicles involved in fatal accidents: 1
Fatal accidents caused by drunken drivers: 0
Fatalities: 1
Persons involved in fatal accidents: 2
Pedestrians involved in fatal accidents: 0
Fatal accident statistics in 2010:
Fatal accident count: 4
Vehicles involved in fatal accidents: 8
Fatal accidents caused by drunken drivers: 2
Fatalities: 5
Persons involved in fatal accidents: 6
Pedestrians involved in fatal accidents: 0
Home Mortgage Disclosure Act Aggregated Statistics For Year 2003 (Based on 2 partial tracts)
B) Conventional Home Purchase Loans
C) Refinancings
D) Home Improvement Loans
F) Non-occupant Loans on < 5 Family Dwellings (A B C & D)
Number
Average Value
Number
Average Value
Number
Average Value
Number
Average Value
LOANS ORIGINATED
23
$93,692
58
$77,933
12
$35,041
25
$108,923
APPLICATIONS APPROVED, NOT ACCEPTED
2
$47,155
10
$75,878
1
$49,600
1
$109,880
APPLICATIONS DENIED
5
$64,774
32
$73,290
7
$25,339
2
$83,635
APPLICATIONS WITHDRAWN
3
$88,730
23
$81,178
0
$0
3
$106,613
FILES CLOSED FOR INCOMPLETENESS
0
$0
1
$111,320
0
$0
1
$96,900
Aggregated Statistics For Year 2002 (Based on 2 partial tracts)
A) FHA, FSA/RHS & VA Home Purchase Loans
B) Conventional Home Purchase Loans
C) Refinancings
D) Home Improvement Loans
F) Non-occupant Loans on < 5 Family Dwellings (A B C & D)
Number
Average Value
Number
Average Value
Number
Average Value
Number
Average Value
Number
Average Value
LOANS ORIGINATED
1
$47,300
18
$736,221
37
$63,635
11
$31,829
12
$88,972
APPLICATIONS APPROVED, NOT ACCEPTED
0
$0
1
$47,870
7
$72,924
1
$27,400
2
$68,495
APPLICATIONS DENIED
0
$0
8
$45,135
32
$66,341
5
$21,226
1
$29,130
APPLICATIONS WITHDRAWN
0
$0
2
$70,370
15
$66,697
1
$10,670
1
$62,290
FILES CLOSED FOR INCOMPLETENESS
0
$0
0
$0
1
$102,960
0
$0
0
$0
Aggregated Statistics For Year 2001 (Based on 2 partial tracts)
A) FHA, FSA/RHS & VA Home Purchase Loans
B) Conventional Home Purchase Loans
C) Refinancings
D) Home Improvement Loans
F) Non-occupant Loans on < 5 Family Dwellings (A B C & D)
Number
Average Value
Number
Average Value
Number
Average Value
Number
Average Value
Number
Average Value
LOANS ORIGINATED
3
$64,023
14
$73,563
34
$65,501
17
$17,626
8
$95,100
APPLICATIONS APPROVED, NOT ACCEPTED
1
$60,850
3
$89,790
10
$71,523
1
$19,320
1
$224,660
APPLICATIONS DENIED
0
$0
11
$48,635
34
$59,495
9
$19,996
2
$80,610
APPLICATIONS WITHDRAWN
0
$0
2
$54,510
16
$65,485
2
$33,310
1
$34,030
FILES CLOSED FOR INCOMPLETENESS
0
$0
1
$31,440
3
$65,083
0
$0
0
$0
Aggregated Statistics For Year 2000 (Based on 2 partial tracts)
A) FHA, FSA/RHS & VA Home Purchase Loans
B) Conventional Home Purchase Loans
C) Refinancings
D) Home Improvement Loans
F) Non-occupant Loans on < 5 Family Dwellings (A B C & D)
Number
Average Value
Number
Average Value
Number
Average Value
Number
Average Value
Number
Average Value
LOANS ORIGINATED
3
$55,083
15
$71,831
21
$52,200
15
$17,843
9
$71,234
APPLICATIONS APPROVED, NOT ACCEPTED
0
$0
3
$56,143
5
$51,682
2
$15,860
1
$33,740
APPLICATIONS DENIED
0
$0
5
$37,434
21
$50,415
6
$11,200
1
$62,580
APPLICATIONS WITHDRAWN
0
$0
2
$70,945
8
$42,286
1
$40,950
0
$0
FILES CLOSED FOR INCOMPLETENESS
0
$0
1
$20,480
2
$47,730
0
$0
0
$0
Aggregated Statistics For Year 1999 (Based on 1 partial tract)
B) Conventional Home Purchase Loans
C) Refinancings
D) Home Improvement Loans
F) Non-occupant Loans on < 5 Family Dwellings (A B C & D)


 Nearest zip codes: 15540, 15557, 15424, 15411, 15464, 15502.


