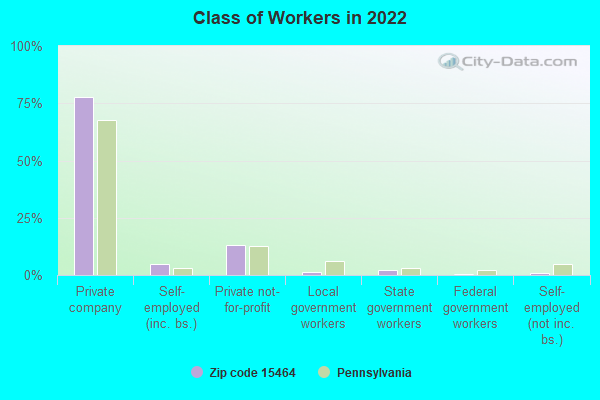
Estimated zip code population in 2022: 1,582 Zip code population in 2010: 1,536 Zip code population in 2000: 1,532
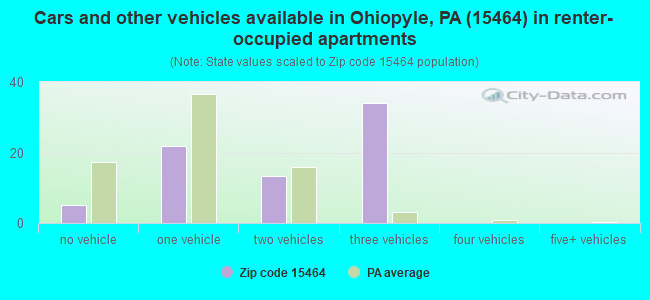
Houses and condos: 780 Renter-occupied apartments: 74
% of renters here:
12%
State:
31%
March 2022 cost of living index in zip code 15464: 88.2 (less than average, U.S. average is 100)
Land area: 46.0 sq. mi. Water area: 0.5 sq. mi.
Population density: 34 people per square mile
(very low).
OSM Map
General Map
Google Map
MSN Map
OSM Map
General Map
Google Map
MSN Map
OSM Map
General Map
Google Map
MSN Map
OSM Map
General Map
Google Map
MSN Map
Please wait while loading the map...
Real estate property taxes paid for housing units in 2022:
This zip code:
1.5% ($1,867)
Pennsylvania:
1.3% ($3,094)
Median real estate property taxes paid for housing units with mortgages in 2022: $1,951 (1.5%) Median real estate property taxes paid for housing units with no mortgage in 2022: $1,742 (1.6%)
Business Search- 14 Million verified businesses
Males: 794
(50.2%)
Females: 788
(49.8%)
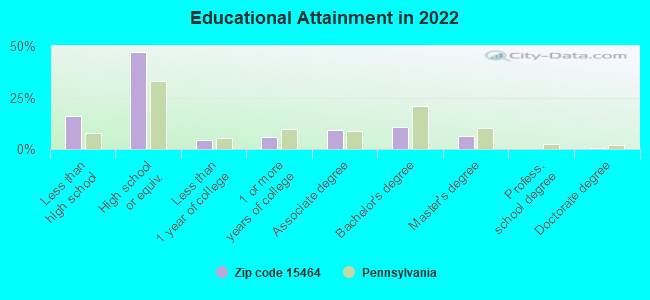
For population 25 years and over in 15464:
High school or higher: 82.7%
Bachelor's degree or higher: 17.1%
Graduate or professional degree: 6.6%
Unemployed: 7.5%
Mean travel time to work (commute): 31.2 minutes
For population 15 years and over in 15464:
Never married: 27.7%
Now married: 57.0%
Separated: 0.6%
Widowed: 7.4%
Divorced: 7.2%
Zip code 15464 compared to state average:
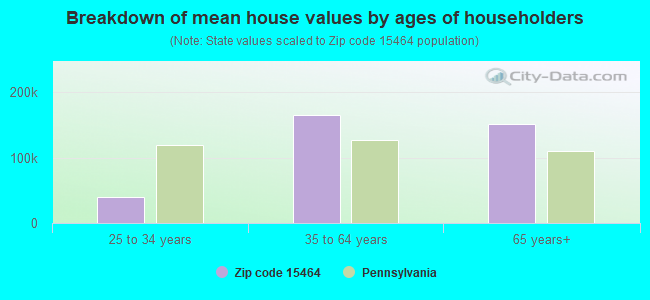
Median house value below state average.
Unemployed percentage above state average.
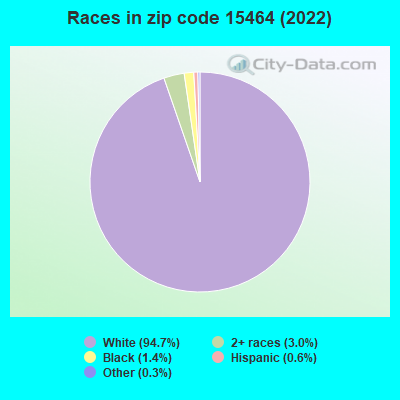
Black race population percentage significantly below state average.
Hispanic race population percentage significantly below state average.
Median age above state average.
Foreign-born population percentage significantly below state average.
Renting percentage significantly below state average.
Length of stay since moving in significantly above state average.
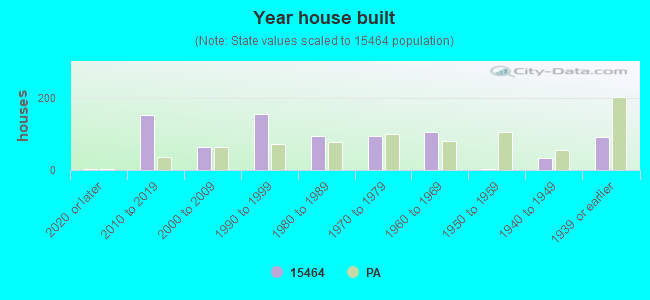
House age below state average.
Percentage of population with a bachelor's degree or higher below state average.
Averages for the 2020 tax year for zip code 15464, filed in 2021:
Average Adjusted Gross Income (AGI) in 2020: $50,825 (Individual Income Tax Returns)
Here:
$50,825
State:
$75,707
Salary/wage: $41,000 (reported on 86.2% of returns)
Here:
$41,000
State:
$62,806
(% of AGI for various income ranges: 1014.4% for AGIs below $25k, 3050.7% for AGIs $25k-50k, 5243.3% for AGIs $50k-75k, 9492.0% for AGIs $75k-100k, 18240.0% for AGIs $100k-200k)
Taxable interest for individuals: $371 (reported on 21.5% of returns)
This zip code:
$371
Pennsylvania:
$1,633
(% of AGI for various income ranges: 11.2% for AGIs below $25k, 2.7% for AGIs $25k-50k, 4.4% for AGIs $50k-75k, 22.0% for AGIs $75k-100k, 37.5% for AGIs $100k-200k)
Ordinary dividends: $380 (reported on 7.7% of returns)
Here:
$380
State:
$7,382
(% of AGI for various income ranges: 8.1% for AGIs below $25k, 12.0% for AGIs $75k-100k)
Net capital gain/loss in AGI: +$400 (reported on 4.6% of returns)
Here:
+$400
State:
+$23,522
(% of AGI for various income ranges: 8.0% for AGIs $25k-50k)
Profit/loss from business: +$8,740 (reported on 7.7% of returns)
Here:
+$8,740
State:
+$16,274
(% of AGI for various income ranges: 291.3% for AGIs $25k-50k)
Taxable individual retirement arrangement distribution: $9,017 (reported on 9.2% of returns)
15464:
$9,017
Pennsylvania:
$18,583
(% of AGI for various income ranges: 178.1% for AGIs below $25k, 284.4% for AGIs $50k-75k)
Earned income credit: $2,256 (reported on 13.8% of returns)
Here:
$2,256
State:
$2,100
(% of AGI for various income ranges: 68.8% for AGIs below $25k, 62.0% for AGIs $25k-50k)
Percentage of individuals using paid preparers for their 2020 taxes: 98.5%
Here:
98%
State:
92%
(% for various income ranges: 95.7% for AGIs below $25k, 100.0% for AGIs $25k-50k, 100.0% for AGIs $50k-75k, 100.0% for AGIs $75k-100k, 100.0% for AGIs $100k-200k)
Averages for the 2012 tax year for zip code 15464, filed in 2013:
Average Adjusted Gross Income (AGI) in 2012: $44,836 (Individual Income Tax Returns)
Here:
$44,836
State:
$61,346
Salary/wage: $34,135 (reported on 88.5% of returns)
Here:
$34,135
State:
$51,902
(% of AGI for various income ranges: 73.2% for AGIs below $25k, 77.8% for AGIs $25k-50k, 80.7% for AGIs $50k-75k, 85.3% for AGIs $75k-100k, 37.8% for AGIs $100k-200k)
Taxable interest for individuals: $400 (reported on 24.6% of returns)
This zip code:
$400
Pennsylvania:
$1,588
(% of AGI for various income ranges: 0.3% for AGIs below $25k, 0.3% for AGIs $25k-50k, 0.2% for AGIs $50k-75k, 0.6% for AGIs $75k-100k)
Ordinary dividends: $712 (reported on 13.1% of returns)
Here:
$712
State:
$5,827
Profit/loss from business: +$8,940 (reported on 8.2% of returns)
Here:
+$8,940
State:
+$16,268
Taxable individual retirement arrangement distribution: $6,320 (reported on 8.2% of returns)
15464:
$6,320
Pennsylvania:
$14,550
Total itemized deductions: $16,218 (17% of AGI, reported on 18.0% of returns)
Here:
$16,218
State:
$23,538
Here:
17.4% of AGI
State:
18.4% of AGI
(% of AGI for various income ranges: 8.6% for AGIs below $25k, 6.9% for AGIs $50k-75k, 9.0% for AGIs $75k-100k, 8.5% for AGIs $100k-200k)
Charity contributions: $3,167 (reported on 9.8% of returns)
Here:
$3,167
State:
$4,025
Taxes paid: $5,700 (reported on 18.0% of returns)
15464:
$5,700
State:
$9,982
(% of AGI for various income ranges: 1.8% for AGIs below $25k, 1.4% for AGIs $50k-75k, 3.0% for AGIs $75k-100k, 4.4% for AGIs $100k-200k)
Earned income credit: $2,015 (reported on 21.3% of returns)
Here:
$2,015
State:
$2,106
(% of AGI for various income ranges: 5.5% for AGIs below $25k, 1.3% for AGIs $25k-50k)
Percentage of individuals using paid preparers for their 2012 taxes: 72.1%
Here:
72%
State:
53%
(% for various income ranges: 70.4% for AGIs below $25k, 73.3% for AGIs $25k-50k, 80.0% for AGIs $50k-75k, 60.0% for AGIs $75k-100k, 75.0% for AGIs $100k-200k)
Averages for the 2004 tax year for zip code 15464, filed in 2005:
Average Adjusted Gross Income (AGI) in 2004: $30,438 (Individual Income Tax Returns)
Here:
$30,438
State:
$48,049
Salary/wage: $27,894 (reported on 88.1% of returns)
Here:
$27,894
State:
$42,646
(% of AGI for various income ranges: 99.0% for AGIs below $10k, 74.7% for AGIs $10k-25k, 83.7% for AGIs $25k-50k, 85.6% for AGIs $50k-75k, 68.8% for AGIs $75k-100k)
Taxable interest for individuals: $526 (reported on 32.1% of returns)
This zip code:
$526
Pennsylvania:
$1,657
(% of AGI for various income ranges: 1.4% for AGIs below $10k, 0.5% for AGIs $10k-25k, 0.6% for AGIs $25k-50k, 0.5% for AGIs $50k-75k, 0.4% for AGIs $75k-100k)
Taxable dividends: $362 (reported on 11.5% of returns)
Here:
$362
State:
$3,566
Net capital gain/loss: +$1,456 (reported on 9.5% of returns)
Here:
+$1,456
State:
+$9,716
(% of AGI for various income ranges: -2.2% for AGIs below $10k, 0.4% for AGIs $10k-25k, 0.5% for AGIs $25k-50k, 0.9% for AGIs $50k-75k)
Profit/loss from business: +$5,362 (reported on 11.5% of returns)
Here:
+$5,362
State:
+$14,267
IRA payment deduction: $1,450 (reported on 3.3% of returns)
15464:
$1,450
Pennsylvania:
$2,903
Total itemized deductions: $14,220 (23% of AGI, reported on 13.7% of returns)
Here:
$14,220
State:
$18,804
Here:
23.3% of AGI
State:
19.5% of AGI
Charity contributions deductions: $2,679 (4% of AGI, reported on 9.4% of returns)
Here:
$2,679
State:
$3,337
Here:
4.2% of AGI
State:
3.3% of AGI
Total tax: $3,095 (reported on 66.9% of returns)
15464:
$3,095
State:
$8,008
(% of AGI for various income ranges: 2.2% for AGIs below $10k, 3.9% for AGIs $10k-25k, 5.2% for AGIs $25k-50k, 8.8% for AGIs $50k-75k, 10.6% for AGIs $75k-100k)
Earned income credit: $1,662 (reported on 22.7% of returns)
Here:
$1,662
State:
$1,643
Percentage of individuals using paid preparers for their 2004 taxes: 63.0%
Here:
63%
State:
56%
(% for various income ranges: 60.5% for AGIs below $10k, 62.0% for AGIs $10k-25k, 66.1% for AGIs $25k-50k, 65.5% for AGIs $50k-75k, 53.6% for AGIs $75k-100k)
Household received Food Stamps/SNAP in the past 12 months: 189 Household did not receive Food Stamps/SNAP in the past 12 months: 462
Women who had a birth in the past 12 months: 53 (21 now married, 27 unmarried) Women who did not have a birth in the past 12 months: 324 (125 now married, 198 unmarried)
Housing units in zip code 15464 with a mortgage: 250 (10 second mortgage, 5 both second mortgage and home equity loan) Houses without a mortgage: 21
Median monthly owner costs for units with a mortgage: $1,217 Median monthly owner costs for units without a mortgage: $444
Residents with income below the poverty level in 2022:
This zip code:
21.2%
Whole state:
11.8%
Residents with income below 50% of the poverty level in 2022:
This zip code:
16.6%
Whole state:
6.1%
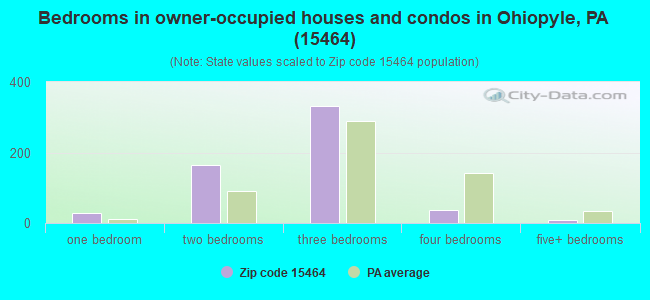
Median number of rooms in houses and condos:
Here:
6.0
State:
6.8
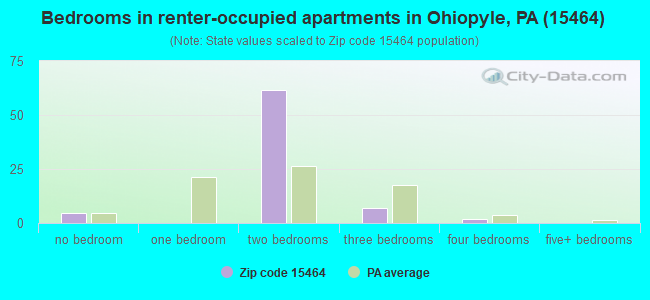
Median number of rooms in apartments:
Here:
4.2
State:
4.3
Notable locations in this zip code not listed on our city pages
Notable locations in zip code 15464: Killarney Park (A), Stewarton Station (B), Camp Christian (C), Falling Waters Museum (D), Springfield Township Volunteer Hose Company Station 35 (E). Display/hide their locations on the map
Churches in zip code 15464 include: Hickman Chapel (A), Maple Summit Church (B), Bear Run Church (C), Mill Run Church (D), Free Gospel Church (E), Critchfield Stone Church (F), Sands Church (G). Display/hide their locations on the map
Streams, rivers, and creeks: Jonathan Run (A), Jim Run (B), Sugar Run (C), Stony Run (D), Indian Creek (E), Fulton Run (F), Long Run (G), Workman Run (H), Crooked Run (I). Display/hide their locations on the map
Size of family households: 177 2-persons, 114 3-persons, 90 4-persons, 20 5-persons, 28 6-persons, 1 7-or-more-persons
Size of nonfamily households: 175 1-person, 35 2-persons
160 married couples with children.
45 single-parent households (42 men, 3 women).
95.1% of residents of 15464 zip code speak English at home.
3.9% of residents speak Spanish at home (100% very well).
0.3% of residents speak other Indo-European language at home (100% very well).
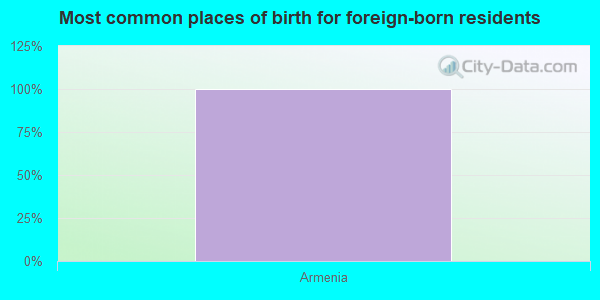
Foreign born population: 5 (0.3%) (100.0% of them are naturalized citizens)
This zip code:
0.3%
Whole state:
7.5%
100%Armenia
30%German
18%American
15%Irish
9%Italian
6%English
3%Polish
2%European
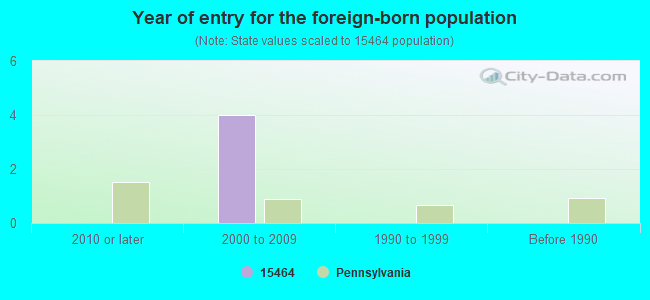
Year of entry for the foreign-born population
02010 or later
42000 to 2009
01990 to 1999
0Before 1990
Facilities with environmental interests located in this zip code:
AMERIKOHL MINING JIM MTN QUARRY (SR 653 JIM MOUNTAIN ROAD in MILL RUN, PA)
AIR MINOR (AIRS/AFS) STATE MASTER (Pennsylvania database) - AFS-231542403-6, AIR PROGRAM Business SIC classification: CRUSHED AND BROKEN LIMESTONE; NONMETALLIC MINERALS SERVICES, EXCEPT FUELS Organizations: HANSON AGGREGATES BMC, INC. (OWNER/OPERATOR)
Alternative names: AMERIKOHL MINING INC/JIM MTN QUARRY, AMERIKOHL MINING INC/SPERA SURFACE MINE
ARSENBERGER TRUCKING (RT 381 N in MILL RUN, PA)
STATE MASTER (Pennsylvania database) - RCRIS-PAD010451458, HAZARDOUS WASTE PROGRAM Small Quantity Generators, between 100 kg and 1000 kg of hazardous waste/month (Resource Conservation and Recovery Act (tracking hazardous waste)) - notification Organizations: OPERNAME (CONTACT/OPERATOR)
, ARSENBERGER, ROBERT (CONTACT/OWNER)
Housing units lacking complete plumbing facilities: 1.8%
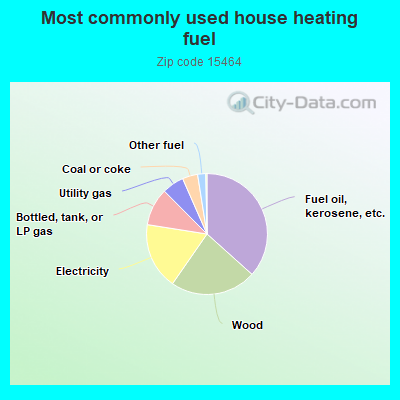
36.8%Fuel oil, kerosene, etc.
23.1%Wood
17.9%Electricity
10.1%Bottled, tank, or LP gas
5.9%Utility gas
4.1%Coal or coke
2.2%Other fuel
Population in 1990: 1,972.
Place of birth for U.S.-born residents:
This state: 1,305
Midwest: 54
South: 197
West: 11
80% of the 15464 zip code residents lived in the same house 5 years ago. Out of people who lived in different houses, 80% lived in this county. Out of people who lived in different counties, 50% lived in Pennsylvania.
97% of the 15464 zip code residents lived in the same house 1 year ago. Out of people who lived in different houses, 19% moved from this county. Out of people who lived in different houses, 88% moved from different county within same state.
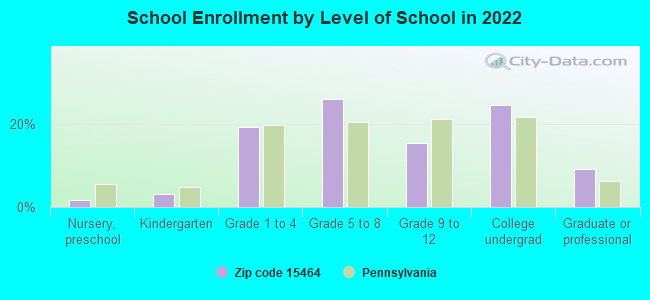
Private vs. public school enrollment:
Students in private schools in grades 1 to 8 (elementary and middle school): 2
Here:
2.1%
Pennsylvania:
15.7%
Students in private schools in grades 9 to 12 (high school): 5
Here:
16.6%
Pennsylvania:
13.4%
Students in private undergraduate colleges:
Here:
0.0%
Pennsylvania:
39.8%
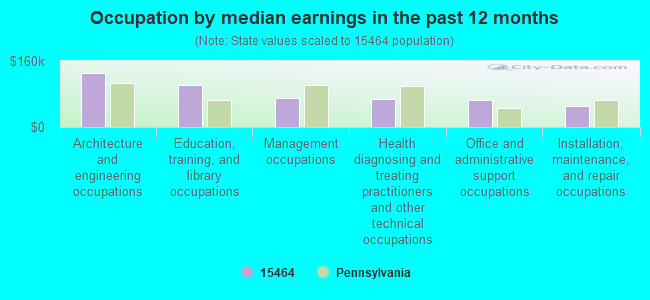
Occupation by median earnings in the past 12 months ($)
130,313Architecture and engineering occupations
102,003Education, training, and library occupations
70,962Management occupations
67,189Health diagnosing and treating practitioners and other technical occupations
65,236Office and administrative support occupations
51,729Installation, maintenance, and repair occupations
Top industries in this zip code by the number of employees in 2005:
Arts, Entertainment, and Recreation: Museums (50-99 employees: 1 establishment)
Accommodation and Food Services: RV (Recreational Vehicle) Parks and Campgrounds (10-19: 1, 1-4: 1)
Accommodation and Food Services: Full-Service Restaurants (5-9: 1)
Construction: Masonry Contractors (1-4: 2)
Accommodation and Food Services: Drinking Places (Alcoholic Beverages) (1-4: 2)
Other Services (except Public Administration): Religious Organizations (1-4: 1)
Construction: Drywall and Insulation Contractors (1-4: 1)
Fatal accident statistics in 2011:
Fatal accident count: 2
Vehicles involved in fatal accidents: 2
Fatal accidents caused by drunken drivers: 1
Fatalities: 2
Persons involved in fatal accidents: 2
Pedestrians involved in fatal accidents: 0
Fatal accident statistics in 2010:
Fatal accident count: 1
Vehicles involved in fatal accidents: 2
Fatal accidents caused by drunken drivers: 0
Fatalities: 1
Persons involved in fatal accidents: 2
Pedestrians involved in fatal accidents: 0
Home Mortgage Disclosure Act Aggregated Statistics For Year 2009 (Based on 4 partial tracts)
A) FHA, FSA/RHS & VA Home Purchase Loans
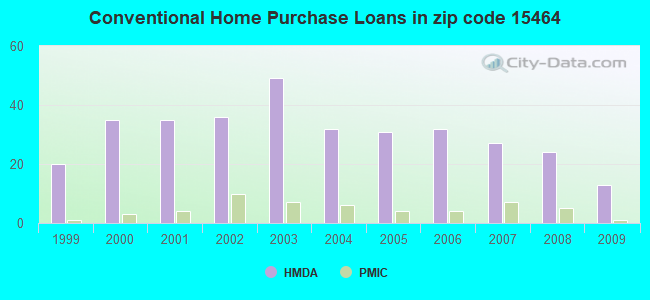
B) Conventional Home Purchase Loans
C) Refinancings
D) Home Improvement Loans
F) Non-occupant Loans on < 5 Family Dwellings (A B C & D)
G) Loans On Manufactured Home Dwelling (A B C & D)
Number
Average Value
Number
Average Value
Number
Average Value
Number
Average Value
Number
Average Value
Number
Average Value
LOANS ORIGINATED
5
$104,106
13
$158,807
62
$149,283
15
$38,698
18
$253,354
6
$40,350
APPLICATIONS APPROVED, NOT ACCEPTED
0
$0
3
$135,530
6
$139,842
1
$42,710
2
$242,570
1
$47,820
APPLICATIONS DENIED
1
$57,060
5
$65,472
37
$138,612
10
$31,183
8
$189,719
7
$41,146
APPLICATIONS WITHDRAWN
0
$0
1
$172,640
13
$160,139
1
$152,820
3
$283,130
1
$50,310
FILES CLOSED FOR INCOMPLETENESS
0
$0
0
$0
2
$128,955
0
$0
0
$0
0
$0
Aggregated Statistics For Year 2008 (Based on 4 partial tracts)
A) FHA, FSA/RHS & VA Home Purchase Loans
B) Conventional Home Purchase Loans
C) Refinancings
D) Home Improvement Loans
F) Non-occupant Loans on < 5 Family Dwellings (A B C & D)
G) Loans On Manufactured Home Dwelling (A B C & D)
Number
Average Value
Number
Average Value
Number
Average Value
Number
Average Value
Number
Average Value
Number
Average Value
LOANS ORIGINATED
4
$123,460
24
$168,276
39
$93,591
23
$33,982
13
$198,325
12
$63,214
APPLICATIONS APPROVED, NOT ACCEPTED
0
$0
4
$142,790
5
$89,720
3
$41,460
1
$279,870
1
$62,570
APPLICATIONS DENIED
0
$0
10
$166,140
47
$102,526
17
$30,195
4
$308,288
11
$68,145
APPLICATIONS WITHDRAWN
0
$0
3
$117,423
13
$108,607
1
$31,840
2
$133,860
1
$73,710
FILES CLOSED FOR INCOMPLETENESS
0
$0
0
$0
3
$105,517
1
$11,740
0
$0
0
$0
Aggregated Statistics For Year 2007 (Based on 4 partial tracts)
A) FHA, FSA/RHS & VA Home Purchase Loans
B) Conventional Home Purchase Loans
C) Refinancings
D) Home Improvement Loans
F) Non-occupant Loans on < 5 Family Dwellings (A B C & D)
G) Loans On Manufactured Home Dwelling (A B C & D)
Number
Average Value
Number
Average Value
Number
Average Value
Number
Average Value
Number
Average Value
Number
Average Value
LOANS ORIGINATED
5
$108,794
27
$151,944
52
$92,914
28
$45,550
18
$158,816
14
$53,624
APPLICATIONS APPROVED, NOT ACCEPTED
0
$0
4
$147,745
13
$87,174
4
$39,848
3
$119,567
3
$65,563
APPLICATIONS DENIED
1
$101,710
12
$132,156
70
$96,324
22
$39,428
4
$250,118
17
$60,732
APPLICATIONS WITHDRAWN
0
$0
5
$65,786
19
$103,461
2
$47,780
3
$88,843
1
$68,790
FILES CLOSED FOR INCOMPLETENESS
0
$0
0
$0
6
$196,202
0
$0
0
$0
0
$0
Aggregated Statistics For Year 2006 (Based on 4 partial tracts)
A) FHA, FSA/RHS & VA Home Purchase Loans
B) Conventional Home Purchase Loans
C) Refinancings
D) Home Improvement Loans
F) Non-occupant Loans on < 5 Family Dwellings (A B C & D)
G) Loans On Manufactured Home Dwelling (A B C & D)
Number
Average Value
Number
Average Value
Number
Average Value
Number
Average Value
Number
Average Value
Number
Average Value
LOANS ORIGINATED
4
$71,648
32
$136,099
60
$99,986
35
$38,463
17
$152,585
11
$64,979
APPLICATIONS APPROVED, NOT ACCEPTED
0
$0
11
$121,540
12
$117,938
6
$30,068
4
$203,348
3
$50,203
APPLICATIONS DENIED
2
$70,095
14
$67,311
82
$90,388
30
$31,872
2
$105,875
21
$61,612
APPLICATIONS WITHDRAWN
0
$0
5
$110,042
33
$122,774
2
$57,395
2
$86,050
2
$82,495
FILES CLOSED FOR INCOMPLETENESS
0
$0
0
$0
10
$141,452
0
$0
1
$71,630
1
$53,770
Aggregated Statistics For Year 2005 (Based on 4 partial tracts)
A) FHA, FSA/RHS & VA Home Purchase Loans
B) Conventional Home Purchase Loans
C) Refinancings
D) Home Improvement Loans
F) Non-occupant Loans on < 5 Family Dwellings (A B C & D)
G) Loans On Manufactured Home Dwelling (A B C & D)
Number
Average Value
Number
Average Value
Number
Average Value
Number
Average Value
Number
Average Value
Number
Average Value
LOANS ORIGINATED
2
$67,375
31
$109,887
67
$94,361
34
$35,531
10
$128,915
10
$49,792
APPLICATIONS APPROVED, NOT ACCEPTED
0
$0
10
$110,593
21
$71,984
4
$53,718
2
$250,410
7
$57,854
APPLICATIONS DENIED
1
$74,440
22
$66,246
107
$92,383
30
$43,926
7
$96,050
34
$60,958
APPLICATIONS WITHDRAWN
0
$0
3
$63,067
40
$108,123
5
$113,876
1
$78,510
5
$76,718
FILES CLOSED FOR INCOMPLETENESS
0
$0
1
$95,480
9
$116,498
0
$0
1
$66,310
0
$0
Aggregated Statistics For Year 2004 (Based on 4 partial tracts)
A) FHA, FSA/RHS & VA Home Purchase Loans
B) Conventional Home Purchase Loans
C) Refinancings
D) Home Improvement Loans
F) Non-occupant Loans on < 5 Family Dwellings (A B C & D)
G) Loans On Manufactured Home Dwelling (A B C & D)
Number
Average Value
Number
Average Value
Number
Average Value
Number
Average Value
Number
Average Value
Number
Average Value
LOANS ORIGINATED
3
$98,117
32
$124,364
88
$76,611
37
$37,457
17
$135,365
7
$54,667
APPLICATIONS APPROVED, NOT ACCEPTED
0
$0
5
$114,256
24
$73,240
4
$50,040
1
$157,950
4
$64,872
APPLICATIONS DENIED
1
$72,410
21
$70,699
107
$83,225
28
$33,867
4
$87,185
20
$48,162
APPLICATIONS WITHDRAWN
0
$0
6
$107,073
47
$91,870
6
$31,818
2
$119,870
6
$71,252
FILES CLOSED FOR INCOMPLETENESS
0
$0
2
$48,805
12
$118,217
2
$36,965
0
$0
1
$55,010
Aggregated Statistics For Year 2003 (Based on 4 partial tracts)
A) FHA, FSA/RHS & VA Home Purchase Loans
B) Conventional Home Purchase Loans
C) Refinancings
D) Home Improvement Loans
F) Non-occupant Loans on < 5 Family Dwellings (A B C & D)
Number
Average Value
Number
Average Value
Number
Average Value
Number
Average Value
Number
Average Value
LOANS ORIGINATED
2
$121,140
49
$126,859
161
$84,638
40
$28,888
42
$140,310
APPLICATIONS APPROVED, NOT ACCEPTED
0
$0
6
$61,458
43
$79,807
5
$35,394
6
$134,890
APPLICATIONS DENIED
0
$0
15
$55,801
113
$74,905
32
$19,876
6
$83,025
APPLICATIONS WITHDRAWN
0
$0
5
$98,170
56
$85,630
5
$29,672
5
$86,902
FILES CLOSED FOR INCOMPLETENESS
1
$51,040
1
$86,040
7
$102,059
1
$52,650
1
$133,540
Aggregated Statistics For Year 2002 (Based on 4 partial tracts)
A) FHA, FSA/RHS & VA Home Purchase Loans
B) Conventional Home Purchase Loans
C) Refinancings
D) Home Improvement Loans
F) Non-occupant Loans on < 5 Family Dwellings (A B C & D)
Number
Average Value
Number
Average Value
Number
Average Value
Number
Average Value
Number
Average Value
LOANS ORIGINATED
0
$0
36
$99,850
96
$83,026
32
$29,353
28
$110,172
APPLICATIONS APPROVED, NOT ACCEPTED
0
$0
5
$91,150
23
$80,172
5
$43,480
4
$127,515
APPLICATIONS DENIED
1
$95,620
15
$39,721
83
$70,669
20
$22,602
2
$101,300
APPLICATIONS WITHDRAWN
0
$0
4
$90,260
53
$75,609
7
$21,200
3
$67,990
FILES CLOSED FOR INCOMPLETENESS
0
$0
1
$45,150
8
$99,442
0
$0
1
$191,840
Aggregated Statistics For Year 2001 (Based on 4 partial tracts)
A) FHA, FSA/RHS & VA Home Purchase Loans
B) Conventional Home Purchase Loans
C) Refinancings
D) Home Improvement Loans
F) Non-occupant Loans on < 5 Family Dwellings (A B C & D)
Number
Average Value
Number
Average Value
Number
Average Value
Number
Average Value
Number
Average Value
LOANS ORIGINATED
3
$69,277
35
$93,587
112
$66,383
39
$26,279
26
$103,930
APPLICATIONS APPROVED, NOT ACCEPTED
0
$0
9
$58,971
32
$57,660
7
$23,820
3
$67,290
APPLICATIONS DENIED
0
$0
27
$51,343
87
$60,784
38
$16,751
6
$38,987
APPLICATIONS WITHDRAWN
0
$0
3
$75,217
34
$69,166
7
$18,809
2
$78,995
FILES CLOSED FOR INCOMPLETENESS
0
$0
0
$0
11
$56,050
1
$11,760
0
$0
Aggregated Statistics For Year 2000 (Based on 4 partial tracts)
A) FHA, FSA/RHS & VA Home Purchase Loans
B) Conventional Home Purchase Loans
C) Refinancings
D) Home Improvement Loans
F) Non-occupant Loans on < 5 Family Dwellings (A B C & D)
Number
Average Value
Number
Average Value
Number
Average Value
Number
Average Value
Number
Average Value
LOANS ORIGINATED
4
$60,875
35
$88,491
52
$52,311
36
$19,264
13
$112,842
APPLICATIONS APPROVED, NOT ACCEPTED
0
$0
8
$70,342
16
$62,027
6
$19,828
1
$91,210
APPLICATIONS DENIED
1
$56,420
25
$47,993
62
$57,407
20
$21,472
3
$55,687
APPLICATIONS WITHDRAWN
1
$29,370
4
$96,432
21
$58,120
3
$17,320
1
$119,340
FILES CLOSED FOR INCOMPLETENESS
0
$0
0
$0
5
$69,804
0
$0
0
$0
Aggregated Statistics For Year 1999 (Based on 2 partial tracts)
A) FHA, FSA/RHS & VA Home Purchase Loans
B) Conventional Home Purchase Loans
C) Refinancings
D) Home Improvement Loans
F) Non-occupant Loans on < 5 Family Dwellings (A B C & D)


 Nearest zip codes: 15469, 15446, 15470, 15424, 15490, 15462.