Estimated zip code population in 2022: 3,330 Zip code population in 2010: 3,702 Zip code population in 2000: 3,356
Houses and condos: 1,617 Renter-occupied apartments: 127
% of renters here:
9%
State:
31%
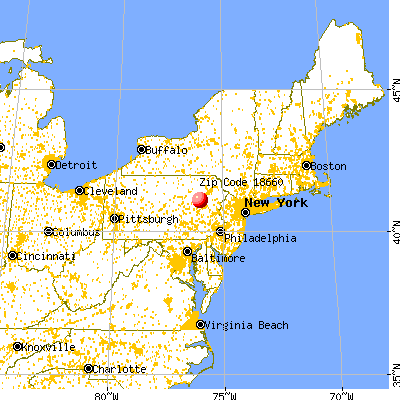
March 2022 cost of living index in zip code 18660: 91.9 (less than average, U.S. average is 100)
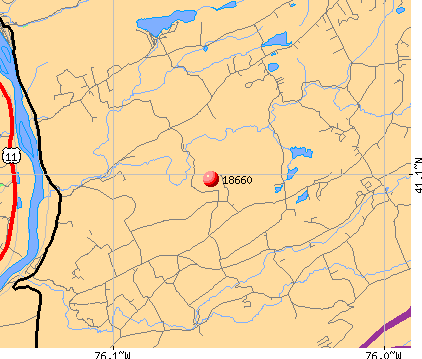
Land area: 42.5 sq. mi. Water area: 1.5 sq. mi.
Population density: 78 people per square mile
(very low).
OSM Map
General Map
Google Map
MSN Map
OSM Map
General Map
Google Map
MSN Map
OSM Map
General Map
Google Map
MSN Map
OSM Map
General Map
Google Map
MSN Map
Please wait while loading the map...
Real estate property taxes paid for housing units in 2022:
This zip code:
1.2% ($2,407)
Pennsylvania:
1.3% ($3,094)
Median real estate property taxes paid for housing units with mortgages in 2022: $2,382 (1.2%) Median real estate property taxes paid for housing units with no mortgage in 2022: $2,452 (1.3%)
Business Search- 14 Million verified businesses
Males: 1,681
(50.5%)
Females: 1,649
(49.5%)
For population 25 years and over in 18660:
High school or higher: 90.3%
Bachelor's degree or higher: 23.2%
Graduate or professional degree: 10.4%
Unemployed: 4.8%
Mean travel time to work (commute): 32.2 minutes
For population 15 years and over in 18660:
Never married: 22.8%
Now married: 61.6%
Separated: 1.4%
Widowed: 5.0%
Divorced: 9.2%
Zip code 18660 compared to state average:
Black race population percentage significantly below state average.
Hispanic race population percentage significantly below state average.
Median age above state average.
Foreign-born population percentage significantly below state average.
Renting percentage significantly below state average.
Length of stay since moving in significantly above state average.
Estimated median house/condo value in 2022: $196,009
18660:
$196,009
Pennsylvania:
$245,500
According to our research of Pennsylvania and other state lists, there were 6 registered sex offenders living in 18660 zip code as of June 05, 2024. The ratio of all residents to sex offenders in zip code 18660 is 603 to 1. The ratio of registered sex offenders to all residents in this zip code is near the state average.
Median resident age:
This zip code:
46.7 years
Pennsylvania median age:
40.9 years
Average household size:
This zip code:
2.4 people
Pennsylvania:
2.4 people
Averages for the 2020 tax year for zip code 18660, filed in 2021:
Average Adjusted Gross Income (AGI) in 2020: $57,634 (Individual Income Tax Returns)
Here:
$57,634
State:
$75,707
Salary/wage: $53,586 (reported on 78.7% of returns)
Here:
$53,586
State:
$62,806
(% of AGI for various income ranges: 996.5% for AGIs below $25k, 3246.5% for AGIs $25k-50k, 6307.2% for AGIs $50k-75k, 7970.0% for AGIs $75k-100k, 13045.2% for AGIs $100k-200k)
Taxable interest for individuals: $1,133 (reported on 30.3% of returns)
This zip code:
$1,133
Pennsylvania:
$1,633
(% of AGI for various income ranges: 25.0% for AGIs below $25k, 16.5% for AGIs $25k-50k, 24.4% for AGIs $50k-75k, 41.8% for AGIs $75k-100k, 131.0% for AGIs $100k-200k)
Ordinary dividends: $1,993 (reported on 22.9% of returns)
Here:
$1,993
State:
$7,382
(% of AGI for various income ranges: 35.0% for AGIs below $25k, 32.4% for AGIs $25k-50k, 61.6% for AGIs $50k-75k, 119.4% for AGIs $75k-100k, 83.3% for AGIs $100k-200k)
Net capital gain/loss in AGI: +$8,594 (reported on 16.5% of returns)
Here:
+$8,594
State:
+$23,522
(% of AGI for various income ranges: 15.0% for AGIs below $25k, 19.5% for AGIs $25k-50k, 72.4% for AGIs $50k-75k, 190.6% for AGIs $75k-100k, 473.3% for AGIs $100k-200k)
Profit/loss from business: +$10,745 (reported on 11.7% of returns)
Here:
+$10,745
State:
+$16,274
(% of AGI for various income ranges: 106.5% for AGIs below $25k, 86.5% for AGIs $25k-50k, 304.0% for AGIs $50k-75k, 67.1% for AGIs $75k-100k, 384.8% for AGIs $100k-200k)
Taxable individual retirement arrangement distribution: $11,348 (reported on 12.2% of returns)
18660:
$11,348
Pennsylvania:
$18,583
(% of AGI for various income ranges: 115.0% for AGIs below $25k, 130.0% for AGIs $25k-50k, 178.0% for AGIs $50k-75k, 222.4% for AGIs $75k-100k, 435.7% for AGIs $100k-200k)
Total itemized deductions: $32,167 (reported on 1.6% of returns)
Here:
$32,167
State:
$34,850
(% of AGI for various income ranges: 567.6% for AGIs $75k-100k)
Charity contributions: $4,750 (reported on 1.1% of returns)
Here:
$4,750
State:
$12,392
(% of AGI for various income ranges: 38.0% for AGIs $50k-75k)
Taxes paid: $6,875 (reported on 2.1% of returns)
18660:
$6,875
State:
$8,200
(% of AGI for various income ranges: 161.8% for AGIs $75k-100k)
Earned income credit: $1,716 (reported on 10.1% of returns)
Here:
$1,716
State:
$2,100
(% of AGI for various income ranges: 46.8% for AGIs below $25k, 45.1% for AGIs $25k-50k)
Percentage of individuals using paid preparers for their 2020 taxes: 94.1%
Here:
94%
State:
92%
(% for various income ranges: 92.9% for AGIs below $25k, 93.5% for AGIs $25k-50k, 94.1% for AGIs $50k-75k, 95.2% for AGIs $75k-100k, 96.3% for AGIs $100k-200k, 100.0% for AGIs over 200k)
Averages for the 2012 tax year for zip code 18660, filed in 2013:
Average Adjusted Gross Income (AGI) in 2012: $47,177 (Individual Income Tax Returns)
Here:
$47,177
State:
$61,346
Salary/wage: $44,578 (reported on 83.5% of returns)
Here:
$44,578
State:
$51,902
(% of AGI for various income ranges: 71.1% for AGIs below $25k, 77.6% for AGIs $25k-50k, 83.5% for AGIs $50k-75k, 79.3% for AGIs $75k-100k, 78.4% for AGIs $100k-200k)
Taxable interest for individuals: $742 (reported on 34.6% of returns)
This zip code:
$742
Pennsylvania:
$1,588
(% of AGI for various income ranges: 1.5% for AGIs below $25k, 0.5% for AGIs $25k-50k, 0.5% for AGIs $50k-75k, 0.3% for AGIs $75k-100k, 0.4% for AGIs $100k-200k)
Ordinary dividends: $1,376 (reported on 23.9% of returns)
Here:
$1,376
State:
$5,827
(% of AGI for various income ranges: 1.4% for AGIs below $25k, 0.7% for AGIs $25k-50k, 0.6% for AGIs $50k-75k, 0.7% for AGIs $75k-100k, 0.6% for AGIs $100k-200k)
Net capital gain/loss in AGI: +$1,867 (reported on 12.8% of returns)
Here:
+$1,867
State:
+$14,495
(% of AGI for various income ranges: 0.9% for AGIs $75k-100k, 1.1% for AGIs $100k-200k)
Profit/loss from business: +$12,200 (reported on 11.7% of returns)
Here:
+$12,200
State:
+$16,268
(% of AGI for various income ranges: 5.6% for AGIs below $25k, 4.9% for AGIs $25k-50k, 1.9% for AGIs $50k-75k, 2.3% for AGIs $75k-100k, 2.3% for AGIs $100k-200k)
Taxable individual retirement arrangement distribution: $7,886 (reported on 11.7% of returns)
18660:
$7,886
Pennsylvania:
$14,550
(% of AGI for various income ranges: 5.0% for AGIs below $25k, 2.4% for AGIs $25k-50k, 1.1% for AGIs $50k-75k, 2.1% for AGIs $75k-100k, 1.1% for AGIs $100k-200k)
Total itemized deductions: $16,646 (19% of AGI, reported on 21.8% of returns)
Here:
$16,646
State:
$23,538
Here:
19.1% of AGI
State:
18.4% of AGI
(% of AGI for various income ranges: 5.0% for AGIs below $25k, 5.3% for AGIs $25k-50k, 7.1% for AGIs $50k-75k, 8.9% for AGIs $75k-100k, 9.8% for AGIs $100k-200k)
Charity contributions: $1,810 (reported on 16.5% of returns)
Here:
$1,810
State:
$4,025
(% of AGI for various income ranges: 0.4% for AGIs $25k-50k, 0.7% for AGIs $50k-75k, 0.6% for AGIs $75k-100k, 1.0% for AGIs $100k-200k)
Taxes paid: $6,646 (reported on 21.8% of returns)
18660:
$6,646
State:
$9,982
(% of AGI for various income ranges: 1.3% for AGIs below $25k, 1.6% for AGIs $25k-50k, 2.8% for AGIs $50k-75k, 3.2% for AGIs $75k-100k, 4.8% for AGIs $100k-200k)
Earned income credit: $1,826 (reported on 12.2% of returns)
Here:
$1,826
State:
$2,106
(% of AGI for various income ranges: 3.9% for AGIs below $25k, 0.6% for AGIs $25k-50k)
Percentage of individuals using paid preparers for their 2012 taxes: 59.0%
Here:
59%
State:
53%
(% for various income ranges: 55.1% for AGIs below $25k, 60.4% for AGIs $25k-50k, 59.4% for AGIs $50k-75k, 61.9% for AGIs $75k-100k, 66.7% for AGIs $100k-200k)
Averages for the 2004 tax year for zip code 18660, filed in 2005:
Average Adjusted Gross Income (AGI) in 2004: $37,011 (Individual Income Tax Returns)
Here:
$37,011
State:
$48,049
Salary/wage: $35,639 (reported on 87.3% of returns)
Here:
$35,639
State:
$42,646
(% of AGI for various income ranges: 92.9% for AGIs below $10k, 72.0% for AGIs $10k-25k, 85.0% for AGIs $25k-50k, 89.6% for AGIs $50k-75k, 84.7% for AGIs $75k-100k, 76.8% for AGIs over 100k)
Taxable interest for individuals: $708 (reported on 49.7% of returns)
This zip code:
$708
Pennsylvania:
$1,657
(% of AGI for various income ranges: 4.4% for AGIs below $10k, 2.5% for AGIs $10k-25k, 0.8% for AGIs $25k-50k, 0.5% for AGIs $50k-75k, 0.9% for AGIs $75k-100k, 0.4% for AGIs over 100k)
Taxable dividends: $1,039 (reported on 26.8% of returns)
Here:
$1,039
State:
$3,566
(% of AGI for various income ranges: 2.1% for AGIs below $10k, 1.3% for AGIs $10k-25k, 0.4% for AGIs $25k-50k, 0.3% for AGIs $50k-75k, 0.7% for AGIs $75k-100k, 1.8% for AGIs over 100k)
Net capital gain/loss: +$876 (reported on 13.6% of returns)
Here:
+$876
State:
+$9,716
(% of AGI for various income ranges: -1.5% for AGIs below $10k, -0.4% for AGIs $10k-25k, 0.1% for AGIs $25k-50k, 0.0% for AGIs $50k-75k, 0.3% for AGIs $75k-100k, 2.5% for AGIs over 100k)
Profit/loss from business: +$12,279 (reported on 12.7% of returns)
Here:
+$12,279
State:
+$14,267
(% of AGI for various income ranges: 8.5% for AGIs below $10k, 7.3% for AGIs $10k-25k, 3.7% for AGIs $25k-50k, 2.7% for AGIs $50k-75k, 4.5% for AGIs $75k-100k, 5.0% for AGIs over 100k)
Profit/loss from farming: +$760 (reported on 1.4% of returns)
Here:
+$760
State:
+$274
IRA payment deduction: $2,636 (reported on 3.6% of returns)
18660:
$2,636
Pennsylvania:
$2,903
(% of AGI for various income ranges: 0.5% for AGIs $10k-25k, 0.4% for AGIs $25k-50k, 0.1% for AGIs $50k-75k, 0.3% for AGIs $75k-100k)
Total itemized deductions: $13,700 (21% of AGI, reported on 22.6% of returns)
Here:
$13,700
State:
$18,804
Here:
20.6% of AGI
State:
19.5% of AGI
(% of AGI for various income ranges: 3.5% for AGIs $10k-25k, 6.9% for AGIs $25k-50k, 9.1% for AGIs $50k-75k, 11.2% for AGIs $75k-100k, 11.3% for AGIs over 100k)
Charity contributions deductions: $1,616 (2% of AGI, reported on 19.5% of returns)
Here:
$1,616
State:
$3,337
Here:
2.4% of AGI
State:
3.3% of AGI
(% of AGI for various income ranges: 0.4% for AGIs $10k-25k, 0.5% for AGIs $25k-50k, 0.8% for AGIs $50k-75k, 1.1% for AGIs $75k-100k, 1.9% for AGIs over 100k)
Total tax: $4,293 (reported on 77.4% of returns)
18660:
$4,293
State:
$8,008
(% of AGI for various income ranges: 2.8% for AGIs below $10k, 4.8% for AGIs $10k-25k, 7.2% for AGIs $25k-50k, 8.6% for AGIs $50k-75k, 10.7% for AGIs $75k-100k, 15.7% for AGIs over 100k)
Earned income credit: $1,283 (reported on 11.6% of returns)
Here:
$1,283
State:
$1,643
Percentage of individuals using paid preparers for their 2004 taxes: 63.5%
Here:
63%
State:
56%
(% for various income ranges: 57.8% for AGIs below $10k, 63.7% for AGIs $10k-25k, 67.6% for AGIs $25k-50k, 62.2% for AGIs $50k-75k, 63.6% for AGIs $75k-100k, 70.1% for AGIs over 100k)
Household received Food Stamps/SNAP in the past 12 months: 112 Household did not receive Food Stamps/SNAP in the past 12 months: 1,298
Women who had a birth in the past 12 months: 23 (14 now married, 8 unmarried) Women who did not have a birth in the past 12 months: 650 (349 now married, 297 unmarried)
Housing units in zip code 18660 with a mortgage: 698 (78 second mortgage, 4 home equity loan, 63 both second mortgage and home equity loan) Houses without a mortgage: 65
Median monthly owner costs for units with a mortgage: $1,304 Median monthly owner costs for units without a mortgage: $530
Residents with income below the poverty level in 2022:
This zip code:
7.1%
Whole state:
11.8%
Residents with income below 50% of the poverty level in 2022:
This zip code:
4.4%
Whole state:
6.1%
Median number of rooms in houses and condos:
Here:
6.3
State:
6.8
Median number of rooms in apartments:
Here:
5.7
State:
4.3
Notable locations in this zip code not listed on our city pages
Notable locations in zip code 18660: Council Cup Scenic Overlook (A), Camp Keller (B), Dorrance Township Volunteer Fire Department (C), Slocum Township Volunteer Fire Company 1 (D), Pond Hill Lily Lake Volunteer Fire Company (E). Display/hide their locations on the map
Churches in zip code 18660 include: River Church (A), Saint James Church (B), Mount Zion Union Church (C), Emmanuel Church (D), Slocum Church (E). Display/hide their locations on the map
Streams, rivers, and creeks: Big Wapwallopen Creek (A), Little Wapwallopen Creek (B), Pond Creek (C), Balliet Run (D). Display/hide their locations on the map
In group quarters: 5 (-1 institutionalized population)
Size of family households: 566 2-persons, 232 3-persons, 146 4-persons, 42 5-persons, 12 6-persons, 11 7-or-more-persons
Size of nonfamily households: 301 1-person, 100 2-persons, 3 3-persons
351 married couples with children.
132 single-parent households (54 men, 78 women).
97.8% of residents of 18660 zip code speak English at home.
0.5% of residents speak Spanish at home (100% very well).
0.5% of residents speak other Indo-European language at home (100% very well).
0.6% of residents speak other language at home (84% very well, 16% not well).
Foreign born population: 23 (0.7%) (48.8% of them are naturalized citizens)
This zip code:
0.7%
Whole state:
7.5%
48%North Macedonia (Macedonia)
9%France
9%El Salvador
26%German
18%Polish
13%Irish
10%English
5%Pennsylvania German
5%American
4%Italian
Year of entry for the foreign-born population
02010 or later
22000 to 2009
01990 to 1999
18Before 1990
Housing units lacking complete plumbing facilities: 3.8% Housing units lacking complete kitchen facilities: 1.4%
36.0%Fuel oil, kerosene, etc.
20.3%Electricity
18.2%Bottled, tank, or LP gas
11.7%Coal or coke
11.4%Wood
2.0%Utility gas
0.6%No fuel used
Population in 1990: 1,198. Population change in the 1990s: +2,158 (+180.1%).
Place of birth for U.S.-born residents:
This state: 2,790
Northeast: 302
Midwest: 82
South: 92
West: 21
80% of the 18660 zip code residents lived in the same house 5 years ago. Out of people who lived in different houses, 75% lived in this county. Out of people who lived in different counties, 50% lived in Pennsylvania.
98% of the 18660 zip code residents lived in the same house 1 year ago. Out of people who lived in different houses, 87% moved from this county. Out of people who lived in different houses, 7% moved from different county within same state. Out of people who lived in different houses, 20% moved from different state.
Private vs. public school enrollment:
Students in private schools in grades 1 to 8 (elementary and middle school): 49
Here:
18.4%
Pennsylvania:
15.7%
Students in private schools in grades 9 to 12 (high school): 3
Here:
2.4%
Pennsylvania:
13.4%
Students in private undergraduate colleges: 14
Here:
17.7%
Pennsylvania:
39.8%
Occupation by median earnings in the past 12 months ($)
82,862Law enforcement workers including supervisors
76,511Health diagnosing and treating practitioners and other technical occupations
75,500Management occupations
73,386Computer and mathematical occupations
72,781Architecture and engineering occupations
63,254Installation, maintenance, and repair occupations
Top industries in this zip code by the number of employees in 2005:
Other Services (except Public Administration): Religious Organizations (10-19 employees: 1 establishment, 1-4 employees: 4 establishments)
Administrative and Support and Waste Management and Remediation Services: Solid Waste Collection (5-9: 1, 1-4: 1)
Construction: New Single-Family Housing Construction (except Operative Builders) (5-9: 1, 1-4: 1)
Administrative and Support and Waste Management and Remediation Services: Janitorial Services (5-9: 1)
Information: Book Publishers (5-9: 1)
Construction: Framing Contractors (5-9: 1)
Other Services (except Public Administration): Commercial and Industrial Machinery and Equipment (except Automotive and Electronic) Repair and Maintenance (5-9: 1)
Wholesale Trade: Petroleum Bulk Stations and Terminals (5-9: 1)
Health Care and Social Assistance: Homes for the Elderly (5-9: 1)
People in group quarters in 2010:
4 people in group homes intended for adults
People in group quarters in 2000:
15 people in other group homes
Home Mortgage Disclosure Act Aggregated Statistics For Year 2009 (Based on 4 partial tracts)
A) FHA, FSA/RHS & VA Home Purchase Loans
B) Conventional Home Purchase Loans
C) Refinancings
D) Home Improvement Loans
E) Loans on Dwellings For 5+ Families
F) Non-occupant Loans on < 5 Family Dwellings (A B C & D)
G) Loans On Manufactured Home Dwelling (A B C & D)
Number
Average Value
Number
Average Value
Number
Average Value
Number
Average Value
Number
Average Value
Number
Average Value
Number
Average Value
LOANS ORIGINATED
17
$110,765
42
$130,249
137
$145,194
41
$30,302
1
$207,350
12
$108,210
6
$78,932
APPLICATIONS APPROVED, NOT ACCEPTED
0
$0
2
$149,290
15
$164,856
1
$14,000
0
$0
2
$81,705
0
$0
APPLICATIONS DENIED
3
$126,350
14
$87,152
63
$145,019
17
$33,209
0
$0
7
$120,094
2
$106,580
APPLICATIONS WITHDRAWN
1
$105,330
3
$87,993
30
$147,460
2
$55,155
0
$0
0
$0
0
$0
FILES CLOSED FOR INCOMPLETENESS
1
$131,870
3
$135,413
9
$181,280
3
$32,660
0
$0
0
$0
0
$0
Aggregated Statistics For Year 2008 (Based on 4 partial tracts)
A) FHA, FSA/RHS & VA Home Purchase Loans
B) Conventional Home Purchase Loans
C) Refinancings
D) Home Improvement Loans
F) Non-occupant Loans on < 5 Family Dwellings (A B C & D)
G) Loans On Manufactured Home Dwelling (A B C & D)
Number
Average Value
Number
Average Value
Number
Average Value
Number
Average Value
Number
Average Value
Number
Average Value
LOANS ORIGINATED
10
$125,232
55
$157,768
91
$117,102
50
$26,450
10
$100,188
7
$45,973
APPLICATIONS APPROVED, NOT ACCEPTED
0
$0
7
$135,993
14
$132,031
9
$39,133
0
$0
1
$32,350
APPLICATIONS DENIED
1
$81,280
9
$78,691
98
$120,541
25
$45,309
3
$61,173
8
$93,165
APPLICATIONS WITHDRAWN
0
$0
6
$160,100
31
$137,842
2
$13,270
2
$38,565
0
$0
FILES CLOSED FOR INCOMPLETENESS
1
$48,930
2
$79,620
7
$103,011
1
$75,480
0
$0
0
$0
Aggregated Statistics For Year 2007 (Based on 4 partial tracts)
A) FHA, FSA/RHS & VA Home Purchase Loans
B) Conventional Home Purchase Loans
C) Refinancings
D) Home Improvement Loans
F) Non-occupant Loans on < 5 Family Dwellings (A B C & D)
G) Loans On Manufactured Home Dwelling (A B C & D)
Number
Average Value
Number
Average Value
Number
Average Value
Number
Average Value
Number
Average Value
Number
Average Value
LOANS ORIGINATED
5
$131,874
80
$143,323
112
$123,156
53
$30,142
10
$149,735
8
$70,540
APPLICATIONS APPROVED, NOT ACCEPTED
1
$144,650
14
$103,051
30
$117,441
8
$41,366
3
$49,973
6
$65,798
APPLICATIONS DENIED
0
$0
16
$102,579
127
$114,915
48
$51,024
7
$105,334
5
$77,300
APPLICATIONS WITHDRAWN
0
$0
6
$121,060
58
$118,867
8
$38,025
3
$91,720
2
$68,840
FILES CLOSED FOR INCOMPLETENESS
0
$0
8
$113,345
19
$165,853
2
$42,715
0
$0
0
$0
Aggregated Statistics For Year 2006 (Based on 4 partial tracts)
A) FHA, FSA/RHS & VA Home Purchase Loans
B) Conventional Home Purchase Loans
C) Refinancings
D) Home Improvement Loans
F) Non-occupant Loans on < 5 Family Dwellings (A B C & D)
G) Loans On Manufactured Home Dwelling (A B C & D)
Number
Average Value
Number
Average Value
Number
Average Value
Number
Average Value
Number
Average Value
Number
Average Value
LOANS ORIGINATED
6
$112,645
104
$144,849
124
$92,277
63
$45,380
10
$96,691
6
$51,735
APPLICATIONS APPROVED, NOT ACCEPTED
0
$0
18
$146,456
32
$97,074
8
$26,204
2
$42,715
6
$53,635
APPLICATIONS DENIED
1
$85,430
17
$141,936
139
$108,725
44
$48,276
7
$111,740
6
$43,405
APPLICATIONS WITHDRAWN
2
$74,230
9
$101,979
93
$115,396
6
$47,933
3
$87,783
1
$100,360
FILES CLOSED FOR INCOMPLETENESS
0
$0
6
$96,600
19
$121,178
0
$0
0
$0
1
$75,480
Aggregated Statistics For Year 2005 (Based on 4 partial tracts)
A) FHA, FSA/RHS & VA Home Purchase Loans
B) Conventional Home Purchase Loans
C) Refinancings
D) Home Improvement Loans
F) Non-occupant Loans on < 5 Family Dwellings (A B C & D)
G) Loans On Manufactured Home Dwelling (A B C & D)
Number
Average Value
Number
Average Value
Number
Average Value
Number
Average Value
Number
Average Value
Number
Average Value
LOANS ORIGINATED
5
$111,306
98
$116,411
135
$103,045
70
$42,881
12
$84,665
8
$58,162
APPLICATIONS APPROVED, NOT ACCEPTED
2
$72,575
8
$109,852
33
$95,120
5
$31,520
2
$251,965
2
$37,740
APPLICATIONS DENIED
0
$0
21
$62,621
156
$107,405
44
$31,162
11
$50,367
7
$34,124
APPLICATIONS WITHDRAWN
1
$95,380
17
$111,231
77
$120,290
8
$130,685
5
$83,108
0
$0
FILES CLOSED FOR INCOMPLETENESS
0
$0
3
$70,223
13
$163,911
2
$22,085
2
$67,760
0
$0
Aggregated Statistics For Year 2004 (Based on 4 partial tracts)
A) FHA, FSA/RHS & VA Home Purchase Loans
B) Conventional Home Purchase Loans
C) Refinancings
D) Home Improvement Loans
E) Loans on Dwellings For 5+ Families
F) Non-occupant Loans on < 5 Family Dwellings (A B C & D)
G) Loans On Manufactured Home Dwelling (A B C & D)
Number
Average Value
Number
Average Value
Number
Average Value
Number
Average Value
Number
Average Value
Number
Average Value
Number
Average Value
LOANS ORIGINATED
4
$95,670
82
$107,094
201
$97,479
61
$21,301
2
$115,185
15
$62,360
7
$28,081
APPLICATIONS APPROVED, NOT ACCEPTED
2
$78,795
10
$126,224
49
$79,214
6
$27,803
0
$0
3
$72,647
2
$56,040
APPLICATIONS DENIED
1
$62,210
24
$71,754
134
$127,277
36
$35,920
0
$0
12
$63,034
6
$42,922
APPLICATIONS WITHDRAWN
3
$109,457
9
$129,676
84
$101,084
9
$61,931
0
$0
1
$83,990
4
$78,378
FILES CLOSED FOR INCOMPLETENESS
0
$0
4
$93,308
12
$127,461
2
$12,440
0
$0
0
$0
0
$0
Aggregated Statistics For Year 2003 (Based on 4 partial tracts)
A) FHA, FSA/RHS & VA Home Purchase Loans
B) Conventional Home Purchase Loans
C) Refinancings
D) Home Improvement Loans
F) Non-occupant Loans on < 5 Family Dwellings (A B C & D)
Number
Average Value
Number
Average Value
Number
Average Value
Number
Average Value
Number
Average Value
LOANS ORIGINATED
7
$114,254
66
$118,210
315
$97,680
53
$32,982
22
$59,715
APPLICATIONS APPROVED, NOT ACCEPTED
0
$0
8
$91,872
60
$92,628
9
$35,423
0
$0
APPLICATIONS DENIED
1
$70,500
14
$88,571
132
$92,446
38
$33,893
11
$26,109
APPLICATIONS WITHDRAWN
0
$0
8
$70,579
87
$94,427
4
$23,070
0
$0
FILES CLOSED FOR INCOMPLETENESS
0
$0
3
$47,867
6
$84,737
2
$99,945
0
$0
Aggregated Statistics For Year 2002 (Based on 4 partial tracts)
A) FHA, FSA/RHS & VA Home Purchase Loans
B) Conventional Home Purchase Loans
C) Refinancings
D) Home Improvement Loans
F) Non-occupant Loans on < 5 Family Dwellings (A B C & D)
Number
Average Value
Number
Average Value
Number
Average Value
Number
Average Value
Number
Average Value
LOANS ORIGINATED
3
$45,033
30
$112,460
132
$82,615
17
$35,392
3
$50,460
APPLICATIONS APPROVED, NOT ACCEPTED
0
$0
5
$133,238
30
$80,788
6
$39,588
1
$53,910
APPLICATIONS DENIED
1
$65,520
11
$98,271
77
$85,026
12
$30,724
5
$122,178
APPLICATIONS WITHDRAWN
0
$0
2
$88,185
45
$88,172
3
$37,707
0
$0
FILES CLOSED FOR INCOMPLETENESS
0
$0
0
$0
4
$125,612
0
$0
0
$0
Aggregated Statistics For Year 2001 (Based on 4 partial tracts)
A) FHA, FSA/RHS & VA Home Purchase Loans
B) Conventional Home Purchase Loans
C) Refinancings
D) Home Improvement Loans
F) Non-occupant Loans on < 5 Family Dwellings (A B C & D)
Number
Average Value
Number
Average Value
Number
Average Value
Number
Average Value
Number
Average Value
LOANS ORIGINATED
3
$96,730
30
$92,779
94
$77,305
24
$17,562
6
$93,905
APPLICATIONS APPROVED, NOT ACCEPTED
0
$0
9
$54,790
25
$57,751
3
$61,210
1
$88,650
APPLICATIONS DENIED
0
$0
10
$39,295
63
$64,574
14
$23,898
1
$29,030
APPLICATIONS WITHDRAWN
0
$0
4
$111,775
40
$84,891
0
$0
1
$43,130
FILES CLOSED FOR INCOMPLETENESS
0
$0
0
$0
4
$105,472
1
$9,330
0
$0
Aggregated Statistics For Year 2000 (Based on 4 partial tracts)
A) FHA, FSA/RHS & VA Home Purchase Loans
B) Conventional Home Purchase Loans
C) Refinancings
D) Home Improvement Loans
F) Non-occupant Loans on < 5 Family Dwellings (A B C & D)
Number
Average Value
Number
Average Value
Number
Average Value
Number
Average Value
Number
Average Value
LOANS ORIGINATED
9
$83,133
54
$86,376
46
$74,857
30
$25,060
6
$56,385
APPLICATIONS APPROVED, NOT ACCEPTED
2
$72,160
5
$102,008
15
$54,178
4
$38,025
0
$0
APPLICATIONS DENIED
0
$0
10
$54,258
51
$60,357
12
$20,589
4
$48,935
APPLICATIONS WITHDRAWN
1
$74,650
8
$65,928
37
$65,044
2
$49,765
1
$51,330
FILES CLOSED FOR INCOMPLETENESS
0
$0
0
$0
7
$58,059
0
$0
0
$0
Aggregated Statistics For Year 1999 (Based on 3 partial tracts)
A) FHA, FSA/RHS & VA Home Purchase Loans
B) Conventional Home Purchase Loans
C) Refinancings
D) Home Improvement Loans
F) Non-occupant Loans on < 5 Family Dwellings (A B C & D)


 Nearest zip codes: 18617, 18222, 18251, 18634, 18219, 18249.


