Estimated zip code population in 2022: 5,473 Zip code population in 2010: 4,900 Zip code population in 2000: 3,416
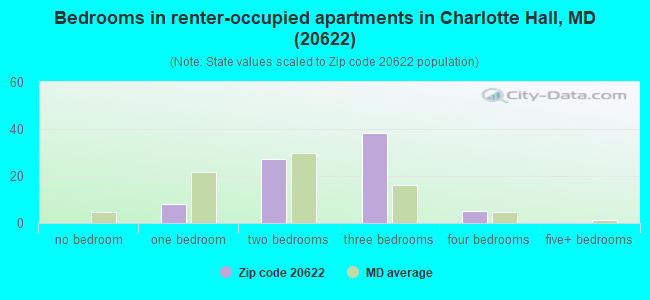
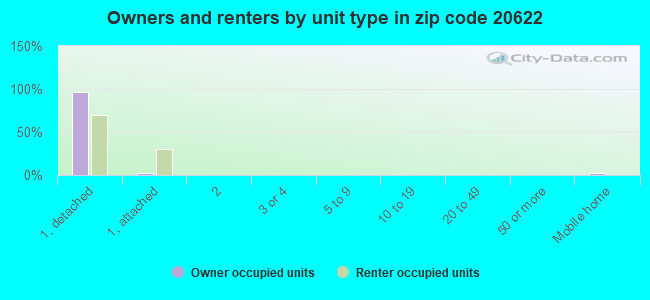
Houses and condos: 1,466 Renter-occupied apartments: 80
% of renters here:
5%
State:
32%
March 2022 cost of living index in zip code 20622: 135.4 (high, U.S. average is 100)
Land area: 37.4 sq. mi. Water area: 0.6 sq. mi.
Population density: 146 people per square mile
(very low).
OSM Map
General Map
Google Map
MSN Map
OSM Map
General Map
Google Map
MSN Map
OSM Map
General Map
Google Map
MSN Map
OSM Map
General Map
Google Map
MSN Map
Please wait while loading the map...
Real estate property taxes paid for housing units in 2022:
This zip code:
1.0% ($4,151)
Maryland:
0.9% ($3,777)
Median real estate property taxes paid for housing units with mortgages in 2022: $5,030 (1.0%) Median real estate property taxes paid for housing units with no mortgage in 2022: $3,542 (1.0%)
Averages for the 2020 tax year for zip code 20622, filed in 2021:
Average Adjusted Gross Income (AGI) in 2020: $85,182 (Individual Income Tax Returns)
Here:
$85,182
State:
$86,905
Salary/wage: $77,534 (reported on 80.1% of returns)
Here:
$77,534
State:
$73,953
(% of AGI for various income ranges: 1189.7% for AGIs below $25k, 3737.3% for AGIs $25k-50k, 6196.2% for AGIs $50k-75k, 9530.0% for AGIs $75k-100k, 18528.5% for AGIs $100k-200k, 60538.3% for AGIs over 200k)
Taxable interest for individuals: $1,013 (reported on 42.0% of returns)
This zip code:
$1,013
Maryland:
$1,528
(% of AGI for various income ranges: 12.6% for AGIs below $25k, 29.7% for AGIs $25k-50k, 56.2% for AGIs $50k-75k, 73.8% for AGIs $75k-100k, 115.5% for AGIs $100k-200k, 351.7% for AGIs over 200k)
Ordinary dividends: $3,022 (reported on 16.0% of returns)
Here:
$3,022
State:
$8,028
(% of AGI for various income ranges: 11.8% for AGIs below $25k, 18.7% for AGIs $25k-50k, 20.4% for AGIs $50k-75k, 86.2% for AGIs $75k-100k, 117.9% for AGIs $100k-200k, 733.3% for AGIs over 200k)
Net capital gain/loss in AGI: +$14,803 (reported on 14.3% of returns)
Here:
+$14,803
State:
+$25,238
(% of AGI for various income ranges: 15.9% for AGIs below $25k, 28.3% for AGIs $25k-50k, 86.2% for AGIs $50k-75k, 94.4% for AGIs $75k-100k, 333.3% for AGIs $100k-200k, 5466.7% for AGIs over 200k)
Profit/loss from business: +$12,421 (reported on 18.6% of returns)
Here:
+$12,421
State:
+$11,398
(% of AGI for various income ranges: 178.2% for AGIs below $25k, 296.3% for AGIs $25k-50k, 71.7% for AGIs $50k-75k, 312.5% for AGIs $75k-100k, 287.0% for AGIs $100k-200k, 3563.3% for AGIs over 200k)
Taxable individual retirement arrangement distribution: $16,276 (reported on 7.4% of returns)
20622:
$16,276
Maryland:
$20,944
(% of AGI for various income ranges: 33.8% for AGIs below $25k, 72.0% for AGIs $25k-50k, 183.3% for AGIs $50k-75k, 255.6% for AGIs $75k-100k, 475.8% for AGIs $100k-200k)
Total itemized deductions: $30,264 (reported on 25.5% of returns)
Here:
$30,264
State:
$30,672
(% of AGI for various income ranges: 111.8% for AGIs below $25k, 315.0% for AGIs $25k-50k, 797.9% for AGIs $50k-75k, 1294.4% for AGIs $75k-100k, 2177.0% for AGIs $100k-200k, 8841.7% for AGIs over 200k)
Charity contributions: $6,298 (reported on 21.2% of returns)
Here:
$6,298
State:
$9,065
(% of AGI for various income ranges: 48.0% for AGIs $25k-50k, 112.1% for AGIs $50k-75k, 167.5% for AGIs $75k-100k, 414.5% for AGIs $100k-200k, 1728.3% for AGIs over 200k)
Taxes paid: $8,607 (reported on 25.5% of returns)
20622:
$8,607
State:
$8,475
(% of AGI for various income ranges: 19.0% for AGIs below $25k, 63.7% for AGIs $25k-50k, 237.9% for AGIs $50k-75k, 460.6% for AGIs $75k-100k, 734.2% for AGIs $100k-200k, 1803.3% for AGIs over 200k)
Earned income credit: $2,068 (reported on 8.2% of returns)
Here:
$2,068
State:
$2,151
(% of AGI for various income ranges: 65.6% for AGIs below $25k, 45.7% for AGIs $25k-50k)
Percentage of individuals using paid preparers for their 2020 taxes: 89.2%
Here:
89%
State:
90%
(% for various income ranges: 87.5% for AGIs below $25k, 88.4% for AGIs $25k-50k, 90.9% for AGIs $50k-75k, 88.0% for AGIs $75k-100k, 89.3% for AGIs $100k-200k, 94.4% for AGIs over 200k)
Averages for the 2012 tax year for zip code 20622, filed in 2013:
Average Adjusted Gross Income (AGI) in 2012: $68,066 (Individual Income Tax Returns)
Here:
$68,066
State:
$72,703
Salary/wage: $62,359 (reported on 81.9% of returns)
Here:
$62,359
State:
$62,228
(% of AGI for various income ranges: 68.5% for AGIs below $25k, 67.9% for AGIs $25k-50k, 70.7% for AGIs $50k-75k, 75.1% for AGIs $75k-100k, 82.1% for AGIs $100k-200k, 66.1% for AGIs over 200k)
Taxable interest for individuals: $921 (reported on 44.8% of returns)
This zip code:
$921
Maryland:
$1,413
(% of AGI for various income ranges: 1.4% for AGIs below $25k, 0.9% for AGIs $25k-50k, 0.5% for AGIs $50k-75k, 0.5% for AGIs $75k-100k, 0.5% for AGIs $100k-200k, 0.7% for AGIs over 200k)
Ordinary dividends: $1,676 (reported on 17.2% of returns)
Here:
$1,676
State:
$6,933
(% of AGI for various income ranges: 0.8% for AGIs below $25k, 0.8% for AGIs $25k-50k, 0.4% for AGIs $50k-75k, 0.4% for AGIs $75k-100k, 0.3% for AGIs $100k-200k, 0.4% for AGIs over 200k)
Net capital gain/loss in AGI: +$7,781 (reported on 12.2% of returns)
Here:
+$7,781
State:
+$14,830
(% of AGI for various income ranges: 0.2% for AGIs $25k-50k, 0.3% for AGIs $100k-200k, 8.4% for AGIs over 200k)
Profit/loss from business: +$9,583 (reported on 15.8% of returns)
Here:
+$9,583
State:
+$12,606
(% of AGI for various income ranges: 7.9% for AGIs below $25k, 4.4% for AGIs $25k-50k, 3.1% for AGIs $50k-75k, 0.7% for AGIs $75k-100k, 1.9% for AGIs $100k-200k)
Taxable individual retirement arrangement distribution: $11,921 (reported on 8.6% of returns)
20622:
$11,921
Maryland:
$17,065
(% of AGI for various income ranges: 1.6% for AGIs below $25k, 2.7% for AGIs $25k-50k, 2.3% for AGIs $50k-75k, 1.5% for AGIs $75k-100k, 1.5% for AGIs $100k-200k)
Total itemized deductions: $26,760 (25% of AGI, reported on 51.1% of returns)
Here:
$26,760
State:
$27,886
Here:
25.4% of AGI
State:
22.8% of AGI
(% of AGI for various income ranges: 16.3% for AGIs below $25k, 16.3% for AGIs $25k-50k, 20.2% for AGIs $50k-75k, 23.3% for AGIs $75k-100k, 21.0% for AGIs $100k-200k, 18.9% for AGIs over 200k)
Charity contributions: $2,909 (reported on 43.4% of returns)
Here:
$2,909
State:
$4,452
(% of AGI for various income ranges: 1.3% for AGIs below $25k, 1.5% for AGIs $25k-50k, 2.0% for AGIs $50k-75k, 2.1% for AGIs $75k-100k, 2.0% for AGIs $100k-200k, 1.5% for AGIs over 200k)
Taxes paid: $10,562 (reported on 50.7% of returns)
20622:
$10,562
State:
$11,690
(% of AGI for various income ranges: 2.5% for AGIs below $25k, 4.2% for AGIs $25k-50k, 6.7% for AGIs $50k-75k, 7.9% for AGIs $75k-100k, 9.3% for AGIs $100k-200k, 9.5% for AGIs over 200k)
Earned income credit: $1,948 (reported on 9.5% of returns)
Here:
$1,948
State:
$2,199
(% of AGI for various income ranges: 3.7% for AGIs below $25k, 0.7% for AGIs $25k-50k)
Percentage of individuals using paid preparers for their 2012 taxes: 57.5%
Here:
57%
State:
52%
(% for various income ranges: 49.3% for AGIs below $25k, 56.5% for AGIs $25k-50k, 62.5% for AGIs $50k-75k, 66.7% for AGIs $75k-100k, 61.7% for AGIs $100k-200k, 62.5% for AGIs over 200k)
Averages for the 2004 tax year for zip code 20622, filed in 2005:
Average Adjusted Gross Income (AGI) in 2004: $58,863 (Individual Income Tax Returns)
Here:
$58,863
State:
$60,339
Salary/wage: $52,465 (reported on 85.0% of returns)
Here:
$52,465
State:
$52,211
(% of AGI for various income ranges: 106.7% for AGIs below $10k, 66.2% for AGIs $10k-25k, 77.6% for AGIs $25k-50k, 79.1% for AGIs $50k-75k, 86.0% for AGIs $75k-100k, 70.6% for AGIs over 100k)
Taxable interest for individuals: $1,366 (reported on 55.7% of returns)
This zip code:
$1,366
Maryland:
$1,701
(% of AGI for various income ranges: 7.2% for AGIs below $10k, 2.2% for AGIs $10k-25k, 1.5% for AGIs $25k-50k, 1.0% for AGIs $50k-75k, 0.7% for AGIs $75k-100k, 1.4% for AGIs over 100k)
Taxable dividends: $1,391 (reported on 19.7% of returns)
Here:
$1,391
State:
$4,235
(% of AGI for various income ranges: 0.8% for AGIs below $10k, 0.8% for AGIs $10k-25k, 0.4% for AGIs $25k-50k, 0.4% for AGIs $50k-75k, 0.4% for AGIs $75k-100k, 0.5% for AGIs over 100k)
Net capital gain/loss: +$13,799 (reported on 15.4% of returns)
Here:
+$13,799
State:
+$15,888
(% of AGI for various income ranges: -0.8% for AGIs below $10k, 1.0% for AGIs $10k-25k, 0.0% for AGIs $25k-50k, 0.9% for AGIs $50k-75k, 1.1% for AGIs $75k-100k, 6.9% for AGIs over 100k)
Profit/loss from business: +$8,517 (reported on 15.7% of returns)
Here:
+$8,517
State:
+$12,221
(% of AGI for various income ranges: 11.3% for AGIs below $10k, 7.7% for AGIs $10k-25k, 3.7% for AGIs $25k-50k, 2.5% for AGIs $50k-75k, 1.3% for AGIs $75k-100k, 1.3% for AGIs over 100k)
IRA payment deduction: $3,359 (reported on 3.0% of returns)
20622:
$3,359
Maryland:
$2,968
(% of AGI for various income ranges: 0.3% for AGIs $25k-50k, 0.3% for AGIs $50k-75k, 0.2% for AGIs $75k-100k, 0.1% for AGIs over 100k)
Total itemized deductions: $22,463 (25% of AGI, reported on 53.1% of returns)
Here:
$22,463
State:
$22,960
Here:
24.7% of AGI
State:
23.3% of AGI
(% of AGI for various income ranges: 32.9% for AGIs below $10k, 13.5% for AGIs $10k-25k, 18.9% for AGIs $25k-50k, 22.0% for AGIs $50k-75k, 23.6% for AGIs $75k-100k, 19.3% for AGIs over 100k)
Charity contributions deductions: $2,974 (3% of AGI, reported on 48.4% of returns)
Here:
$2,974
State:
$4,031
Here:
3.2% of AGI
State:
3.9% of AGI
(% of AGI for various income ranges: 1.6% for AGIs below $10k, 1.4% for AGIs $10k-25k, 2.1% for AGIs $25k-50k, 2.6% for AGIs $50k-75k, 2.4% for AGIs $75k-100k, 2.6% for AGIs over 100k)
Total tax: $8,051 (reported on 81.5% of returns)
20622:
$8,051
State:
$10,167
(% of AGI for various income ranges: 3.3% for AGIs below $10k, 4.3% for AGIs $10k-25k, 7.2% for AGIs $25k-50k, 8.4% for AGIs $50k-75k, 8.8% for AGIs $75k-100k, 15.1% for AGIs over 100k)
Earned income credit: $1,631 (reported on 8.4% of returns)
Here:
$1,631
State:
$1,700
Percentage of individuals using paid preparers for their 2004 taxes: 60.7%
Here:
61%
State:
55%
(% for various income ranges: 48.9% for AGIs below $10k, 58.1% for AGIs $10k-25k, 63.0% for AGIs $25k-50k, 67.0% for AGIs $50k-75k, 59.1% for AGIs $75k-100k, 66.8% for AGIs over 100k)
Household received Food Stamps/SNAP in the past 12 months: 82 Household did not receive Food Stamps/SNAP in the past 12 months: 1,383
Women who had a birth in the past 12 months: 65 (36 now married, 29 unmarried) Women who did not have a birth in the past 12 months: 969 (459 now married, 509 unmarried)
Housing units in zip code 20622 with a mortgage: 932 (156 second mortgage, 132 both second mortgage and home equity loan) Median monthly owner costs for units with a mortgage: $2,361 Median monthly owner costs for units without a mortgage: $808
Residents with income below the poverty level in 2022:
This zip code:
4.5%
Whole state:
9.6%
Residents with income below 50% of the poverty level in 2022:
This zip code:
1.5%
Whole state:
4.7%
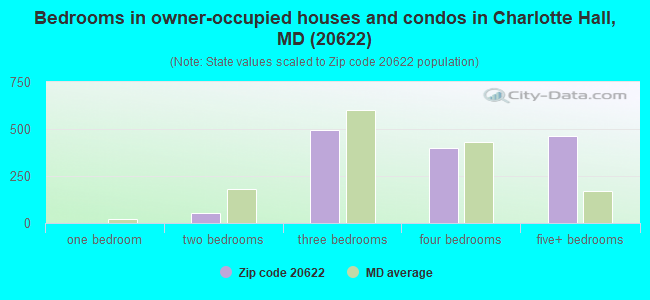
Median number of rooms in houses and condos:
Here:
7.8
State:
7.3
Median number of rooms in apartments:
Here:
4.8
State:
4.2
Notable locations in this zip code not listed on our city pages
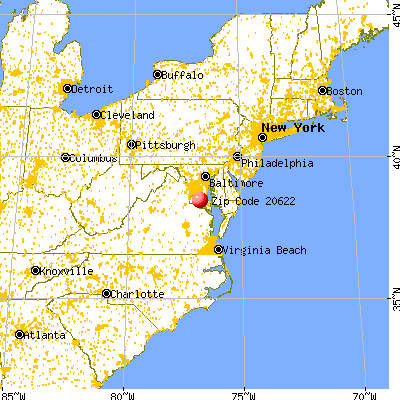
Notable locations in zip code 20622: Dyson Bridge (A), Brim Farm (B), Charlotte Hall Water Treatment Plant (C), Southern Maryland Public Works Camp (D), Olde Oak Farm (E), Saint Mary's County Library - Charlotte Hall Branch (F). Display/hide their locations on the map
Reservoirs and swamps: Gilbert Run Reservoir Site Number 1 (A), Wheatley Reservoir (B), Smoots Pond (C), Newport Marsh (D). Display/hide their locations on the map
Streams, rivers, and creeks: Budds Creek (A), Burroughs Run (B), Oden Run (C), Oaks Run (D), Trinity Church Run (E), Saint Stephen Run (F), Denton Run (G), Newport Branch (H), Murphy Run (I). Display/hide their locations on the map
In group quarters: 430 (-1 institutionalized population)
Size of family households: 289 2-persons, 324 3-persons, 328 4-persons, 146 5-persons, 110 6-persons, 45 7-or-more-persons
Size of nonfamily households: 154 1-person, 56 2-persons
1,031 married couples with children.
64 single-parent households (35 men, 29 women).
87.1% of residents of 20622 zip code speak English at home.
2.7% of residents speak Spanish at home (80% very well, 20% well).
6.9% of residents speak other Indo-European language at home (46% very well, 39% well, 15% not well).
2.2% of residents speak Asian or Pacific Island language at home (100% very well).
0.8% of residents speak other language at home (100% very well).
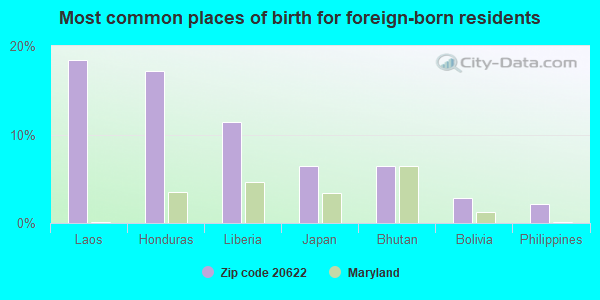
Foreign born population: 325 (5.9%) (67.7% of them are naturalized citizens)
This zip code:
5.9%
Whole state:
16.7%
18%Laos
17%Honduras
11%Liberia
6%Japan
6%Bhutan
3%Bolivia
2%Philippines
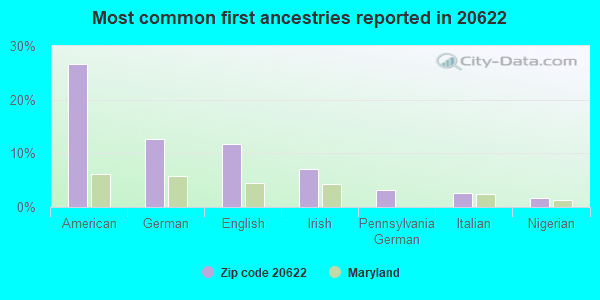
27%American
13%German
12%English
7%Irish
3%Pennsylvania German
3%Italian
2%Nigerian
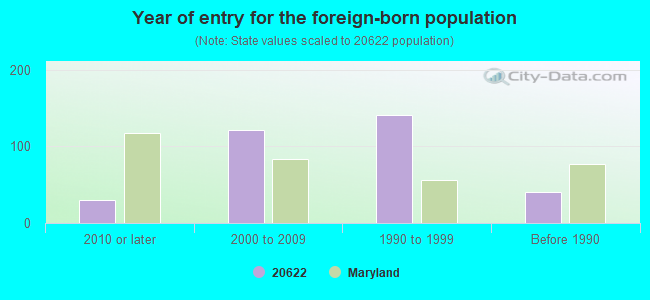
Year of entry for the foreign-born population
302010 or later
1222000 to 2009
1411990 to 1999
41Before 1990
Facilities with environmental interests located in this zip code:
7 ELEVEN 21067 (RTE 5 NEAR GOLDEN BEACH RD in CHARLOTTE HALL, MD)
AIR MINOR (AIRS/AFS) STATE MASTER (Maryland Air Emissions Database) - AIR MINOR Small Quantity Generators, between 100 kg and 1000 kg of hazardous waste/month (Resource Conservation and Recovery Act (tracking hazardous waste)) - notification Business SIC classification: GROCERY STORES Organizations: THE SOUTHLAND CORP (CONTACT/OWNER)
Alternative names: 7-11 STORE - RT 5 & GOLDEN BEACH RD
B & B COLONIAL CLEANERS (86B MOHAWK DRIVE in CHARLOTTE HALL, MD)
AIR MINOR (AIRS/AFS) Business SIC classification: DRYCLEANING PLANTS, EXCEPT RUG CLEANING
C.A. BEAN INC. (HOWLIN INDUSTRIAL PK in CHARLOTTE HALL, MD)
AIR MINOR (AIRS/AFS) Business SIC classification: ASPHALT PAVING MIXTURES AND BLOCKS
CLARK'S FEED & GRAIN (ROUTE 5 in CHARLOTTE HALL, MD)
AIR MINOR (AIRS/AFS) Business SIC classification: CROP PREPARATION SERVICES FOR MARKET, EXCEPT COTTON GINNING
COLONIAL CLEANERS (RT 5 & MOWHAWK DR in CHARLOTTE HALL, MD)
Conditionally Exempt Small Quantity Generators, less than 100 kg/month of hazardous waste (Resource Conservation and Recovery Act (tracking hazardous waste)) - notification Organizations: OPERNAME (CONTACT/OPERATOR)
, BOHANNON, HARVEY (CONTACT/OWNER)
M & J COACHWORK (POTOMAC WAY in CHARLOTTE HALL, MD)
Small Quantity Generators, between 100 kg and 1000 kg of hazardous waste/month (Resource Conservation and Recovery Act (tracking hazardous waste)) - notification Organizations: OPERNAME (CONTACT/OPERATOR)
, SCHIAVONE, JOSEPH (CONTACT/OWNER)
BEAN, C.A. - HOWLIN INDUSTRIAL PARK (HOWLIN INDUSTRIAL PARK in CHARLOTTE HALL, MD)
CRITERIA AND HAZARDOUS AIR POLLUTANT INVENTORY (Inventory of air pollution sources) Business SIC classification: ASPHALT PAVING MIXTURES AND BLOCKS Business NAICS classification: ASPHALT PAVING MIXTURE AND BLOCK MANUFACTURING.
Housing units lacking complete plumbing facilities: 1.9% Housing units lacking complete kitchen facilities: 1.6%
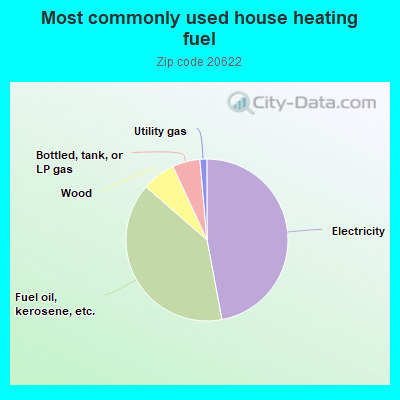
47.1%Electricity
39.4%Fuel oil, kerosene, etc.
6.7%Wood
5.5%Bottled, tank, or LP gas
1.4%Utility gas
Population in 1990: 3,454.
Place of birth for U.S.-born residents:
This state: 2,865
Northeast: 333
Midwest: 391
South: 1,177
West: 316
69% of the 20622 zip code residents lived in the same house 5 years ago. Out of people who lived in different houses, 37% lived in this county. Out of people who lived in different counties, 50% lived in Maryland.
94% of the 20622 zip code residents lived in the same house 1 year ago. Out of people who lived in different houses, 39% moved from this county. Out of people who lived in different houses, 54% moved from different county within same state. Out of people who lived in different houses, 14% moved from different state.
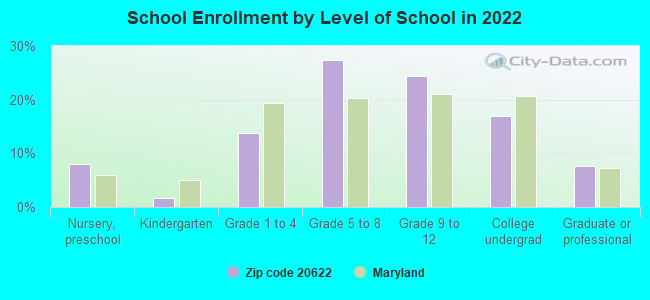
Private vs. public school enrollment:
Students in private schools in grades 1 to 8 (elementary and middle school): 117
Here:
20.0%
Maryland:
15.2%
Students in private schools in grades 9 to 12 (high school): 43
Here:
12.7%
Maryland:
14.4%
Students in private undergraduate colleges: 69
Here:
29.0%
Maryland:
20.2%
Occupation by median earnings in the past 12 months ($)
133,781Law enforcement workers including supervisors
111,579Computer and mathematical occupations
110,127Business and financial operations occupations
102,628Management occupations
98,816Personal care and service occupations
84,848Health diagnosing and treating practitioners and other technical occupations
Companies with federal contracts located in this zip code (CHARLOTTE HALL, MD):
21ST CENTURY BUSINESS CONSULTA (10100 ODEN RUN PLACE; small business) : $907,766 in 10 contractsfrom 2001 to 2005
Contracts for Other Management Support Services, Accounting Services (NOTE: New code created for Financial Services See R710 below), ADP Support Equipment by Navy, Department of Defense Signed by year:2000: $0; 2001: $81,386; 2002: $20,000; 2003: $625,380; 2004: $0; 2005: $181,000; 2006: $0.
Biggest contracts:
$485,437 with Navy for Other Management Support Services. Signed on 2003-12-18. Completion date: 2004-12-17.
$181,000, same as above.Signed on 2005-06-29. Completion date: 2006-12-31.
$138,210 with Navy for Accounting Services (NOTE: New code created for Financial Services See R710 below). Signed on 2003-03-18. Completion date: 2003-10-31.
$49,274 with Department of Defense for ADP Support Equipment. Signed on 2001-10-11. Completion date: 2002-10-11.
APPLEJACK CANINE ACADEMY & KEN (14655 CHARLES ST; small business)
$351,900 with Department of Defense for Miscellaneous Alarm, Signal and Security Detection Systems. Taking place in DC. Signed on 2002-07-19. Completion date: 2007-07-18.
AMADIS INC (10590 NEWPORT CHURCH RD; small business) : $60,000 in 2 contractsin 2001
$60,000 with Navy for Engineering and Technical Services. Signed on 2001-09-27. Completion date: 2002-08-31.
$0, same as above.Signed on 2001-09-27. Completion date: 2002-08-31.
MICHAEL DAVIS (37974 MOHAWK DR; small business)
$6,000 with Air Force for Other Social Services. Taking place in TX. Signed on 2004-10-01. Completion date: 2005-01-31.
SIGNS OF SIGHT OF MARYLAND (14075 BON HAMBURG PL; small business) 2 employees, $99000 revenue.
$3,502 with Federal Supply Service for Office Furniture. Signed on 2003-09-15. Completion date: 2003-10-15.
Top industries in this zip code by the number of employees in 2005:
Health Care and Social Assistance: Nursing Care Facilities (250-499 employees: 1 establishment)
Accommodation and Food Services: Limited-Service Restaurants (50-99: 1, 20-49: 5)
Accommodation and Food Services: Full-Service Restaurants (50-99: 2, 1-4: 2)
Construction: Site Preparation Contractors (20-49: 2, 1-4: 1)
Health Care and Social Assistance: Other Individual and Family Services (20-49: 1, 10-19: 1)
Other Services (except Public Administration): Beauty Salons (10-19: 2, 5-9: 2)
Wholesale Trade: Motor Vehicle Supplies and New Parts Merchant Wholesalers (20-49: 1, 5-9: 1)
People in group quarters in 2010:
404 people in nursing facilities/skilled-nursing facilities
174 people in correctional residential facilities
10 people in residential treatment centers for adults
People in group quarters in 2000:
321 people in nursing homes
Fatal accident statistics in 2014:
Fatal accident count: 2
Vehicles involved in fatal accidents: 3
Fatal accidents caused by drunken drivers: 1
Fatalities: 2
Persons involved in fatal accidents: 4
Pedestrians involved in fatal accidents: 1
Fatal accident statistics in 2012:
Fatal accident count: 1
Vehicles involved in fatal accidents: 1
Fatal accidents caused by drunken drivers: 0
Fatalities: 1
Persons involved in fatal accidents: 1
Pedestrians involved in fatal accidents: 0
Home Mortgage Disclosure Act Aggregated Statistics For Year 2009 (Based on 2 partial tracts)
A) FHA, FSA/RHS & VA Home Purchase Loans
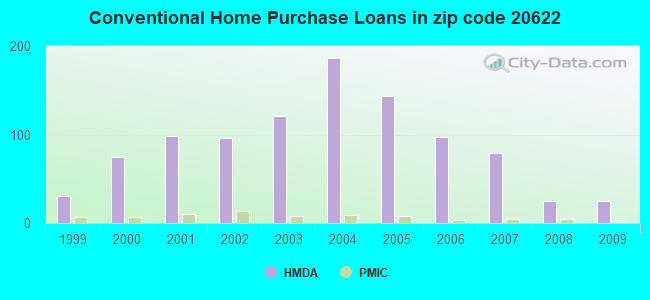
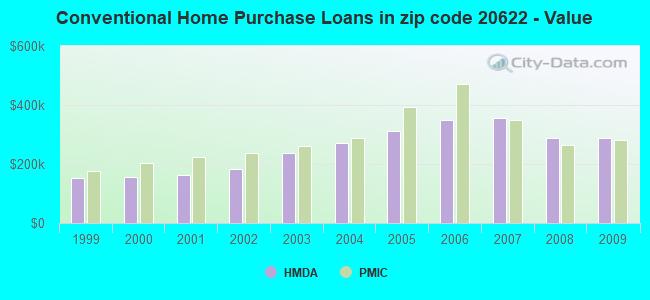
B) Conventional Home Purchase Loans
C) Refinancings
D) Home Improvement Loans
F) Non-occupant Loans on < 5 Family Dwellings (A B C & D)
G) Loans On Manufactured Home Dwelling (A B C & D)
Number
Average Value
Number
Average Value
Number
Average Value
Number
Average Value
Number
Average Value
Number
Average Value
LOANS ORIGINATED
28
$355,850
25
$289,450
279
$280,899
14
$184,416
1
$145,710
0
$0
APPLICATIONS APPROVED, NOT ACCEPTED
1
$430,430
2
$305,910
23
$321,246
1
$26,020
0
$0
0
$0
APPLICATIONS DENIED
1
$753,060
1
$286,210
74
$317,030
5
$89,506
2
$359,435
1
$52,040
APPLICATIONS WITHDRAWN
1
$98,130
7
$316,264
56
$285,758
3
$110,520
3
$309,253
0
$0
FILES CLOSED FOR INCOMPLETENESS
1
$376,900
1
$167,270
19
$323,927
0
$0
0
$0
0
$0
Aggregated Statistics For Year 2008 (Based on 2 partial tracts)
A) FHA, FSA/RHS & VA Home Purchase Loans
B) Conventional Home Purchase Loans
C) Refinancings
D) Home Improvement Loans
F) Non-occupant Loans on < 5 Family Dwellings (A B C & D)
Number
Average Value
Number
Average Value
Number
Average Value
Number
Average Value
Number
Average Value
LOANS ORIGINATED
13
$400,635
25
$287,844
129
$274,349
19
$129,508
4
$266,510
APPLICATIONS APPROVED, NOT ACCEPTED
1
$449,010
1
$230,450
16
$363,151
7
$122,449
0
$0
APPLICATIONS DENIED
1
$648,240
5
$343,450
68
$379,943
13
$178,416
2
$291,415
APPLICATIONS WITHDRAWN
4
$345,310
7
$334,424
51
$319,050
1
$282,490
0
$0
FILES CLOSED FOR INCOMPLETENESS
0
$0
0
$0
10
$411,398
2
$228,965
0
$0
Aggregated Statistics For Year 2007 (Based on 2 partial tracts)
A) FHA, FSA/RHS & VA Home Purchase Loans
B) Conventional Home Purchase Loans
C) Refinancings
D) Home Improvement Loans
F) Non-occupant Loans on < 5 Family Dwellings (A B C & D)
G) Loans On Manufactured Home Dwelling (A B C & D)
Number
Average Value
Number
Average Value
Number
Average Value
Number
Average Value
Number
Average Value
Number
Average Value
LOANS ORIGINATED
0
$0
79
$357,481
203
$296,463
46
$113,676
4
$333,230
0
$0
APPLICATIONS APPROVED, NOT ACCEPTED
0
$0
9
$445,379
33
$320,518
16
$100,498
0
$0
0
$0
APPLICATIONS DENIED
0
$0
11
$297,698
93
$373,187
29
$115,586
2
$204,805
1
$117,460
APPLICATIONS WITHDRAWN
1
$246,070
11
$369,943
37
$374,031
5
$106,454
1
$205,920
0
$0
FILES CLOSED FOR INCOMPLETENESS
0
$0
3
$576,880
15
$313,071
2
$63,190
1
$185,850
0
$0
Aggregated Statistics For Year 2006 (Based on 2 partial tracts)
A) FHA, FSA/RHS & VA Home Purchase Loans
B) Conventional Home Purchase Loans
C) Refinancings
D) Home Improvement Loans
F) Non-occupant Loans on < 5 Family Dwellings (A B C & D)
Number
Average Value
Number
Average Value
Number
Average Value
Number
Average Value
Number
Average Value
LOANS ORIGINATED
2
$343,825
97
$348,555
251
$300,212
44
$125,229
7
$191,266
APPLICATIONS APPROVED, NOT ACCEPTED
0
$0
16
$399,438
38
$250,213
7
$154,946
1
$353,120
APPLICATIONS DENIED
0
$0
25
$365,634
106
$322,425
23
$139,986
4
$310,928
APPLICATIONS WITHDRAWN
0
$0
18
$378,762
93
$325,305
4
$276,172
1
$170,980
FILES CLOSED FOR INCOMPLETENESS
0
$0
1
$247,550
21
$251,730
4
$136,600
1
$264,650
Aggregated Statistics For Year 2005 (Based on 2 partial tracts)
A) FHA, FSA/RHS & VA Home Purchase Loans
B) Conventional Home Purchase Loans
C) Refinancings
D) Home Improvement Loans
F) Non-occupant Loans on < 5 Family Dwellings (A B C & D)
G) Loans On Manufactured Home Dwelling (A B C & D)
Number
Average Value
Number
Average Value
Number
Average Value
Number
Average Value
Number
Average Value
Number
Average Value
LOANS ORIGINATED
1
$428,940
143
$310,434
317
$274,324
50
$97,222
4
$160,760
0
$0
APPLICATIONS APPROVED, NOT ACCEPTED
0
$0
13
$247,552
40
$266,434
9
$93,421
0
$0
1
$22,300
APPLICATIONS DENIED
0
$0
27
$313,797
74
$263,264
18
$153,801
1
$398,460
2
$26,760
APPLICATIONS WITHDRAWN
0
$0
21
$273,005
94
$274,093
11
$187,202
1
$641,550
0
$0
FILES CLOSED FOR INCOMPLETENESS
0
$0
5
$280,410
17
$316,251
5
$58,728
1
$286,210
0
$0
Aggregated Statistics For Year 2004 (Based on 2 partial tracts)
A) FHA, FSA/RHS & VA Home Purchase Loans
B) Conventional Home Purchase Loans
C) Refinancings
D) Home Improvement Loans
F) Non-occupant Loans on < 5 Family Dwellings (A B C & D)
Number
Average Value
Number
Average Value
Number
Average Value
Number
Average Value
Number
Average Value
LOANS ORIGINATED
6
$247,428
186
$269,526
311
$223,214
28
$62,791
5
$146,450
APPLICATIONS APPROVED, NOT ACCEPTED
0
$0
10
$240,193
37
$212,693
6
$27,382
1
$124,150
APPLICATIONS DENIED
0
$0
17
$209,202
68
$223,938
19
$78,878
4
$115,040
APPLICATIONS WITHDRAWN
1
$201,460
20
$241,791
70
$224,719
4
$93,668
1
$37,170
FILES CLOSED FOR INCOMPLETENESS
0
$0
4
$176,742
16
$257,867
1
$23,790
0
$0
Aggregated Statistics For Year 2003 (Based on 2 partial tracts)
A) FHA, FSA/RHS & VA Home Purchase Loans
B) Conventional Home Purchase Loans
C) Refinancings
D) Home Improvement Loans
F) Non-occupant Loans on < 5 Family Dwellings (A B C & D)
Number
Average Value
Number
Average Value
Number
Average Value
Number
Average Value
Number
Average Value
LOANS ORIGINATED
7
$223,444
121
$238,736
573
$184,590
23
$70,655
10
$88,093
APPLICATIONS APPROVED, NOT ACCEPTED
0
$0
7
$201,886
61
$171,274
5
$16,206
1
$53,520
APPLICATIONS DENIED
1
$342,710
4
$363,522
61
$160,477
9
$51,129
1
$156,110
APPLICATIONS WITHDRAWN
3
$135,793
11
$209,976
100
$190,459
0
$0
3
$135,050
FILES CLOSED FOR INCOMPLETENESS
0
$0
1
$533,760
10
$184,958
1
$52,040
0
$0
Aggregated Statistics For Year 2002 (Based on 2 partial tracts)
A) FHA, FSA/RHS & VA Home Purchase Loans
B) Conventional Home Purchase Loans
C) Refinancings
D) Home Improvement Loans
F) Non-occupant Loans on < 5 Family Dwellings (A B C & D)
Number
Average Value
Number
Average Value
Number
Average Value
Number
Average Value
Number
Average Value
LOANS ORIGINATED
14
$182,824
96
$181,606
347
$174,907
23
$25,857
4
$102,590
APPLICATIONS APPROVED, NOT ACCEPTED
1
$139,760
3
$132,573
33
$160,349
4
$34,198
0
$0
APPLICATIONS DENIED
0
$0
5
$141,990
38
$146,000
9
$23,293
0
$0
APPLICATIONS WITHDRAWN
1
$256,470
10
$198,562
48
$170,115
1
$26,020
1
$82,520
FILES CLOSED FOR INCOMPLETENESS
0
$0
2
$197,745
7
$203,267
0
$0
1
$87,720
Aggregated Statistics For Year 2001 (Based on 2 partial tracts)
A) FHA, FSA/RHS & VA Home Purchase Loans
B) Conventional Home Purchase Loans
C) Refinancings
D) Home Improvement Loans
F) Non-occupant Loans on < 5 Family Dwellings (A B C & D)
Number
Average Value
Number
Average Value
Number
Average Value
Number
Average Value
Number
Average Value
LOANS ORIGINATED
28
$192,063
98
$161,591
224
$158,577
33
$28,858
1
$141,990
APPLICATIONS APPROVED, NOT ACCEPTED
0
$0
4
$75,270
23
$132,875
3
$18,587
0
$0
APPLICATIONS DENIED
2
$253,130
7
$131,581
43
$113,360
15
$24,829
3
$76,323
APPLICATIONS WITHDRAWN
1
$141,990
6
$158,840
35
$155,222
4
$20,258
1
$95,160
FILES CLOSED FOR INCOMPLETENESS
0
$0
1
$375,420
9
$141,246
1
$4,460
0
$0
Aggregated Statistics For Year 2000 (Based on 2 partial tracts)
A) FHA, FSA/RHS & VA Home Purchase Loans
B) Conventional Home Purchase Loans
C) Refinancings
D) Home Improvement Loans
F) Non-occupant Loans on < 5 Family Dwellings (A B C & D)
Number
Average Value
Number
Average Value
Number
Average Value
Number
Average Value
Number
Average Value
LOANS ORIGINATED
19
$163,392
75
$157,085
59
$116,827
28
$21,505
1
$158,340
APPLICATIONS APPROVED, NOT ACCEPTED
0
$0
7
$186,487
5
$137,530
2
$14,125
1
$136,790
APPLICATIONS DENIED
1
$87,720
8
$114,484
39
$121,136
9
$43,613
1
$164,290
APPLICATIONS WITHDRAWN
3
$142,733
6
$131,705
23
$101,200
5
$43,266
0
$0
FILES CLOSED FOR INCOMPLETENESS
1
$279,520
2
$299,590
9
$157,766
1
$18,590
0
$0
Aggregated Statistics For Year 1999 (Based on 1 partial tract)
A) FHA, FSA/RHS & VA Home Purchase Loans
B) Conventional Home Purchase Loans
C) Refinancings
D) Home Improvement Loans
F) Non-occupant Loans on < 5 Family Dwellings (A B C & D)
Detailed PMIC statistics for the following Tracts:8513.00
2002 - 2018 National Fire Incident Reporting System (NFIRS) incidents
Based on the data from the years 2002 - 2018 the average number of fire incidents per year is 41. The highest number of reported fires - 67 took place in 2017, and the least - 19 in 2009. The data has a dropping trend.
When looking into fire subcategories, the most incidents belonged to: Structure Fires (54.9%), and Outside Fires (30.8%).
Fire incident types reported to NFIRS in Zip Code 20622


 Nearest zip codes: 20664, 20632, 20611, 20621, 20645, 20617.


 Based on the data from the years 2002 - 2018 the average number of fire incidents per year is 41. The highest number of reported fires - 67 took place in 2017, and the least - 19 in 2009. The data has a dropping trend.
 When looking into fire subcategories, the most incidents belonged to: Structure Fires (54.9%), and Outside Fires (30.8%).