Estimated zip code population in 2022: 677 Zip code population in 2010: 1,056 Zip code population in 2000: 992
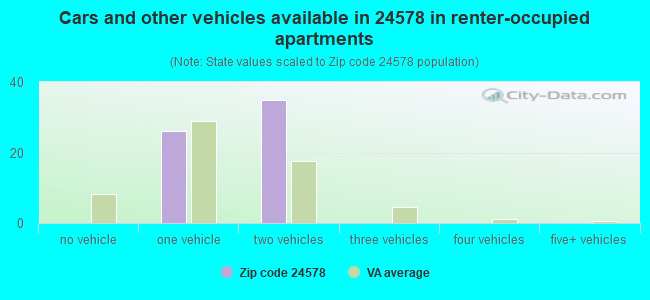
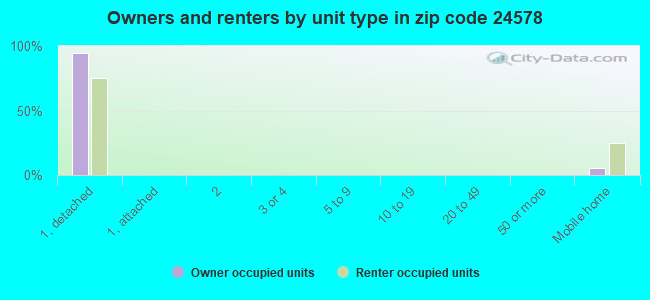
Houses and condos: 345 Renter-occupied apartments: 61
% of renters here:
22%
State:
33%
March 2022 cost of living index in zip code 24578: 83.1 (low, U.S. average is 100)
Land area: 34.8 sq. mi. Water area: 0.0 sq. mi.
Population density: 19 people per square mile
(very low).
OSM Map
General Map
Google Map
MSN Map
OSM Map
General Map
Google Map
MSN Map
OSM Map
General Map
Google Map
MSN Map
OSM Map
General Map
Google Map
MSN Map
Please wait while loading the map...
Real estate property taxes paid for housing units in 2022:
This zip code:
0.6% ($1,083)
Virginia:
0.7% ($2,617)
Median real estate property taxes paid for housing units with mortgages in 2022: $774 (0.5%) Median real estate property taxes paid for housing units with no mortgage in 2022: $1,277 (0.6%)
Business Search- 14 Million verified businesses
Males: 369
(54.5%)
Females: 308
(45.5%)
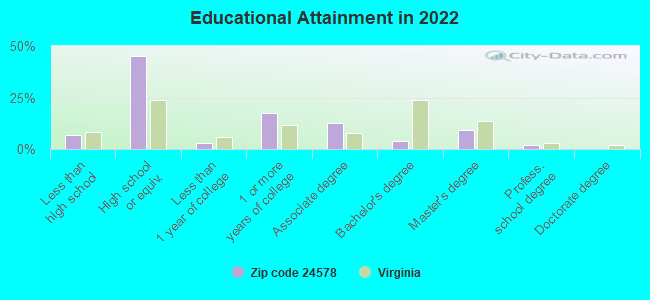
For population 25 years and over in 24578:
High school or higher: 92.2%
Bachelor's degree or higher: 15.2%
Graduate or professional degree: 11.3%
Unemployed: 2.6%
Mean travel time to work (commute): 28.5 minutes
For population 15 years and over in 24578:
Never married: 27.3%
Now married: 62.0%
Separated: 0.0%
Widowed: 2.7%
Divorced: 8.0%
Zip code 24578 compared to state average:
Median household income below state average.
Median house value below state average.
Black race population percentage significantly below state average.
Hispanic race population percentage significantly below state average.
Median age significantly above state average.
Foreign-born population percentage below state average.
Length of stay since moving in significantly above state average.
Number of college students significantly below state average.
Percentage of population with a bachelor's degree or higher significantly below state average.
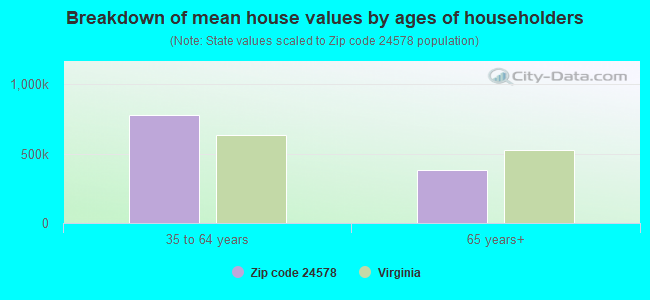
Estimated median house/condo value in 2022: $188,877
24578:
$188,877
Virginia:
$365,700
According to our research of Virginia and other state lists, there was 1 registered sex offender living in 24578 zip code as of May 28, 2024. The ratio of all residents to sex offenders in zip code 24578 is 1,021 to 1. The ratio of registered sex offenders to all residents in this zip code is much lower than the state average.
Median resident age:
This zip code:
48.5 years
Virginia median age:
39.0 years
Average household size:
This zip code:
2.3 people
Virginia:
2.5 people
Averages for the 2020 tax year for zip code 24578, filed in 2021:
Average Adjusted Gross Income (AGI) in 2020: $68,790 (Individual Income Tax Returns)
Here:
$68,790
State:
$86,446
Salary/wage: $45,608 (reported on 78.0% of returns)
Here:
$45,608
State:
$71,185
(% of AGI for various income ranges: 1178.2% for AGIs below $25k, 3240.0% for AGIs $25k-50k, 5950.0% for AGIs $50k-75k, 9290.0% for AGIs $75k-100k, 32850.0% for AGIs $100k-200k)
Taxable interest for individuals: $2,673 (reported on 30.0% of returns)
This zip code:
$2,673
Virginia:
$1,805
(% of AGI for various income ranges: 29.1% for AGIs below $25k, 37.3% for AGIs $25k-50k, 35.0% for AGIs $50k-75k, 1535.0% for AGIs $100k-200k)
Ordinary dividends: $3,364 (reported on 22.0% of returns)
Here:
$3,364
State:
$8,327
(% of AGI for various income ranges: 36.4% for AGIs below $25k, 180.0% for AGIs $50k-75k, 1110.0% for AGIs $100k-200k)
Net capital gain/loss in AGI: +$5,720 (reported on 20.0% of returns)
Here:
+$5,720
State:
+$24,644
(% of AGI for various income ranges: 48.2% for AGIs below $25k, 110.0% for AGIs $50k-75k, 2265.0% for AGIs $100k-200k)
Profit/loss from business: +$4,800 (reported on 14.0% of returns)
Here:
+$4,800
State:
+$12,836
(% of AGI for various income ranges: 261.8% for AGIs below $25k, 80.0% for AGIs $50k-75k)
Taxable individual retirement arrangement distribution: $15,583 (reported on 12.0% of returns)
24578:
$15,583
Virginia:
$21,535
(% of AGI for various income ranges: 286.4% for AGIs below $25k, 2066.7% for AGIs $75k-100k)
Total itemized deductions: $29,200 (reported on 4.0% of returns)
Here:
$29,200
State:
$33,287
(% of AGI for various income ranges: 973.3% for AGIs $50k-75k)
Taxes paid: $5,867 (reported on 6.0% of returns)
24578:
$5,867
State:
$8,284
(% of AGI for various income ranges: 293.3% for AGIs $50k-75k)
Earned income credit: $2,186 (reported on 14.0% of returns)
Here:
$2,186
State:
$2,214
(% of AGI for various income ranges: 70.9% for AGIs below $25k, 68.2% for AGIs $25k-50k)
Percentage of individuals using paid preparers for their 2020 taxes: 88.0%
Here:
88%
State:
92%
(% for various income ranges: 87.5% for AGIs below $25k, 92.3% for AGIs $25k-50k, 88.9% for AGIs $50k-75k, 80.0% for AGIs $75k-100k, 85.7% for AGIs $100k-200k)
Averages for the 2012 tax year for zip code 24578, filed in 2013:
Average Adjusted Gross Income (AGI) in 2012: $55,551 (Individual Income Tax Returns)
Here:
$55,551
State:
$71,192
Salary/wage: $35,077 (reported on 83.0% of returns)
Here:
$35,077
State:
$59,229
(% of AGI for various income ranges: 74.5% for AGIs below $25k, 78.1% for AGIs $25k-50k, 68.8% for AGIs $50k-75k, 68.0% for AGIs $75k-100k, 27.2% for AGIs $100k-200k)
Taxable interest for individuals: $982 (reported on 36.2% of returns)
This zip code:
$982
Virginia:
$1,600
(% of AGI for various income ranges: 2.6% for AGIs below $25k, 0.3% for AGIs $25k-50k, 0.3% for AGIs $50k-75k, 0.3% for AGIs $75k-100k, 0.6% for AGIs $100k-200k)
Ordinary dividends: $2,667 (reported on 19.1% of returns)
Here:
$2,667
State:
$6,959
(% of AGI for various income ranges: 1.4% for AGIs below $25k, 0.9% for AGIs $25k-50k, 2.8% for AGIs $50k-75k, 0.4% for AGIs $100k-200k)
Net capital gain/loss in AGI: +$2,086 (reported on 14.9% of returns)
Here:
+$2,086
State:
+$16,672
Profit/loss from business: +$5,100 (reported on 12.8% of returns)
Here:
+$5,100
State:
+$14,116
Taxable individual retirement arrangement distribution: $8,117 (reported on 12.8% of returns)
24578:
$8,117
Virginia:
$16,667
Total itemized deductions: $21,443 (20% of AGI, reported on 29.8% of returns)
Here:
$21,443
State:
$26,596
Here:
19.9% of AGI
State:
20.1% of AGI
(% of AGI for various income ranges: 17.0% for AGIs $25k-50k, 8.9% for AGIs $50k-75k, 19.6% for AGIs $75k-100k, 10.3% for AGIs $100k-200k)
Charity contributions: $3,830 (reported on 21.3% of returns)
Here:
$3,830
State:
$4,443
(% of AGI for various income ranges: 1.8% for AGIs $25k-50k, 5.6% for AGIs $75k-100k, 0.9% for AGIs $100k-200k)
Taxes paid: $6,179 (reported on 29.8% of returns)
24578:
$6,179
State:
$9,951
(% of AGI for various income ranges: 3.4% for AGIs $25k-50k, 2.1% for AGIs $50k-75k, 4.6% for AGIs $75k-100k, 4.0% for AGIs $100k-200k)
Earned income credit: $2,000 (reported on 19.1% of returns)
Here:
$2,000
State:
$2,211
(% of AGI for various income ranges: 5.1% for AGIs below $25k, 1.2% for AGIs $25k-50k)
Percentage of individuals using paid preparers for their 2012 taxes: 51.1%
Here:
51%
State:
46%
(% for various income ranges: 42.1% for AGIs below $25k, 46.2% for AGIs $25k-50k, 57.1% for AGIs $50k-75k, 75.0% for AGIs $75k-100k, 75.0% for AGIs $100k-200k)
Averages for the 2004 tax year for zip code 24578, filed in 2005:
Average Adjusted Gross Income (AGI) in 2004: $49,259 (Individual Income Tax Returns)
Here:
$49,259
State:
$56,704
Salary/wage: $36,767 (reported on 83.9% of returns)
Here:
$36,767
State:
$48,441
(% of AGI for various income ranges: 96.8% for AGIs below $10k, 67.1% for AGIs $10k-25k, 76.2% for AGIs $25k-50k, 82.7% for AGIs $50k-75k, 63.2% for AGIs $75k-100k, 37.9% for AGIs over 100k)
Taxable interest for individuals: $1,153 (reported on 46.2% of returns)
This zip code:
$1,153
Virginia:
$1,688
(% of AGI for various income ranges: 3.7% for AGIs $10k-25k, 0.8% for AGIs $25k-50k, 1.2% for AGIs $50k-75k, 0.6% for AGIs over 100k)
Taxable dividends: $1,486 (reported on 27.1% of returns)
Here:
$1,486
State:
$4,028
(% of AGI for various income ranges: 2.9% for AGIs $10k-25k, 1.2% for AGIs $25k-50k, 0.3% for AGIs $50k-75k, 0.3% for AGIs over 100k)
Net capital gain/loss: +$14,151 (reported on 17.8% of returns)
Here:
+$14,151
State:
+$14,375
(% of AGI for various income ranges: -0.2% for AGIs $10k-25k, 0.3% for AGIs $25k-50k, 1.5% for AGIs $50k-75k, 14.1% for AGIs over 100k)
Profit/loss from business: +$3,839 (reported on 15.2% of returns)
Here:
+$3,839
State:
+$13,342
Profit/loss from farming: +$958 (reported on 5.9% of returns)
Here:
+$958
State:
-$5,267
IRA payment deduction: $2,733 (reported on 3.7% of returns)
24578:
$2,733
Virginia:
$2,943
Total itemized deductions: $16,938 (19% of AGI, reported on 31.5% of returns)
Here:
$16,938
State:
$21,492
Here:
19.3% of AGI
State:
21.0% of AGI
(% of AGI for various income ranges: 16.1% for AGIs $10k-25k, 9.5% for AGIs $25k-50k, 9.0% for AGIs $50k-75k, 17.8% for AGIs $75k-100k, 9.6% for AGIs over 100k)
Charity contributions deductions: $3,112 (3% of AGI, reported on 24.0% of returns)
Here:
$3,112
State:
$3,794
Here:
3.1% of AGI
State:
3.5% of AGI
(% of AGI for various income ranges: 1.5% for AGIs $10k-25k, 0.6% for AGIs $25k-50k, 0.9% for AGIs $50k-75k, 1.5% for AGIs $75k-100k, 2.7% for AGIs over 100k)
Total tax: $6,888 (reported on 82.9% of returns)
24578:
$6,888
State:
$9,537
(% of AGI for various income ranges: 4.7% for AGIs $10k-25k, 7.0% for AGIs $25k-50k, 8.9% for AGIs $50k-75k, 9.4% for AGIs $75k-100k, 19.6% for AGIs over 100k)
Earned income credit: $1,744 (reported on 10.5% of returns)
Here:
$1,744
State:
$1,734
Percentage of individuals using paid preparers for their 2004 taxes: 55.0%
Here:
55%
State:
52%
(% for various income ranges: 60.8% for AGIs $10k-25k, 57.5% for AGIs $25k-50k, 52.2% for AGIs $50k-75k, 50.0% for AGIs $75k-100k, 74.1% for AGIs over 100k)
Household received Food Stamps/SNAP in the past 12 months: 12 Household did not receive Food Stamps/SNAP in the past 12 months: 262
Women who did not have a birth in the past 12 months: 100 (58 now married, 40 unmarried)
Housing units in zip code 24578 with a mortgage: 111 (30 second mortgage, 15 both second mortgage and home equity loan) Median monthly owner costs for units with a mortgage: $936 Median monthly owner costs for units without a mortgage: $382
Residents with income below the poverty level in 2022:
This zip code:
9.2%
Whole state:
10.6%
Residents with income below 50% of the poverty level in 2022:
This zip code:
9.2%
Whole state:
5.2%
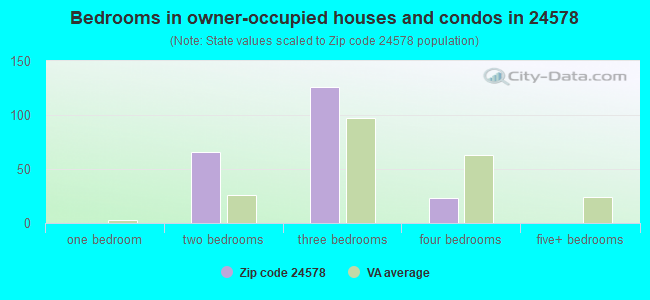
Median number of rooms in houses and condos:
Here:
6.3
State:
7.0
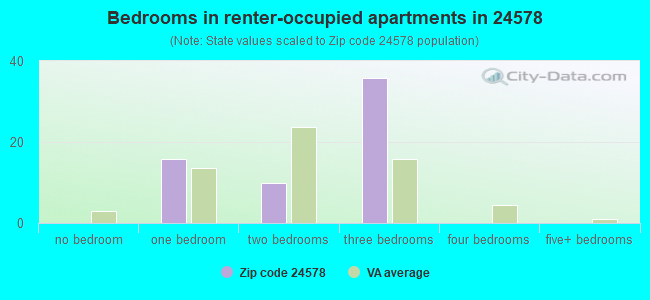
Median number of rooms in apartments:
Here:
5.7
State:
4.3
Notable locations in this zip code not listed on our city pages
Tourist attraction (not listed on the city page) : Natural Bridge Zoological Park (Cultural Attractions- Events- & Facilities; 5784 Lee Highway) (1). Display/hide its approximate location on the map
In group quarters: 28 (-1 institutionalized population)
Size of family households: 175 2-persons, 26 3-persons, 22 4-persons, 14 5-persons
Size of nonfamily households: 37 1-person
83 married couples with children.
35 single-parent households (8 men, 27 women).
92.0% of residents of 24578 zip code speak English at home.
8.3% of residents speak other Indo-European language at home (82% very well, 18% well).
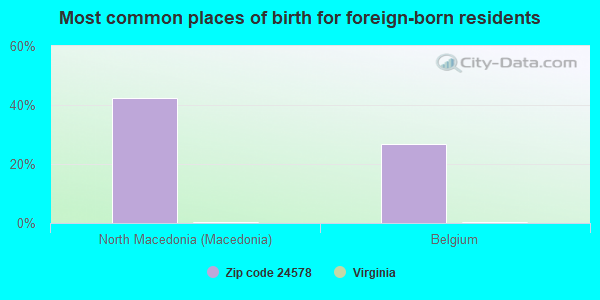
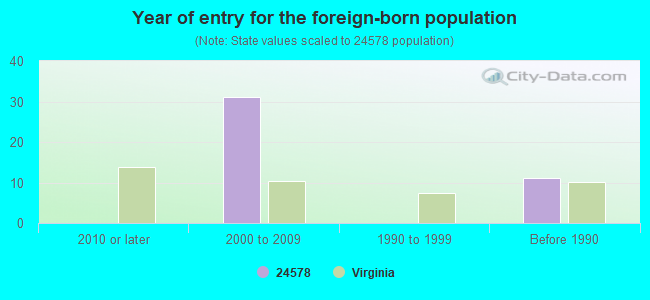
Foreign born population: 47 (7.1%) (100.0% of them are naturalized citizens)
This zip code:
7.1%
Whole state:
12.7%
42%North Macedonia (Macedonia)
27%Belgium
41%American
35%English
10%Irish
9%Polish
7%German
3%French
Year of entry for the foreign-born population
02010 or later
312000 to 2009
01990 to 1999
11Before 1990
44.8%Electricity
23.5%Fuel oil, kerosene, etc.
17.6%Wood
7.8%Bottled, tank, or LP gas
7.1%Utility gas
Population in 1990: 1,236.
Place of birth for U.S.-born residents:
This state: 548
Northeast: 24
Midwest: 18
South: 22
West: 13
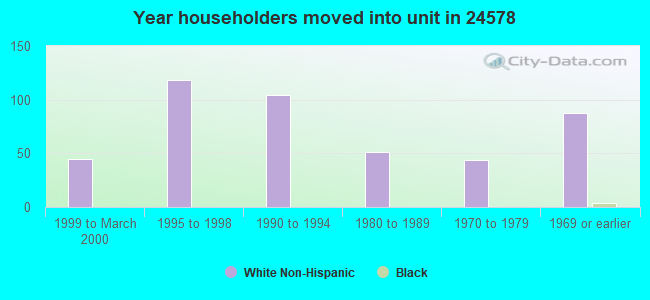
72% of the 24578 zip code residents lived in the same house 5 years ago. Out of people who lived in different houses, 43% lived in this county. Out of people who lived in different counties, 50% lived in Virginia.
101% of the 24578 zip code residents lived in the same house 1 year ago.
Private vs. public school enrollment:
Students in private schools in grades 1 to 8 (elementary and middle school):
Here:
0.0%
Virginia:
13.2%
Students in private schools in grades 9 to 12 (high school):
Here:
0.0%
Virginia:
10.2%
Students in private undergraduate colleges:
Here:
0.0%
Virginia:
18.7%
Companies with federal contracts located in this zip code:
NATURAL BRIDGE OF VIRGINIA LLC (15 APPLEDORE LN in NATURAL BRIDGE, VA; small business) 185 employees, $7000000 revenue. : $18,500 in 6 contractsfrom 2000 to 2003
Contracts for Lease or Rental of Facilities -- Office Buildings by Forest Service (disused code: now 12C2), Forest Service Signed by year:2000: $4,000; 2001: $5,000; 2002: $5,000; 2003: $4,500; 2004: $0; 2005: $0; 2006: $0.
Biggest contracts:
$5,000 with Forest Service (disused code: now 12C2) for Lease or Rental of Facilities -- Office Buildings. Signed on 2002-01-15. Completion date: 2005-12-15.
$5,000, same as above.Signed on 2001-09-15. Completion date: 2005-12-15.
$4,500 with Forest Service for Lease or Rental of Facilities -- Office Buildings. Signed on 2003-05-15. Completion date: 2005-12-15.
$4,000 with Forest Service (disused code: now 12C2) for Lease or Rental of Facilities -- Office Buildings. Signed on 2000-10-15. Completion date: 2000-12-15.
Top industries in this zip code by the number of employees in 2005:
Accommodation and Food Services: Hotels (except Casino Hotels) and Motels (100-249 employees: 1 establishment, 1-4 employees: 3 establishments)
Health Care and Social Assistance: Homes for the Elderly (20-49: 1)
Accommodation and Food Services: Full-Service Restaurants (10-19: 1, 5-9: 1)
Arts, Entertainment, and Recreation: Zoos and Botanical Gardens (10-19: 1, 1-4: 1)
Construction: Roofing Contractors (10-19: 1)
Construction: Masonry Contractors (5-9: 1)
Arts, Entertainment, and Recreation: Racetracks (1-4: 2)
People in group quarters in 2010:
5 people in group homes intended for adults
Fatal accident statistics in 2014:
Fatal accident count: 2
Vehicles involved in fatal accidents: 2
Fatal accidents caused by drunken drivers: 0
Fatalities: 2
Persons involved in fatal accidents: 2
Pedestrians involved in fatal accidents: 0
Fatal accident statistics in 2012:
Fatal accident count: 3
Vehicles involved in fatal accidents: 4
Fatal accidents caused by drunken drivers: 2
Fatalities: 3
Persons involved in fatal accidents: 4
Pedestrians involved in fatal accidents: 0
2002 - 2018 National Fire Incident Reporting System (NFIRS) incidents
Based on the data from the years 2002 - 2018 the average number of fires per year is 17. The highest number of reported fires - 33 took place in 2011, and the least - 9 in 2003. The data has a declining trend.
When looking into fire subcategories, the most incidents belonged to: Mobile Property/Vehicle Fires (36.9%), and Outside Fires (33.1%).
Fire incident types reported to NFIRS in Zip Code 24578


+$958
-$5,267
 Nearest zip codes: 24555, 24579, 24450, 24066, 24526, 24416.


 Based on the data from the years 2002 - 2018 the average number of fires per year is 17. The highest number of reported fires - 33 took place in 2011, and the least - 9 in 2003. The data has a declining trend.
 When looking into fire subcategories, the most incidents belonged to: Mobile Property/Vehicle Fires (36.9%), and Outside Fires (33.1%).