Estimated zip code population in 2022: 5,162 Zip code population in 2010: 4,883 Zip code population in 2000: 4,546
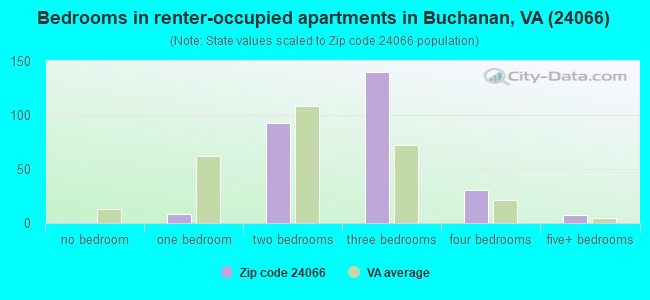
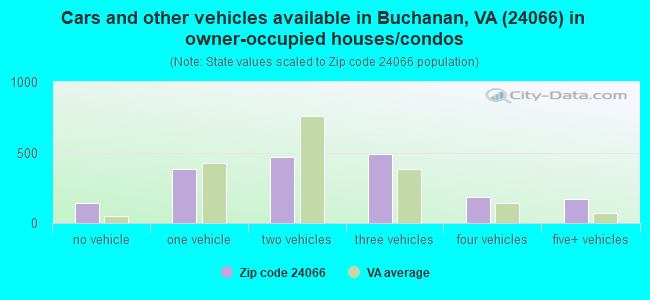
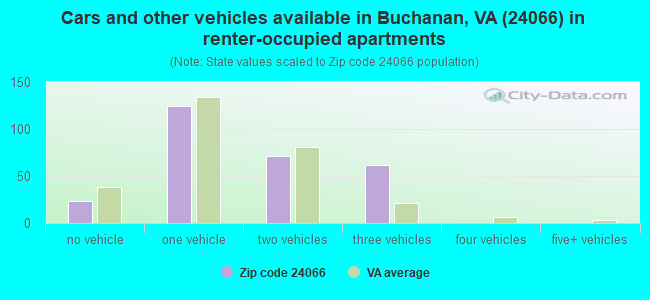
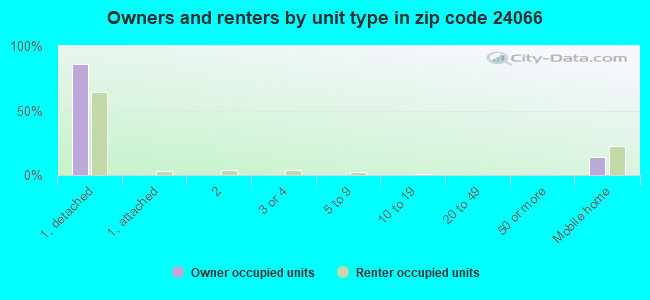
Houses and condos: 2,685 Renter-occupied apartments: 284
% of renters here:
13%
State:
33%
March 2022 cost of living index in zip code 24066: 84.6 (less than average, U.S. average is 100)
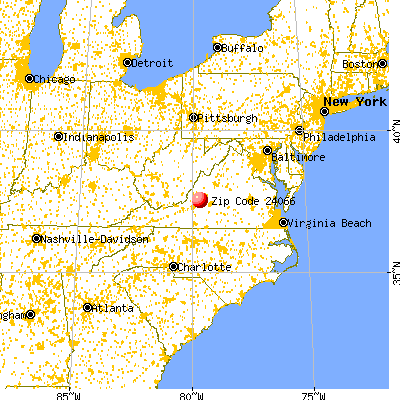
Land area: 160.6 sq. mi. Water area: 1.3 sq. mi.
Population density: 32 people per square mile
(very low).
OSM Map
General Map
Google Map
MSN Map
OSM Map
General Map
Google Map
MSN Map
OSM Map
General Map
Google Map
MSN Map
OSM Map
General Map
Google Map
MSN Map
Please wait while loading the map...
Real estate property taxes paid for housing units in 2022:
This zip code:
0.6% ($1,275)
Virginia:
0.7% ($2,617)
Median real estate property taxes paid for housing units with mortgages in 2022: $1,292 (0.6%) Median real estate property taxes paid for housing units with no mortgage in 2022: $1,270 (0.7%)
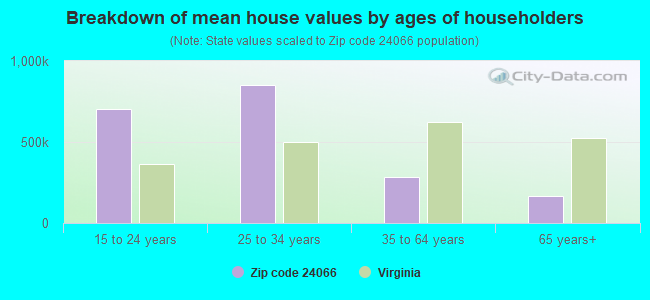
Estimated median house/condo value in 2022: $198,886
24066:
$198,886
Virginia:
$365,700
According to our research of Virginia and other state lists, there were 14 registered sex offenders living in 24066 zip code as of May 28, 2024. The ratio of all residents to sex offenders in zip code 24066 is 350 to 1. The ratio of registered sex offenders to all residents in this zip code is near the state average.
Median resident age:
This zip code:
50.8 years
Virginia median age:
39.0 years
Average household size:
This zip code:
2.5 people
Virginia:
2.5 people
Averages for the 2020 tax year for zip code 24066, filed in 2021:
Average Adjusted Gross Income (AGI) in 2020: $61,824 (Individual Income Tax Returns)
Here:
$61,824
State:
$86,446
Salary/wage: $52,009 (reported on 82.5% of returns)
Here:
$52,009
State:
$71,185
(% of AGI for various income ranges: 1147.9% for AGIs below $25k, 3381.3% for AGIs $25k-50k, 6461.9% for AGIs $50k-75k, 8712.6% for AGIs $75k-100k, 13981.3% for AGIs $100k-200k)
Taxable interest for individuals: $1,185 (reported on 32.0% of returns)
This zip code:
$1,185
Virginia:
$1,805
(% of AGI for various income ranges: 26.2% for AGIs below $25k, 11.8% for AGIs $25k-50k, 44.4% for AGIs $50k-75k, 29.5% for AGIs $75k-100k, 98.7% for AGIs $100k-200k)
Ordinary dividends: $5,261 (reported on 19.3% of returns)
Here:
$5,261
State:
$8,327
(% of AGI for various income ranges: 21.3% for AGIs below $25k, 19.1% for AGIs $25k-50k, 59.6% for AGIs $50k-75k, 67.4% for AGIs $75k-100k, 407.0% for AGIs $100k-200k)
Net capital gain/loss in AGI: +$12,367 (reported on 15.8% of returns)
Here:
+$12,367
State:
+$24,644
(% of AGI for various income ranges: 10.8% for AGIs below $25k, 51.3% for AGIs $25k-50k, 50.4% for AGIs $50k-75k, 133.2% for AGIs $75k-100k, 652.2% for AGIs $100k-200k)
Profit/loss from business: +$7,341 (reported on 14.0% of returns)
Here:
+$7,341
State:
+$12,836
(% of AGI for various income ranges: 115.5% for AGIs below $25k, 92.7% for AGIs $25k-50k, 261.9% for AGIs $50k-75k, 69.5% for AGIs $75k-100k, 209.1% for AGIs $100k-200k)
Taxable individual retirement arrangement distribution: $21,769 (reported on 12.7% of returns)
24066:
$21,769
Virginia:
$21,535
(% of AGI for various income ranges: 98.9% for AGIs below $25k, 118.2% for AGIs $25k-50k, 262.2% for AGIs $50k-75k, 373.7% for AGIs $75k-100k, 1669.1% for AGIs $100k-200k)
Total itemized deductions: $30,409 (reported on 4.8% of returns)
Here:
$30,409
State:
$33,287
(% of AGI for various income ranges: 448.1% for AGIs $50k-75k, 928.3% for AGIs $100k-200k)
Charity contributions: $10,888 (reported on 3.5% of returns)
Here:
$10,888
State:
$10,381
(% of AGI for various income ranges: 54.4% for AGIs $50k-75k, 314.8% for AGIs $100k-200k)
Taxes paid: $6,855 (reported on 4.8% of returns)
24066:
$6,855
State:
$8,284
(% of AGI for various income ranges: 82.6% for AGIs $50k-75k, 230.9% for AGIs $100k-200k)
Earned income credit: $1,929 (reported on 13.6% of returns)
Here:
$1,929
State:
$2,214
(% of AGI for various income ranges: 58.5% for AGIs below $25k, 64.0% for AGIs $25k-50k)
Percentage of individuals using paid preparers for their 2020 taxes: 94.7%
Here:
95%
State:
92%
(% for various income ranges: 91.7% for AGIs below $25k, 98.1% for AGIs $25k-50k, 94.7% for AGIs $50k-75k, 96.0% for AGIs $75k-100k, 93.9% for AGIs $100k-200k, 100.0% for AGIs over 200k)
Averages for the 2012 tax year for zip code 24066, filed in 2013:
Average Adjusted Gross Income (AGI) in 2012: $49,045 (Individual Income Tax Returns)
Here:
$49,045
State:
$71,192
Salary/wage: $42,265 (reported on 85.1% of returns)
Here:
$42,265
State:
$59,229
(% of AGI for various income ranges: 74.2% for AGIs below $25k, 80.8% for AGIs $25k-50k, 78.0% for AGIs $50k-75k, 79.9% for AGIs $75k-100k, 73.9% for AGIs $100k-200k, 36.3% for AGIs over 200k)
Taxable interest for individuals: $1,278 (reported on 35.1% of returns)
This zip code:
$1,278
Virginia:
$1,600
(% of AGI for various income ranges: 1.9% for AGIs below $25k, 0.5% for AGIs $25k-50k, 0.5% for AGIs $50k-75k, 0.7% for AGIs $75k-100k, 1.4% for AGIs $100k-200k, 1.0% for AGIs over 200k)
Ordinary dividends: $5,033 (reported on 17.6% of returns)
Here:
$5,033
State:
$6,959
(% of AGI for various income ranges: 0.9% for AGIs below $25k, 0.5% for AGIs $25k-50k, 1.4% for AGIs $50k-75k, 1.9% for AGIs $75k-100k, 4.4% for AGIs $100k-200k)
Net capital gain/loss in AGI: +$8,007 (reported on 13.1% of returns)
Here:
+$8,007
State:
+$16,672
(% of AGI for various income ranges: 0.4% for AGIs $25k-50k, 0.7% for AGIs $50k-75k, 0.7% for AGIs $75k-100k, 8.2% for AGIs $100k-200k)
Profit/loss from business: +$5,371 (reported on 12.6% of returns)
Here:
+$5,371
State:
+$14,116
(% of AGI for various income ranges: 4.1% for AGIs below $25k, 1.6% for AGIs $25k-50k, 2.2% for AGIs $50k-75k, 0.8% for AGIs $75k-100k, 0.4% for AGIs $100k-200k)
Taxable individual retirement arrangement distribution: $11,221 (reported on 13.1% of returns)
24066:
$11,221
Virginia:
$16,667
(% of AGI for various income ranges: 5.4% for AGIs below $25k, 2.5% for AGIs $25k-50k, 2.9% for AGIs $50k-75k, 2.6% for AGIs $75k-100k, 4.3% for AGIs $100k-200k)
Total itemized deductions: $19,609 (23% of AGI, reported on 29.3% of returns)
Here:
$19,609
State:
$26,596
Here:
23.0% of AGI
State:
20.1% of AGI
(% of AGI for various income ranges: 7.3% for AGIs below $25k, 10.2% for AGIs $25k-50k, 11.0% for AGIs $50k-75k, 10.5% for AGIs $75k-100k, 22.1% for AGIs $100k-200k)
Charity contributions: $3,669 (reported on 21.6% of returns)
Here:
$3,669
State:
$4,443
(% of AGI for various income ranges: 0.8% for AGIs below $25k, 0.9% for AGIs $25k-50k, 1.7% for AGIs $50k-75k, 1.2% for AGIs $75k-100k, 3.7% for AGIs $100k-200k)
Taxes paid: $6,344 (reported on 28.8% of returns)
24066:
$6,344
State:
$9,951
(% of AGI for various income ranges: 1.0% for AGIs below $25k, 2.5% for AGIs $25k-50k, 3.2% for AGIs $50k-75k, 3.3% for AGIs $75k-100k, 8.6% for AGIs $100k-200k)
Earned income credit: $2,003 (reported on 16.7% of returns)
Here:
$2,003
State:
$2,211
(% of AGI for various income ranges: 5.5% for AGIs below $25k, 0.9% for AGIs $25k-50k)
Percentage of individuals using paid preparers for their 2012 taxes: 50.5%
Here:
50%
State:
46%
(% for various income ranges: 47.6% for AGIs below $25k, 48.3% for AGIs $25k-50k, 51.4% for AGIs $50k-75k, 54.2% for AGIs $75k-100k, 57.9% for AGIs $100k-200k, 100.0% for AGIs over 200k)
Averages for the 2004 tax year for zip code 24066, filed in 2005:
Average Adjusted Gross Income (AGI) in 2004: $42,044 (Individual Income Tax Returns)
Here:
$42,044
State:
$56,704
Salary/wage: $37,860 (reported on 86.2% of returns)
Here:
$37,860
State:
$48,441
(% of AGI for various income ranges: 118.7% for AGIs below $10k, 75.6% for AGIs $10k-25k, 83.4% for AGIs $25k-50k, 84.7% for AGIs $50k-75k, 85.2% for AGIs $75k-100k, 56.4% for AGIs over 100k)
Taxable interest for individuals: $1,542 (reported on 44.2% of returns)
This zip code:
$1,542
Virginia:
$1,688
(% of AGI for various income ranges: 13.3% for AGIs below $10k, 2.9% for AGIs $10k-25k, 1.1% for AGIs $25k-50k, 0.8% for AGIs $50k-75k, 0.4% for AGIs $75k-100k, 2.8% for AGIs over 100k)
Taxable dividends: $2,706 (reported on 22.0% of returns)
Here:
$2,706
State:
$4,028
(% of AGI for various income ranges: 3.9% for AGIs below $10k, 1.3% for AGIs $10k-25k, 1.0% for AGIs $25k-50k, 0.6% for AGIs $50k-75k, 0.4% for AGIs $75k-100k, 3.5% for AGIs over 100k)
Net capital gain/loss: +$15,170 (reported on 14.8% of returns)
Here:
+$15,170
State:
+$14,375
(% of AGI for various income ranges: -0.7% for AGIs below $10k, 0.4% for AGIs $10k-25k, 0.7% for AGIs $25k-50k, 1.5% for AGIs $50k-75k, 1.6% for AGIs $75k-100k, 20.0% for AGIs over 100k)
Profit/loss from business: +$7,132 (reported on 13.4% of returns)
Here:
+$7,132
State:
+$13,342
(% of AGI for various income ranges: 9.4% for AGIs below $10k, 4.3% for AGIs $10k-25k, 2.6% for AGIs $25k-50k, 2.3% for AGIs $50k-75k, 2.2% for AGIs $75k-100k, 0.5% for AGIs over 100k)
IRA payment deduction: $3,090 (reported on 3.1% of returns)
24066:
$3,090
Virginia:
$2,943
(% of AGI for various income ranges: 0.3% for AGIs $10k-25k, 0.3% for AGIs $25k-50k, 0.3% for AGIs $50k-75k, 0.4% for AGIs $75k-100k)
Total itemized deductions: $16,019 (21% of AGI, reported on 29.6% of returns)
Here:
$16,019
State:
$21,492
Here:
21.4% of AGI
State:
21.0% of AGI
(% of AGI for various income ranges: 13.6% for AGIs below $10k, 9.0% for AGIs $10k-25k, 8.7% for AGIs $25k-50k, 12.2% for AGIs $50k-75k, 13.1% for AGIs $75k-100k, 12.7% for AGIs over 100k)
Charity contributions deductions: $3,079 (4% of AGI, reported on 23.6% of returns)
Here:
$3,079
State:
$3,794
Here:
3.8% of AGI
State:
3.5% of AGI
(% of AGI for various income ranges: 1.2% for AGIs below $10k, 0.9% for AGIs $10k-25k, 1.0% for AGIs $25k-50k, 1.7% for AGIs $50k-75k, 2.5% for AGIs $75k-100k, 2.4% for AGIs over 100k)
Total tax: $5,339 (reported on 78.3% of returns)
24066:
$5,339
State:
$9,537
(% of AGI for various income ranges: 4.7% for AGIs below $10k, 4.2% for AGIs $10k-25k, 6.9% for AGIs $25k-50k, 8.5% for AGIs $50k-75k, 10.4% for AGIs $75k-100k, 17.4% for AGIs over 100k)
Earned income credit: $1,593 (reported on 12.2% of returns)
Here:
$1,593
State:
$1,734
Percentage of individuals using paid preparers for their 2004 taxes: 54.1%
Here:
54%
State:
52%
(% for various income ranges: 46.4% for AGIs below $10k, 55.6% for AGIs $10k-25k, 52.3% for AGIs $25k-50k, 57.4% for AGIs $50k-75k, 58.3% for AGIs $75k-100k, 67.0% for AGIs over 100k)
Likely homosexual households (counted as self-reported same-sex unmarried-partner households)
Lesbian couples: 0.3% of all households
Gay men: 0.2% of all households
Household received Food Stamps/SNAP in the past 12 months: 119 Household did not receive Food Stamps/SNAP in the past 12 months: 1,976
Women who had a birth in the past 12 months: 32 (3 now married, 27 unmarried) Women who did not have a birth in the past 12 months: 843 (283 now married, 563 unmarried)
Housing units in zip code 24066 with a mortgage: 898 (58 second mortgage, 5 home equity loan, 46 both second mortgage and home equity loan) Houses without a mortgage: 107
Median monthly owner costs for units with a mortgage: $1,177 Median monthly owner costs for units without a mortgage: $369
Residents with income below the poverty level in 2022:
This zip code:
10.7%
Whole state:
10.6%
Residents with income below 50% of the poverty level in 2022:
This zip code:
6.1%
Whole state:
5.2%
Median number of rooms in houses and condos:
Here:
6.0
State:
7.0
Median number of rooms in apartments:
Here:
4.9
State:
4.3
Notable locations in this zip code not listed on our city pages
Notable locations in zip code 24066: Harveys Knob Overlook (A), Mills Gap Overlook (B), North Creek Camping Area (C), Purgatory Overlook (D), Middle Creek Picnic Area (E), Colon Hollow Shelter Campground (F), Cove Mountain Shelter (G), Bobblets Gap Shelter (H), Cornelius Shelter (I), Salisbury Furnace (J), Black Rock Hill Overlook (K), Camp Bethel (L), Iron Mine Hollow Overlooks (M), Indian Rock (N), Buchanan Volunteer Fire Department and Rescue Squad (O). Display/hide their locations on the map
Churches in zip code 24066 include: Andrew Chapel (A), Assembly of God Church (B), Back Creek Church (C), Cedar Bluff Church (D), Grace Church (E), High Bridge Church (F), Indian Rock Church (G), Jackson Church (H), Jennings Church (I). Display/hide their locations on the map
Cemeteries: Ponton Cemetery (1), Robinson Cemetery (2), Shafer Cemetery (3), Watson Cemetery (4), Bryant Cemetery (5), Fairview Cemetery (6), Mount Olivet Cemetery (7). Display/hide their locations on the map
Streams, rivers, and creeks: McCoglin Branch (A), Sprouts Run (B), Spreading Spring Branch (C), Spec Mines Branch (D), Slate Branch (E), Yellowstone Branch (F), Sales Branch (G), Roaring Run (H), Renick Run (I). Display/hide their locations on the map
Size of family households: 789 2-persons, 266 3-persons, 190 4-persons, 45 5-persons, 73 6-persons, 11 7-or-more-persons
Size of nonfamily households: 629 1-person, 105 2-persons, 7 4-persons
667 married couples with children.
214 single-parent households (64 men, 150 women).
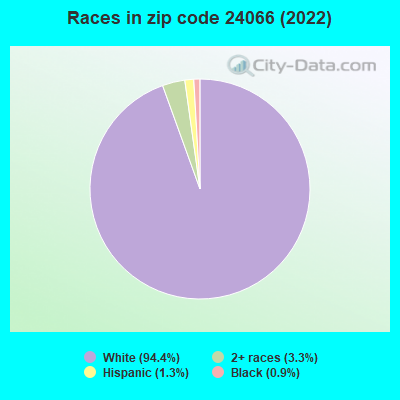
98.4% of residents of 24066 zip code speak English at home.
1.2% of residents speak Spanish at home (48% very well, 23% well, 29% not well).
0.4% of residents speak other Indo-European language at home (100% very well).
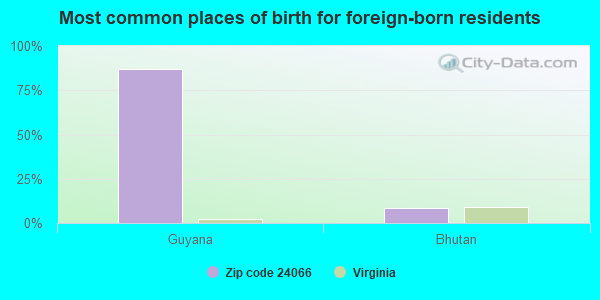
Foreign born population: 63 (1.2%) (77.4% of them are naturalized citizens)
This zip code:
1.2%
Whole state:
12.7%
87%Guyana
8%Bhutan
50%American
14%English
11%Irish
7%German
2%European
1%Italian
0%Scotch-Irish
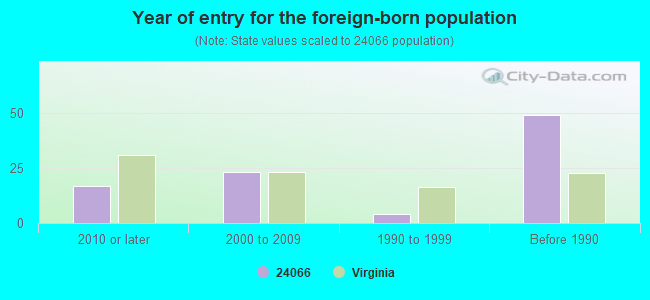
Year of entry for the foreign-born population
172010 or later
232000 to 2009
41990 to 1999
49Before 1990
Facilities with environmental interests located in this zip code:
BUCHANAN ELEM. (255 SCHOOLHOUSE RD in BUCHANAN, VA)
(National Center for Education Statistics) - STATE ID-0120020 Organizations: BOTETOURT COUNTY PUBLIC SCHOOLS (SCHOOL DISTRICT)
BUCHANAN TOWN - SEWAGE TREATME (RT 43 in BUCHANAN, VA)
National Pollutant Discharge Elimination System NON-MAJOR (Tracking pollutant discharge elimination systems) - permit Business SIC classification: SEWERAGE SYSTEMS Alternative names: BUCHANAN,TOWN OF,SEW.TREAT.PLA
Housing units lacking complete plumbing facilities: 3.5% Housing units lacking complete kitchen facilities: 4.1%
68.2%Electricity
9.4%Wood
8.8%Fuel oil, kerosene, etc.
8.6%Bottled, tank, or LP gas
3.1%Utility gas
1.0%No fuel used
1.0%Other fuel
Population in 1990: 4,145. Population change in the 1990s: +401 (+9.7%).
Place of birth for U.S.-born residents:
This state: 3,856
Northeast: 492
Midwest: 91
South: 529
West: 65
67% of the 24066 zip code residents lived in the same house 5 years ago. Out of people who lived in different houses, 59% lived in this county. Out of people who lived in different counties, 50% lived in Virginia.
93% of the 24066 zip code residents lived in the same house 1 year ago. Out of people who lived in different houses, 44% moved from this county. Out of people who lived in different houses, 57% moved from different county within same state.
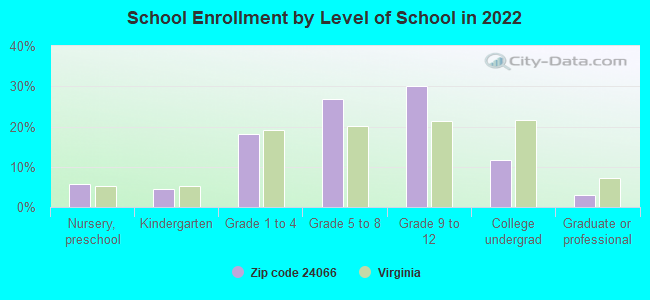
Private vs. public school enrollment:
Students in private schools in grades 1 to 8 (elementary and middle school): 23
Here:
5.0%
Virginia:
13.2%
Students in private schools in grades 9 to 12 (high school): 6
Here:
1.9%
Virginia:
10.2%
Students in private undergraduate colleges: 38
Here:
31.5%
Virginia:
18.7%
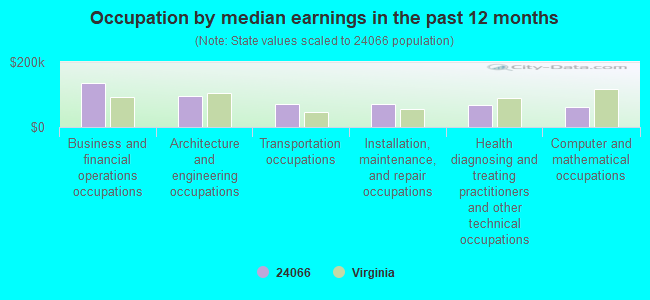
Occupation by median earnings in the past 12 months ($)
135,579Business and financial operations occupations
95,436Architecture and engineering occupations
71,791Transportation occupations
69,641Installation, maintenance, and repair occupations
68,975Health diagnosing and treating practitioners and other technical occupations
60,788Computer and mathematical occupations
Companies with federal contracts located in this zip code:
MTI GROENDYK INC (19318 MAIN STREET in BUCHANAN, VA)
$10,270 with Navy for Packing and Gasket Materials. Signed on 2004-11-19. Completion date: 2004-12-27.
RBX INDUSTRIES, INC (19318 MAIN STREET in BUCHANAN, VA; small business)
$3,518 with Army for Hose and Flexible Tubing. Signed on 2003-05-20. Completion date: 2003-06-27.
Top industries in this zip code by the number of employees in 2005:
Mining: Crushed and Broken Limestone Mining and Quarrying (50-99 employees: 1 establishment)
Construction: Highway, Street, and Bridge Construction (20-49: 1, 10-19: 2)
Construction: Water and Sewer Line and Related Structures Construction (20-49: 1, 10-19: 1, 1-4: 4)
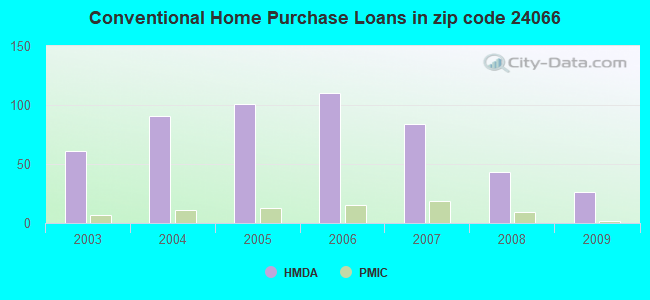
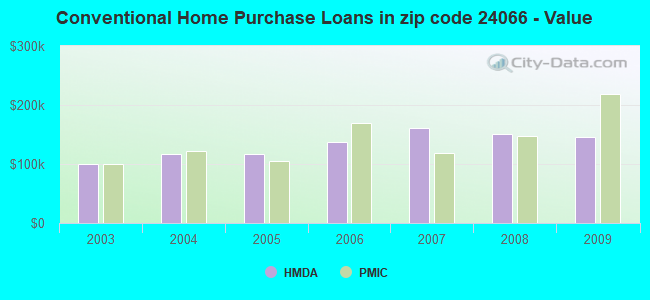
Detailed PMIC statistics for the following Tracts:0402.00
2002 - 2018 National Fire Incident Reporting System (NFIRS) incidents
Based on the data from the years 2002 - 2018 the average number of fire incidents per year is 39. The highest number of fire incidents - 77 took place in 2005, and the least - 10 in 2002. The data has a rising trend.
When looking into fire subcategories, the most reports belonged to: Structure Fires (45.5%), and Outside Fires (31.1%).
Fire incident types reported to NFIRS in Zip Code 24066


 Nearest zip codes: 24122, 24578, 24064, 24579, 24174, 24085.
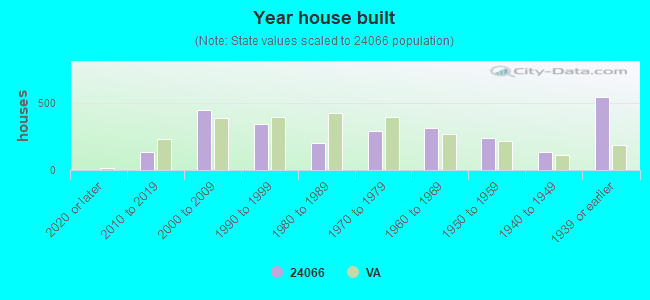


 Based on the data from the years 2002 - 2018 the average number of fire incidents per year is 39. The highest number of fire incidents - 77 took place in 2005, and the least - 10 in 2002. The data has a rising trend.
 When looking into fire subcategories, the most reports belonged to: Structure Fires (45.5%), and Outside Fires (31.1%).