Estimated zip code population in 2022: 4,300 Zip code population in 2010: 4,385 Zip code population in 2000: 4,388
Houses and condos: 2,202 Renter-occupied apartments: 789
% of renters here:
38%
State:
33%
March 2022 cost of living index in zip code 27027: 89.1 (less than average, U.S. average is 100)
Land area: 21.8 sq. mi. Water area: 0.1 sq. mi.
Population density: 197 people per square mile
(very low).
OSM Map
General Map
Google Map
MSN Map
OSM Map
General Map
Google Map
MSN Map
OSM Map
General Map
Google Map
MSN Map
OSM Map
General Map
Google Map
MSN Map
Please wait while loading the map...
Real estate property taxes paid for housing units in 2022:
This zip code:
0.9% ($1,181)
North Carolina:
0.6% ($1,769)
Median real estate property taxes paid for housing units with mortgages in 2022: $1,389 (0.9%) Median real estate property taxes paid for housing units with no mortgage in 2022: $913 (0.8%)
Business Search- 14 Million verified businesses
Males: 2,139
(49.7%)
Females: 2,161
(50.3%)
For population 25 years and over in 27027:
High school or higher: 79.3%
Bachelor's degree or higher: 13.1%
Graduate or professional degree: 2.9%
Unemployed: 6.8%
Mean travel time to work (commute): 29.0 minutes
For population 15 years and over in 27027:
Never married: 27.6%
Now married: 46.9%
Separated: 1.6%
Widowed: 7.0%
Divorced: 16.9%
Zip code 27027 compared to state average:
Median household income below state average.
Median house value below state average.
Unemployed percentage above state average.
Black race population percentage significantly below state average.
Hispanic race population percentage significantly below state average.
Median age significantly above state average.
Foreign-born population percentage significantly below state average.
Length of stay since moving in significantly above state average.
House age above state average.
Percentage of population with a bachelor's degree or higher significantly below state average.
Estimated median house/condo value in 2022: $136,298
27027:
$136,298
North Carolina:
$280,600
According to our research of North Carolina and other state lists, there were 6 registered sex offenders living in 27027 zip code as of May 28, 2024. The ratio of all residents to sex offenders in zip code 27027 is 773 to 1. The ratio of registered sex offenders to all residents in this zip code is lower than the state average.
Median resident age:
This zip code:
53.8 years
North Carolina median age:
39.2 years
Average household size:
This zip code:
2.0 people
North Carolina:
2.4 people
Averages for the 2020 tax year for zip code 27027, filed in 2021:
Average Adjusted Gross Income (AGI) in 2020: $44,220 (Individual Income Tax Returns)
Here:
$44,220
State:
$70,020
Salary/wage: $39,425 (reported on 84.4% of returns)
Here:
$39,425
State:
$58,387
(% of AGI for various income ranges: 1292.9% for AGIs below $25k, 3633.6% for AGIs $25k-50k, 7086.3% for AGIs $50k-75k, 10437.8% for AGIs $75k-100k, 21170.0% for AGIs $100k-200k)
Taxable interest for individuals: $539 (reported on 20.1% of returns)
This zip code:
$539
North Carolina:
$1,479
(% of AGI for various income ranges: 6.3% for AGIs below $25k, 16.9% for AGIs $25k-50k, 11.1% for AGIs $50k-75k, 27.8% for AGIs $75k-100k, 64.3% for AGIs $100k-200k)
Ordinary dividends: $3,150 (reported on 10.1% of returns)
Here:
$3,150
State:
$7,888
(% of AGI for various income ranges: 27.1% for AGIs below $25k, 35.2% for AGIs $25k-50k, 33.7% for AGIs $50k-75k, 118.9% for AGIs $75k-100k, 157.1% for AGIs $100k-200k)
Net capital gain/loss in AGI: +$2,777 (reported on 7.3% of returns)
Here:
+$2,777
State:
+$23,652
(% of AGI for various income ranges: 24.8% for AGIs $25k-50k, 25.8% for AGIs $50k-75k, 310.0% for AGIs $100k-200k)
Profit/loss from business: +$8,153 (reported on 9.5% of returns)
Here:
+$8,153
State:
+$11,710
(% of AGI for various income ranges: 98.0% for AGIs below $25k, 68.6% for AGIs $25k-50k, 65.3% for AGIs $50k-75k, 677.1% for AGIs $100k-200k)
Taxable individual retirement arrangement distribution: $13,712 (reported on 9.5% of returns)
27027:
$13,712
North Carolina:
$20,247
(% of AGI for various income ranges: 67.6% for AGIs below $25k, 146.2% for AGIs $25k-50k, 340.0% for AGIs $50k-75k, 1037.1% for AGIs $100k-200k)
Total itemized deductions: $23,800 (reported on 1.7% of returns)
Here:
$23,800
State:
$34,549
(% of AGI for various income ranges: 375.8% for AGIs $50k-75k)
Taxes paid: $4,500 (reported on 1.7% of returns)
27027:
$4,500
State:
$7,586
(% of AGI for various income ranges: 71.1% for AGIs $50k-75k)
Earned income credit: $2,316 (reported on 20.7% of returns)
Here:
$2,316
State:
$2,337
(% of AGI for various income ranges: 113.9% for AGIs below $25k, 65.7% for AGIs $25k-50k)
Percentage of individuals using paid preparers for their 2020 taxes: 93.9%
Here:
94%
State:
93%
(% for various income ranges: 94.3% for AGIs below $25k, 94.3% for AGIs $25k-50k, 92.6% for AGIs $50k-75k, 92.9% for AGIs $75k-100k, 93.3% for AGIs $100k-200k)
Averages for the 2012 tax year for zip code 27027, filed in 2013:
Average Adjusted Gross Income (AGI) in 2012: $36,979 (Individual Income Tax Returns)
Here:
$36,979
State:
$54,937
Salary/wage: $33,882 (reported on 87.1% of returns)
Here:
$33,882
State:
$46,336
(% of AGI for various income ranges: 75.8% for AGIs below $25k, 87.1% for AGIs $25k-50k, 80.5% for AGIs $50k-75k, 77.4% for AGIs $75k-100k, 72.6% for AGIs $100k-200k)
Taxable interest for individuals: $779 (reported on 24.7% of returns)
This zip code:
$779
North Carolina:
$1,298
(% of AGI for various income ranges: 1.1% for AGIs below $25k, 0.3% for AGIs $25k-50k, 0.5% for AGIs $50k-75k, 0.8% for AGIs $75k-100k, 0.2% for AGIs $100k-200k)
Ordinary dividends: $2,033 (reported on 12.4% of returns)
Here:
$2,033
State:
$6,213
(% of AGI for various income ranges: 1.1% for AGIs below $25k, 0.6% for AGIs $25k-50k, 0.3% for AGIs $50k-75k, 1.4% for AGIs $75k-100k, 0.2% for AGIs $100k-200k)
Net capital gain/loss in AGI: +$1,156 (reported on 9.4% of returns)
Here:
+$1,156
State:
+$12,740
(% of AGI for various income ranges: 0.1% for AGIs below $25k, 0.6% for AGIs $75k-100k, 1.0% for AGIs $100k-200k)
Profit/loss from business: +$5,695 (reported on 11.8% of returns)
Here:
+$5,695
State:
+$10,311
(% of AGI for various income ranges: 5.4% for AGIs below $25k, 1.2% for AGIs $25k-50k, 1.4% for AGIs $50k-75k, 1.9% for AGIs $75k-100k)
Taxable individual retirement arrangement distribution: $9,919 (reported on 9.4% of returns)
27027:
$9,919
North Carolina:
$15,575
(% of AGI for various income ranges: 4.1% for AGIs below $25k, 1.9% for AGIs $25k-50k, 3.6% for AGIs $50k-75k, 3.6% for AGIs $75k-100k)
Total itemized deductions: $15,977 (22% of AGI, reported on 18.2% of returns)
Here:
$15,977
State:
$23,438
Here:
21.9% of AGI
State:
21.5% of AGI
(% of AGI for various income ranges: 4.6% for AGIs below $25k, 4.8% for AGIs $25k-50k, 6.9% for AGIs $50k-75k, 11.4% for AGIs $75k-100k, 14.0% for AGIs $100k-200k)
Charity contributions: $3,930 (reported on 13.5% of returns)
Here:
$3,930
State:
$4,687
(% of AGI for various income ranges: 0.7% for AGIs below $25k, 0.6% for AGIs $25k-50k, 1.2% for AGIs $50k-75k, 2.4% for AGIs $75k-100k, 3.0% for AGIs $100k-200k)
Taxes paid: $5,674 (reported on 18.2% of returns)
27027:
$5,674
State:
$8,823
(% of AGI for various income ranges: 0.7% for AGIs below $25k, 1.2% for AGIs $25k-50k, 2.3% for AGIs $50k-75k, 4.7% for AGIs $75k-100k, 6.3% for AGIs $100k-200k)
Earned income credit: $2,270 (reported on 25.3% of returns)
Here:
$2,270
State:
$2,376
(% of AGI for various income ranges: 7.3% for AGIs below $25k, 1.3% for AGIs $25k-50k)
Percentage of individuals using paid preparers for their 2012 taxes: 60.6%
Here:
61%
State:
53%
(% for various income ranges: 58.4% for AGIs below $25k, 58.8% for AGIs $25k-50k, 60.9% for AGIs $50k-75k, 72.7% for AGIs $75k-100k, 75.0% for AGIs $100k-200k)
Averages for the 2004 tax year for zip code 27027, filed in 2005:
Average Adjusted Gross Income (AGI) in 2004: $31,055 (Individual Income Tax Returns)
Here:
$31,055
State:
$45,376
Salary/wage: $29,635 (reported on 87.0% of returns)
Here:
$29,635
State:
$39,442
(% of AGI for various income ranges: 98.7% for AGIs below $10k, 82.1% for AGIs $10k-25k, 84.2% for AGIs $25k-50k, 84.7% for AGIs $50k-75k, 87.6% for AGIs $75k-100k, 65.4% for AGIs over 100k)
Taxable interest for individuals: $844 (reported on 29.4% of returns)
This zip code:
$844
North Carolina:
$1,515
(% of AGI for various income ranges: 2.9% for AGIs below $10k, 1.3% for AGIs $10k-25k, 0.6% for AGIs $25k-50k, 0.4% for AGIs $50k-75k, 0.3% for AGIs $75k-100k, 1.5% for AGIs over 100k)
Taxable dividends: $1,305 (reported on 13.3% of returns)
Here:
$1,305
State:
$4,016
(% of AGI for various income ranges: 3.2% for AGIs below $10k, 0.8% for AGIs $10k-25k, 0.6% for AGIs $25k-50k, 0.3% for AGIs $50k-75k, 0.2% for AGIs $75k-100k, 0.2% for AGIs over 100k)
Net capital gain/loss: +$1,834 (reported on 9.9% of returns)
Here:
+$1,834
State:
+$11,152
(% of AGI for various income ranges: -1.1% for AGIs below $10k, 0.5% for AGIs $10k-25k, 1.1% for AGIs $25k-50k, 0.4% for AGIs $50k-75k, 0.0% for AGIs $75k-100k, 0.9% for AGIs over 100k)
Profit/loss from business: +$3,983 (reported on 9.8% of returns)
Here:
+$3,983
State:
+$9,490
(% of AGI for various income ranges: -6.8% for AGIs below $10k, 2.3% for AGIs $10k-25k, 1.5% for AGIs $25k-50k, 2.5% for AGIs $50k-75k, -1.1% for AGIs $75k-100k)
IRA payment deduction: $3,069 (reported on 1.6% of returns)
27027:
$3,069
North Carolina:
$2,967
Total itemized deductions: $13,778 (25% of AGI, reported on 22.6% of returns)
Here:
$13,778
State:
$19,464
Here:
24.9% of AGI
State:
22.7% of AGI
(% of AGI for various income ranges: 8.9% for AGIs below $10k, 7.8% for AGIs $10k-25k, 7.4% for AGIs $25k-50k, 11.9% for AGIs $50k-75k, 14.2% for AGIs $75k-100k, 13.4% for AGIs over 100k)
Charity contributions deductions: $3,167 (6% of AGI, reported on 18.6% of returns)
Here:
$3,167
State:
$4,035
Here:
5.6% of AGI
State:
4.5% of AGI
(% of AGI for various income ranges: 1.2% for AGIs $10k-25k, 1.3% for AGIs $25k-50k, 2.5% for AGIs $50k-75k, 2.5% for AGIs $75k-100k, 3.3% for AGIs over 100k)
Total tax: $3,294 (reported on 71.1% of returns)
27027:
$3,294
State:
$7,257
(% of AGI for various income ranges: 2.4% for AGIs below $10k, 3.3% for AGIs $10k-25k, 6.3% for AGIs $25k-50k, 8.8% for AGIs $50k-75k, 9.7% for AGIs $75k-100k, 15.6% for AGIs over 100k)
Earned income credit: $1,680 (reported on 21.9% of returns)
Here:
$1,680
State:
$1,851
Percentage of individuals using paid preparers for their 2004 taxes: 59.2%
Here:
59%
State:
62%
(% for various income ranges: 54.3% for AGIs below $10k, 57.3% for AGIs $10k-25k, 59.5% for AGIs $25k-50k, 64.7% for AGIs $50k-75k, 68.8% for AGIs $75k-100k, 72.5% for AGIs over 100k)
Household received Food Stamps/SNAP in the past 12 months: 488 Household did not receive Food Stamps/SNAP in the past 12 months: 1,610
Women who had a birth in the past 12 months: 29 (20 now married, 8 unmarried) Women who did not have a birth in the past 12 months: 702 (303 now married, 398 unmarried)
Housing units in zip code 27027 with a mortgage: 687 (52 second mortgage, 34 both second mortgage and home equity loan) Median monthly owner costs for units with a mortgage: $1,026 Median monthly owner costs for units without a mortgage: $331
Residents with income below the poverty level in 2022:
This zip code:
14.0%
Whole state:
12.8%
Residents with income below 50% of the poverty level in 2022:
This zip code:
10.6%
Whole state:
6.8%
Median number of rooms in houses and condos:
Here:
5.5
State:
6.4
Median number of rooms in apartments:
Here:
4.6
State:
4.4
Notable locations in this zip code not listed on our city pages
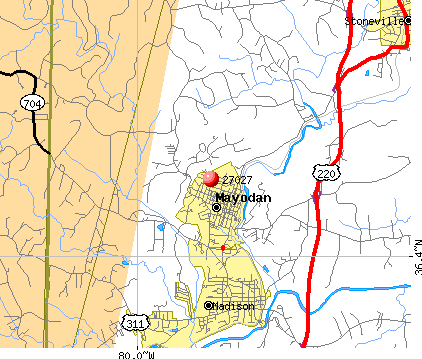
Churches in zip code 27027 include: Beaver Island Baptist Church (A), Victor Hill Pentecostal Holiness Church (B), Martin View Church (C), Woodbine Baptist Church (D), First Baptist Church of Mayodan (E), West Side Baptist Church (F), Pentecostal Holiness Church (G), Episcopal Church of the Messiah (H), Community Baptist Church (I). Display/hide their locations on the map
Cemeteries: Gibson Cemetery (1), Llewellyn Cemetery (2), Mayodan Municipal Cemetery (3), Clearview Cemetery (4), Beaver Island Cemetery (5), Mount Herman Cemetery (6), Ayersville Cemetery (7). Display/hide their locations on the map
In group quarters: 83 (-1 institutionalized population)
Size of family households: 634 2-persons, 280 3-persons, 206 4-persons, 61 5-persons
Size of nonfamily households: 787 1-person, 106 2-persons
445 married couples with children.
68 single-parent households (4 men, 64 women).
98.5% of residents of 27027 zip code speak English at home.
1.5% of residents speak Spanish at home (71% very well, 11% well, 18% not well).
Foreign born population: 49 (1.2%) (13.3% of them are naturalized citizens)
This zip code:
1.2%
Whole state:
8.6%
46%Indonesia
40%Honduras
12%Sweden
42%American
14%English
7%German
5%Irish
2%Scottish
2%European
1%British
Year of entry for the foreign-born population
02010 or later
142000 to 2009
171990 to 1999
56Before 1990
Facilities with environmental interests located in this zip code:
BURLINGTON INDUSTRY - MAYODAN (TURNER ROAD in MAYODAN, NC)
AIR MINOR (AIRS/AFS) STATE MASTER (North Carolina facility info) - AIR PROGRAM TRI REPORTER (Tracking of toxic chemicals releasing facilities) Business SIC classification: YARN SPINNING MILLS; YARN TEXTURIZING, THROWING, TWISTING, AND WINDING MILLS Business NAICS classification: YARN SPINNING MILLS. Alternative names: BURLINGTON INDUSTRIES INCORPORATED, BURLINGTON IND - MAYODAN **INACTIVE**, MAYODAN PLANT BMYC
Housing units lacking complete plumbing facilities: 0.6% Housing units lacking complete kitchen facilities: 0.6%
56.4%Electricity
24.9%Utility gas
11.1%Fuel oil, kerosene, etc.
3.1%Wood
2.6%Bottled, tank, or LP gas
1.6%Other fuel
Population in 1990: 6,545.
Place of birth for U.S.-born residents:
This state: 3,439
Northeast: 195
Midwest: 116
South: 351
West: 44
65% of the 27027 zip code residents lived in the same house 5 years ago. Out of people who lived in different houses, 69% lived in this county. Out of people who lived in different counties, 50% lived in North Carolina.
93% of the 27027 zip code residents lived in the same house 1 year ago. Out of people who lived in different houses, 51% moved from this county. Out of people who lived in different houses, 50% moved from different county within same state. Out of people who lived in different houses, 1% moved from abroad.
Private vs. public school enrollment:
Students in private schools in grades 1 to 8 (elementary and middle school):
Here:
0.0%
North Carolina:
13.8%
Students in private schools in grades 9 to 12 (high school): 4
Here:
2.8%
North Carolina:
11.9%
Students in private undergraduate colleges: 37
Here:
27.1%
North Carolina:
19.3%
Occupation by median earnings in the past 12 months ($)
66,221Transportation occupations
61,977Computer and mathematical occupations
56,041Management occupations
51,374Production occupations
49,016Business and financial operations occupations
44,498Installation, maintenance, and repair occupations
Top industries in this zip code by the number of employees in 2005:
Health Care and Social Assistance: Child Day Care Services (20-49 employees: 1 establishment, 10-19 employees: 1 establishment)
Arts, Entertainment, and Recreation: Fitness and Recreational Sports Centers (20-49: 1, 1-4: 1)
Accommodation and Food Services: Full-Service Restaurants (10-19: 1, 1-4: 3)
Real Estate and Rental and Leasing: Video Tape and Disc Rental (10-19: 1)
Construction: Painting and Wall Covering Contractors (10-19: 1)
People in group quarters in 2010:
2 people in group homes intended for adults
Home Mortgage Disclosure Act Aggregated Statistics For Year 2009 (Based on 4 partial tracts)
A) FHA, FSA/RHS & VA Home Purchase Loans
B) Conventional Home Purchase Loans
C) Refinancings
D) Home Improvement Loans
F) Non-occupant Loans on < 5 Family Dwellings (A B C & D)
G) Loans On Manufactured Home Dwelling (A B C & D)
Number
Average Value
Number
Average Value
Number
Average Value
Number
Average Value
Number
Average Value
Number
Average Value
LOANS ORIGINATED
17
$108,841
18
$87,819
70
$105,592
7
$22,411
8
$46,976
7
$83,299
APPLICATIONS APPROVED, NOT ACCEPTED
1
$79,330
0
$0
2
$57,655
0
$0
1
$106,310
1
$9,000
APPLICATIONS DENIED
7
$85,563
7
$79,613
36
$85,941
7
$43,363
7
$73,607
9
$84,989
APPLICATIONS WITHDRAWN
2
$75,365
5
$76,864
26
$101,669
0
$0
2
$59,585
3
$79,053
FILES CLOSED FOR INCOMPLETENESS
0
$0
2
$69,920
5
$95,816
0
$0
1
$61,340
0
$0
Aggregated Statistics For Year 2008 (Based on 4 partial tracts)
A) FHA, FSA/RHS & VA Home Purchase Loans
B) Conventional Home Purchase Loans
C) Refinancings
D) Home Improvement Loans
E) Loans on Dwellings For 5+ Families
F) Non-occupant Loans on < 5 Family Dwellings (A B C & D)
G) Loans On Manufactured Home Dwelling (A B C & D)
Number
Average Value
Number
Average Value
Number
Average Value
Number
Average Value
Number
Average Value
Number
Average Value
Number
Average Value
LOANS ORIGINATED
27
$95,639
44
$75,346
63
$103,870
10
$29,974
2
$100,490
25
$56,527
8
$77,895
APPLICATIONS APPROVED, NOT ACCEPTED
2
$53,565
6
$73,280
9
$117,448
1
$8,180
0
$0
4
$39,668
1
$67,880
APPLICATIONS DENIED
2
$79,325
5
$74,012
52
$86,237
10
$54,793
0
$0
4
$63,332
11
$75,865
APPLICATIONS WITHDRAWN
2
$78,265
8
$78,674
17
$98,706
3
$17,863
0
$0
6
$51,203
2
$71,965
FILES CLOSED FOR INCOMPLETENESS
0
$0
0
$0
4
$118,172
0
$0
0
$0
0
$0
0
$0
Aggregated Statistics For Year 2007 (Based on 4 partial tracts)
A) FHA, FSA/RHS & VA Home Purchase Loans
B) Conventional Home Purchase Loans
C) Refinancings
D) Home Improvement Loans
F) Non-occupant Loans on < 5 Family Dwellings (A B C & D)
G) Loans On Manufactured Home Dwelling (A B C & D)
Number
Average Value
Number
Average Value
Number
Average Value
Number
Average Value
Number
Average Value
Number
Average Value
LOANS ORIGINATED
8
$88,696
86
$78,871
82
$77,205
7
$31,970
26
$46,980
15
$86,555
APPLICATIONS APPROVED, NOT ACCEPTED
0
$0
10
$92,479
17
$89,378
0
$0
5
$64,064
2
$56,430
APPLICATIONS DENIED
1
$94,050
10
$71,317
83
$85,827
12
$46,468
2
$53,940
5
$66,088
APPLICATIONS WITHDRAWN
1
$74,420
5
$107,690
36
$100,611
2
$44,380
0
$0
1
$55,610
FILES CLOSED FOR INCOMPLETENESS
0
$0
2
$174,190
2
$160,290
0
$0
0
$0
0
$0
Aggregated Statistics For Year 2006 (Based on 4 partial tracts)
A) FHA, FSA/RHS & VA Home Purchase Loans
B) Conventional Home Purchase Loans
C) Refinancings
D) Home Improvement Loans
E) Loans on Dwellings For 5+ Families
F) Non-occupant Loans on < 5 Family Dwellings (A B C & D)
G) Loans On Manufactured Home Dwelling (A B C & D)
Number
Average Value
Number
Average Value
Number
Average Value
Number
Average Value
Number
Average Value
Number
Average Value
Number
Average Value
LOANS ORIGINATED
13
$87,607
77
$67,082
125
$73,584
21
$46,310
2
$576,295
36
$56,906
9
$54,477
APPLICATIONS APPROVED, NOT ACCEPTED
2
$341,475
9
$63,980
25
$75,248
0
$0
0
$0
7
$38,281
3
$39,527
APPLICATIONS DENIED
2
$95,225
55
$61,522
115
$79,576
11
$35,045
0
$0
4
$79,698
24
$53,052
APPLICATIONS WITHDRAWN
1
$84,230
4
$92,055
41
$83,547
2
$46,055
0
$0
2
$26,795
1
$66,240
FILES CLOSED FOR INCOMPLETENESS
0
$0
4
$88,795
7
$118,194
0
$0
0
$0
0
$0
2
$149,055
Aggregated Statistics For Year 2005 (Based on 4 partial tracts)
A) FHA, FSA/RHS & VA Home Purchase Loans
B) Conventional Home Purchase Loans
C) Refinancings
D) Home Improvement Loans
E) Loans on Dwellings For 5+ Families
F) Non-occupant Loans on < 5 Family Dwellings (A B C & D)
G) Loans On Manufactured Home Dwelling (A B C & D)
Number
Average Value
Number
Average Value
Number
Average Value
Number
Average Value
Number
Average Value
Number
Average Value
Number
Average Value
LOANS ORIGINATED
12
$99,243
91
$71,330
101
$73,664
14
$45,131
3
$870,337
24
$59,550
18
$75,864
APPLICATIONS APPROVED, NOT ACCEPTED
2
$70,740
17
$51,470
22
$78,706
1
$4,090
0
$0
3
$32,937
7
$64,227
APPLICATIONS DENIED
1
$45,800
51
$75,783
119
$73,898
19
$63,902
0
$0
11
$52,615
39
$69,800
APPLICATIONS WITHDRAWN
0
$0
6
$54,005
47
$81,873
3
$106,630
0
$0
2
$50,245
2
$67,060
FILES CLOSED FOR INCOMPLETENESS
0
$0
2
$91,700
14
$81,841
0
$0
0
$0
2
$36,010
2
$53,975
Aggregated Statistics For Year 2004 (Based on 4 partial tracts)
A) FHA, FSA/RHS & VA Home Purchase Loans
B) Conventional Home Purchase Loans
C) Refinancings
D) Home Improvement Loans
F) Non-occupant Loans on < 5 Family Dwellings (A B C & D)
G) Loans On Manufactured Home Dwelling (A B C & D)
Detailed PMIC statistics for the following Tracts:0407.00
, 0409.00
2002 - 2018 National Fire Incident Reporting System (NFIRS) incidents
According to the data from the years 2002 - 2018 the average number of fire incidents per year is 17. The highest number of fire incidents - 55 took place in 2014, and the least - 0 in 2003. The data has an increasing trend.
When looking into fire subcategories, the most incidents belonged to: Structure Fires (48.6%), and Outside Fires (29.5%).
Fire incident types reported to NFIRS in Zip Code 27027

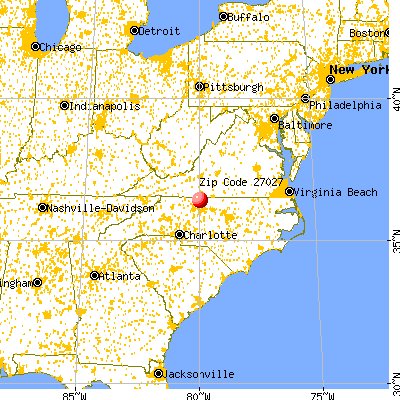


 Nearest zip codes: 27025, 27048, 27046, 27042, 24165, 27357.


 According to the data from the years 2002 - 2018 the average number of fire incidents per year is 17. The highest number of fire incidents - 55 took place in 2014, and the least - 0 in 2003. The data has an increasing trend.
 When looking into fire subcategories, the most incidents belonged to: Structure Fires (48.6%), and Outside Fires (29.5%).