Estimated zip code population in 2022: 3,268 Zip code population in 2010: 2,516 Zip code population in 2000: 2,064
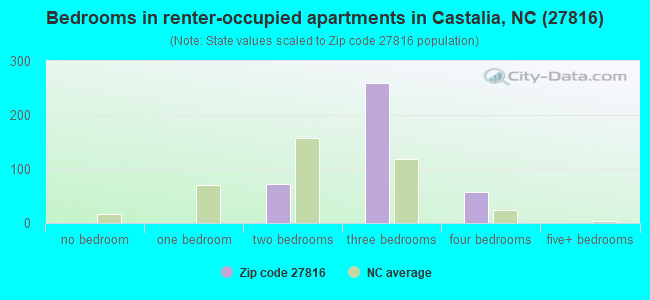
Houses and condos: 1,552 Renter-occupied apartments: 390
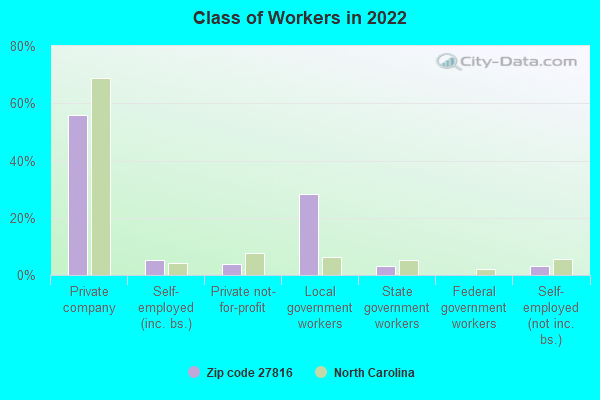
% of renters here:
29%
State:
33%
March 2022 cost of living index in zip code 27816: 81.6 (low, U.S. average is 100)
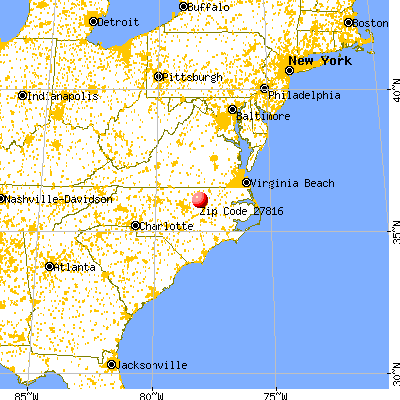
Land area: 60.5 sq. mi. Water area: 0.2 sq. mi.
Population density: 54 people per square mile
(very low).
OSM Map
General Map
Google Map
MSN Map
OSM Map
General Map
Google Map
MSN Map
OSM Map
General Map
Google Map
MSN Map
OSM Map
General Map
Google Map
MSN Map
Please wait while loading the map...
Real estate property taxes paid for housing units in 2022:
This zip code:
0.5% ($687)
North Carolina:
0.6% ($1,769)
Median real estate property taxes paid for housing units with mortgages in 2022: $631 (0.3%) Median real estate property taxes paid for housing units with no mortgage in 2022: $776 (0.5%)
Business Search- 14 Million verified businesses
Males: 1,310
(40.1%)
Females: 1,959
(59.9%)
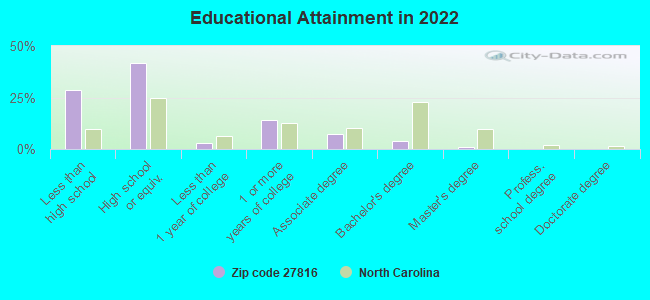
For population 25 years and over in 27816:
High school or higher: 67.6%
Bachelor's degree or higher: 5.0%
Graduate or professional degree: 1.1%
Unemployed: 11.3%
Mean travel time to work (commute): 28.6 minutes
For population 15 years and over in 27816:
Never married: 24.5%
Now married: 57.3%
Separated: 8.2%
Widowed: 4.4%
Divorced: 5.6%
Zip code 27816 compared to state average:
Median household income below state average.
Median house value below state average.
Unemployed percentage significantly above state average.
Black race population percentage above state average.
Median age significantly above state average.
Foreign-born population percentage below state average.
Length of stay since moving in significantly below state average.
Number of college students below state average.
Percentage of population with a bachelor's degree or higher significantly below state average.
Estimated median house/condo value in 2022: $134,506
27816:
$134,506
North Carolina:
$280,600
According to our research of North Carolina and other state lists, there were 6 registered sex offenders living in 27816 zip code as of May 28, 2024. The ratio of all residents to sex offenders in zip code 27816 is 386 to 1.
Median resident age:
This zip code:
52.0 years
North Carolina median age:
39.2 years
Average household size:
This zip code:
2.4 people
North Carolina:
2.4 people
Averages for the 2020 tax year for zip code 27816, filed in 2021:
Average Adjusted Gross Income (AGI) in 2020: $41,170 (Individual Income Tax Returns)
Here:
$41,170
State:
$70,020
Salary/wage: $37,266 (reported on 82.4% of returns)
Here:
$37,266
State:
$58,387
(% of AGI for various income ranges: 1255.9% for AGIs below $25k, 4021.9% for AGIs $25k-50k, 7102.5% for AGIs $50k-75k, 11252.5% for AGIs $75k-100k, 19708.0% for AGIs $100k-200k)
Taxable interest for individuals: $550 (reported on 22.4% of returns)
This zip code:
$550
North Carolina:
$1,479
(% of AGI for various income ranges: 6.5% for AGIs below $25k, 12.2% for AGIs $25k-50k, 43.3% for AGIs $50k-75k, 35.0% for AGIs $75k-100k, 62.0% for AGIs $100k-200k)
Ordinary dividends: $1,512 (reported on 6.4% of returns)
Here:
$1,512
State:
$7,888
(% of AGI for various income ranges: 10.0% for AGIs $25k-50k, 37.5% for AGIs $50k-75k, 98.0% for AGIs $100k-200k)
Net capital gain/loss in AGI: +$4,238 (reported on 6.4% of returns)
Here:
+$4,238
State:
+$23,652
(% of AGI for various income ranges: 27.6% for AGIs below $25k, 30.0% for AGIs $50k-75k, 402.0% for AGIs $100k-200k)
Profit/loss from business: +$6,126 (reported on 15.2% of returns)
Here:
+$6,126
State:
+$11,710
(% of AGI for various income ranges: 167.3% for AGIs below $25k, 84.8% for AGIs $25k-50k, 218.3% for AGIs $50k-75k, 135.0% for AGIs $75k-100k)
Taxable individual retirement arrangement distribution: $14,200 (reported on 6.4% of returns)
27816:
$14,200
North Carolina:
$20,247
(% of AGI for various income ranges: 31.4% for AGIs below $25k, 106.3% for AGIs $25k-50k, 1832.5% for AGIs $75k-100k)
Total itemized deductions: $24,100 (reported on 2.4% of returns)
Here:
$24,100
State:
$34,549
(% of AGI for various income ranges: 602.5% for AGIs $50k-75k)
Charity contributions: $9,950 (reported on 1.6% of returns)
Here:
$9,950
State:
$13,360
(% of AGI for various income ranges: 73.7% for AGIs $25k-50k)
Taxes paid: $6,000 (reported on 2.4% of returns)
27816:
$6,000
State:
$7,586
(% of AGI for various income ranges: 150.0% for AGIs $50k-75k)
Earned income credit: $2,191 (reported on 25.6% of returns)
Here:
$2,191
State:
$2,337
(% of AGI for various income ranges: 141.1% for AGIs below $25k, 66.3% for AGIs $25k-50k)
Percentage of individuals using paid preparers for their 2020 taxes: 88.8%
Here:
89%
State:
93%
(% for various income ranges: 88.9% for AGIs below $25k, 88.9% for AGIs $25k-50k, 88.9% for AGIs $50k-75k, 85.7% for AGIs $75k-100k, 90.0% for AGIs $100k-200k)
Averages for the 2012 tax year for zip code 27816, filed in 2013:
Average Adjusted Gross Income (AGI) in 2012: $35,124 (Individual Income Tax Returns)
Here:
$35,124
State:
$54,937
Salary/wage: $32,023 (reported on 86.5% of returns)
Here:
$32,023
State:
$46,336
(% of AGI for various income ranges: 75.1% for AGIs below $25k, 84.6% for AGIs $25k-50k, 79.9% for AGIs $50k-75k, 77.1% for AGIs $75k-100k, 72.2% for AGIs $100k-200k)
Taxable interest for individuals: $719 (reported on 23.4% of returns)
This zip code:
$719
North Carolina:
$1,298
(% of AGI for various income ranges: 0.5% for AGIs below $25k, 0.4% for AGIs $25k-50k, 0.3% for AGIs $50k-75k, 0.4% for AGIs $75k-100k, 0.8% for AGIs $100k-200k)
Ordinary dividends: $1,014 (reported on 6.3% of returns)
Here:
$1,014
State:
$6,213
Net capital gain/loss in AGI: +$1,090 (reported on 9.0% of returns)
Here:
+$1,090
State:
+$12,740
(% of AGI for various income ranges: 0.4% for AGIs below $25k, 0.3% for AGIs $25k-50k, 0.7% for AGIs $75k-100k)
Profit/loss from business: +$3,707 (reported on 13.5% of returns)
Here:
+$3,707
State:
+$10,311
(% of AGI for various income ranges: 6.5% for AGIs below $25k, 0.6% for AGIs $25k-50k, 0.4% for AGIs $50k-75k)
Taxable individual retirement arrangement distribution: $10,243 (reported on 6.3% of returns)
27816:
$10,243
North Carolina:
$15,575
(% of AGI for various income ranges: 1.9% for AGIs below $25k, 0.9% for AGIs $25k-50k, 6.1% for AGIs $50k-75k)
Total itemized deductions: $17,007 (28% of AGI, reported on 24.3% of returns)
Here:
$17,007
State:
$23,438
Here:
27.7% of AGI
State:
21.5% of AGI
(% of AGI for various income ranges: 7.0% for AGIs below $25k, 12.0% for AGIs $25k-50k, 14.0% for AGIs $50k-75k, 12.2% for AGIs $75k-100k, 13.4% for AGIs $100k-200k)
Charity contributions: $3,418 (reported on 19.8% of returns)
Here:
$3,418
State:
$4,687
(% of AGI for various income ranges: 1.1% for AGIs below $25k, 1.8% for AGIs $25k-50k, 2.2% for AGIs $50k-75k, 2.7% for AGIs $75k-100k, 2.0% for AGIs $100k-200k)
Taxes paid: $4,396 (reported on 24.3% of returns)
27816:
$4,396
State:
$8,823
(% of AGI for various income ranges: 0.8% for AGIs below $25k, 2.3% for AGIs $25k-50k, 3.3% for AGIs $50k-75k, 3.8% for AGIs $75k-100k, 5.8% for AGIs $100k-200k)
Earned income credit: $2,366 (reported on 31.5% of returns)
Here:
$2,366
State:
$2,376
(% of AGI for various income ranges: 9.3% for AGIs below $25k, 1.5% for AGIs $25k-50k)
Percentage of individuals using paid preparers for their 2012 taxes: 52.3%
Here:
52%
State:
53%
(% for various income ranges: 48.1% for AGIs below $25k, 48.6% for AGIs $25k-50k, 61.5% for AGIs $50k-75k, 66.7% for AGIs $75k-100k, 80.0% for AGIs $100k-200k)
Averages for the 2004 tax year for zip code 27816, filed in 2005:
Average Adjusted Gross Income (AGI) in 2004: $29,493 (Individual Income Tax Returns)
Here:
$29,493
State:
$45,376
Salary/wage: $28,064 (reported on 88.0% of returns)
Here:
$28,064
State:
$39,442
(% of AGI for various income ranges: 133.8% for AGIs below $10k, 83.4% for AGIs $10k-25k, 87.0% for AGIs $25k-50k, 84.5% for AGIs $50k-75k, 76.4% for AGIs $75k-100k, 68.9% for AGIs over 100k)
Taxable interest for individuals: $613 (reported on 26.4% of returns)
This zip code:
$613
North Carolina:
$1,515
(% of AGI for various income ranges: 3.7% for AGIs below $10k, 0.9% for AGIs $10k-25k, 0.4% for AGIs $25k-50k, 0.4% for AGIs $50k-75k, 0.3% for AGIs $75k-100k, 0.1% for AGIs over 100k)
Taxable dividends: $623 (reported on 7.1% of returns)
Here:
$623
State:
$4,016
(% of AGI for various income ranges: 0.3% for AGIs below $10k, 0.1% for AGIs $10k-25k, 0.2% for AGIs $25k-50k, 0.1% for AGIs $50k-75k, 0.4% for AGIs $75k-100k)
Net capital gain/loss: +$2,301 (reported on 6.7% of returns)
Here:
+$2,301
State:
+$11,152
(% of AGI for various income ranges: -0.9% for AGIs below $10k, 0.1% for AGIs $10k-25k, 0.9% for AGIs $25k-50k, 0.0% for AGIs $50k-75k, 2.1% for AGIs $75k-100k)
Profit/loss from business: +$4,016 (reported on 11.5% of returns)
Here:
+$4,016
State:
+$9,490
(% of AGI for various income ranges: -6.4% for AGIs below $10k, 3.0% for AGIs $10k-25k, 2.5% for AGIs $25k-50k, 0.1% for AGIs $50k-75k, 2.2% for AGIs $75k-100k)
IRA payment deduction: $2,917 (reported on 2.2% of returns)
27816:
$2,917
North Carolina:
$2,967
Total itemized deductions: $14,175 (26% of AGI, reported on 23.2% of returns)
Here:
$14,175
State:
$19,464
Here:
26.3% of AGI
State:
22.7% of AGI
(% of AGI for various income ranges: 7.6% for AGIs $10k-25k, 10.5% for AGIs $25k-50k, 13.3% for AGIs $50k-75k, 16.1% for AGIs $75k-100k, 12.5% for AGIs over 100k)
Charity contributions deductions: $2,906 (5% of AGI, reported on 20.5% of returns)
Here:
$2,906
State:
$4,035
Here:
5.2% of AGI
State:
4.5% of AGI
(% of AGI for various income ranges: 1.2% for AGIs $10k-25k, 1.7% for AGIs $25k-50k, 2.7% for AGIs $50k-75k, 3.7% for AGIs $75k-100k, 2.0% for AGIs over 100k)
Total tax: $3,330 (reported on 64.4% of returns)
27816:
$3,330
State:
$7,257
(% of AGI for various income ranges: 2.7% for AGIs below $10k, 3.2% for AGIs $10k-25k, 5.7% for AGIs $25k-50k, 8.8% for AGIs $50k-75k, 10.6% for AGIs $75k-100k, 15.0% for AGIs over 100k)
Earned income credit: $1,879 (reported on 31.3% of returns)
Here:
$1,879
State:
$1,851
Percentage of individuals using paid preparers for their 2004 taxes: 59.0%
Here:
59%
State:
62%
(% for various income ranges: 55.7% for AGIs below $10k, 60.8% for AGIs $10k-25k, 54.6% for AGIs $25k-50k, 60.5% for AGIs $50k-75k, 69.0% for AGIs $75k-100k, 87.0% for AGIs over 100k)
Household received Food Stamps/SNAP in the past 12 months: 738 Household did not receive Food Stamps/SNAP in the past 12 months: 672
Women who had a birth in the past 12 months: 2 (0 now married, 1 unmarried) Women who did not have a birth in the past 12 months: 779 (328 now married, 451 unmarried)
Housing units in zip code 27816 with a mortgage: 453 (15 second mortgage, 1 both second mortgage and home equity loan) Median monthly owner costs for units with a mortgage: $1,054 Median monthly owner costs for units without a mortgage: $432
Residents with income below the poverty level in 2022:
This zip code:
14.2%
Whole state:
12.8%
Residents with income below 50% of the poverty level in 2022:
This zip code:
5.0%
Whole state:
6.8%
Median number of rooms in houses and condos:
Here:
6.0
State:
6.4
Median number of rooms in apartments:
Here:
4.3
State:
4.4
Notable locations in this zip code not listed on our city pages
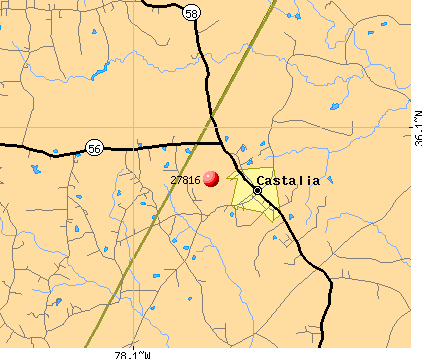
Churches in zip code 27816 include: Hickory Grove Church (A), Gilfield Church (B), Red Bud Church (C), Cedar Rock Church (D), Saint Delight Church (E). Display/hide their locations on the map
Streams, rivers, and creeks: Deer Branch (A), Wildcat Branch (B), Bear Creek (C), Terry Branch (D), Jumping Run (E), Shelley Branch (F), Red Bud Creek (G), Tumbling Run (H). Display/hide their locations on the map
Size of family households: 656 2-persons, 401 3-persons, 66 4-persons, 87 5-persons
Size of nonfamily households: 152 1-person
93.8% of residents of 27816 zip code speak English at home.
8.0% of residents speak Spanish at home (89% very well, 10% well, 1% not at all).
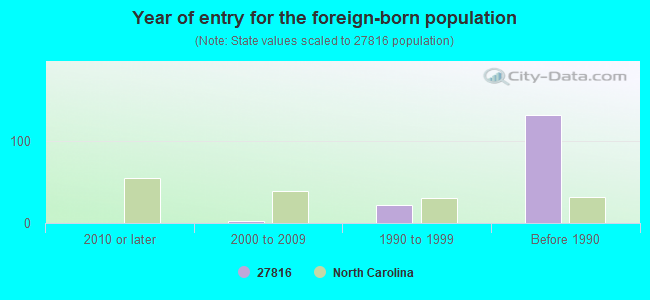
Foreign born population: 169 (5.2%) (83.7% of them are naturalized citizens)
This zip code:
5.2%
Whole state:
8.6%
90%Honduras
22%English
18%American
2%Italian
1%German
1%Scottish
0%European
Year of entry for the foreign-born population
02010 or later
22000 to 2009
221990 to 1999
132Before 1990
Housing units lacking complete plumbing facilities: 2.6% Housing units lacking complete kitchen facilities: 1.1%
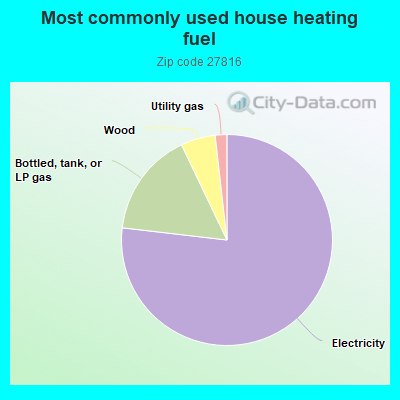
77.0%Electricity
16.1%Bottled, tank, or LP gas
5.3%Wood
1.8%Utility gas
Population in 1990: 2,623.
Place of birth for U.S.-born residents:
This state: 2,531
Northeast: 100
South: 429
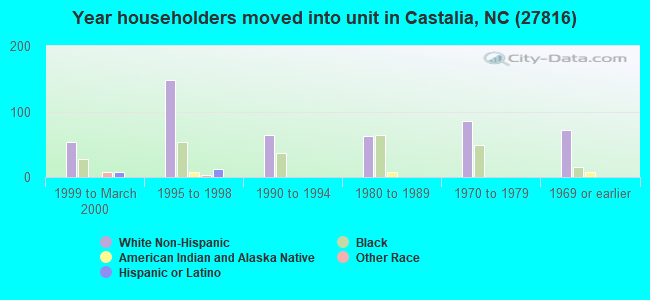
70% of the 27816 zip code residents lived in the same house 5 years ago. Out of people who lived in different houses, 49% lived in this county. Out of people who lived in different counties, 50% lived in North Carolina.
100% of the 27816 zip code residents lived in the same house 1 year ago. Out of people who lived in different houses, 222% moved from this county. Out of people who lived in different houses, 22% moved from different county within same state. Out of people who lived in different houses, 56% moved from abroad.
Private vs. public school enrollment:
Students in private schools in grades 1 to 8 (elementary and middle school): 14
Here:
4.4%
North Carolina:
13.8%
Students in private schools in grades 9 to 12 (high school):
Here:
0.0%
North Carolina:
11.9%
Students in private undergraduate colleges: 13
Here:
19.6%
North Carolina:
19.3%
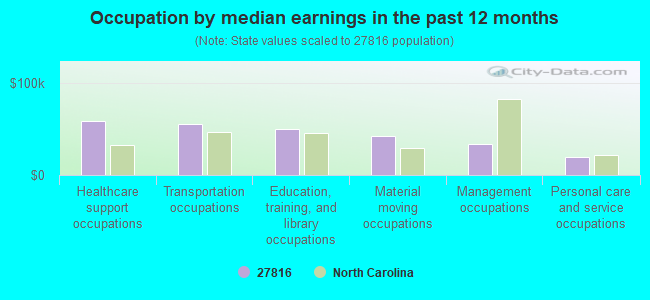
Occupation by median earnings in the past 12 months ($)
58,720Healthcare support occupations
55,492Transportation occupations
49,445Education, training, and library occupations
41,788Material moving occupations
33,467Management occupations
19,940Personal care and service occupations
Companies with federal contracts located in this zip code:
BENZ SILENT RIDER INC (7668 RACE TRACK RD in CASTALIA, NC; small business)
$15,670 with Army for Miscellaneous Vehicular Components. Taking place in CO. Signed on 2005-02-18. Completion date: 2005-03-18.
Top industries in this zip code by the number of employees in 2005:
Administrative and Support and Waste Management and Remediation Services: Landscaping Services (5-9 employees: 1 establishment, 1-4 employees: 2 establishments)
Other Services (except Public Administration): Religious Organizations (1-4: 4)
Accommodation and Food Services: Limited-Service Restaurants (1-4: 2)
Construction: Electrical Contractors (1-4: 1)
Other Services (except Public Administration): Commercial and Industrial Machinery and Equipment (except Automotive and Electronic) Repair and Maintenance (1-4: 1)
Fatal accident statistics in 2012:
Fatal accident count: 1
Vehicles involved in fatal accidents: 1
Fatal accidents caused by drunken drivers: 1
Fatalities: 1
Persons involved in fatal accidents: 1
Pedestrians involved in fatal accidents: 0
Home Mortgage Disclosure Act Aggregated Statistics For Year 2009 (Based on 6 partial tracts)
A) FHA, FSA/RHS & VA Home Purchase Loans
B) Conventional Home Purchase Loans
C) Refinancings
D) Home Improvement Loans
F) Non-occupant Loans on < 5 Family Dwellings (A B C & D)
G) Loans On Manufactured Home Dwelling (A B C & D)
Number
Average Value
Number
Average Value
Number
Average Value
Number
Average Value
Number
Average Value
Number
Average Value
LOANS ORIGINATED
12
$135,500
17
$162,640
55
$143,209
5
$78,256
8
$138,218
5
$74,824
APPLICATIONS APPROVED, NOT ACCEPTED
0
$0
0
$0
6
$146,150
2
$43,445
1
$180,690
0
$0
APPLICATIONS DENIED
4
$116,625
5
$124,346
30
$131,842
3
$24,713
3
$178,673
7
$71,903
APPLICATIONS WITHDRAWN
3
$138,920
4
$99,098
19
$136,057
0
$0
1
$103,760
4
$78,085
FILES CLOSED FOR INCOMPLETENESS
1
$134,260
0
$0
8
$127,598
0
$0
0
$0
2
$75,560
Aggregated Statistics For Year 2008 (Based on 6 partial tracts)
A) FHA, FSA/RHS & VA Home Purchase Loans
B) Conventional Home Purchase Loans
C) Refinancings
D) Home Improvement Loans
F) Non-occupant Loans on < 5 Family Dwellings (A B C & D)
G) Loans On Manufactured Home Dwelling (A B C & D)
Number
Average Value
Number
Average Value
Number
Average Value
Number
Average Value
Number
Average Value
Number
Average Value
LOANS ORIGINATED
14
$125,575
25
$119,286
41
$140,670
7
$78,307
13
$129,733
15
$80,004
APPLICATIONS APPROVED, NOT ACCEPTED
0
$0
2
$136,955
9
$98,790
0
$0
1
$80,560
5
$56,092
APPLICATIONS DENIED
4
$102,788
11
$107,629
45
$128,336
10
$35,359
4
$86,120
13
$63,175
APPLICATIONS WITHDRAWN
2
$94,385
5
$108,208
16
$143,162
0
$0
2
$108,860
2
$103,410
FILES CLOSED FOR INCOMPLETENESS
0
$0
0
$0
4
$165,862
1
$15,280
0
$0
0
$0
Aggregated Statistics For Year 2007 (Based on 6 partial tracts)
A) FHA, FSA/RHS & VA Home Purchase Loans
B) Conventional Home Purchase Loans
C) Refinancings
D) Home Improvement Loans
F) Non-occupant Loans on < 5 Family Dwellings (A B C & D)
G) Loans On Manufactured Home Dwelling (A B C & D)
Number
Average Value
Number
Average Value
Number
Average Value
Number
Average Value
Number
Average Value
Number
Average Value
LOANS ORIGINATED
9
$106,277
49
$124,381
45
$119,714
6
$67,458
12
$109,548
22
$70,915
APPLICATIONS APPROVED, NOT ACCEPTED
1
$74,900
6
$116,295
10
$85,296
0
$0
1
$230,570
5
$71,456
APPLICATIONS DENIED
2
$114,170
17
$113,958
60
$95,526
12
$58,112
6
$70,808
20
$58,986
APPLICATIONS WITHDRAWN
1
$87,810
5
$97,246
21
$100,296
3
$53,760
3
$51,180
5
$62,532
FILES CLOSED FOR INCOMPLETENESS
0
$0
2
$148,315
4
$185,725
0
$0
0
$0
0
$0
Aggregated Statistics For Year 2006 (Based on 6 partial tracts)
A) FHA, FSA/RHS & VA Home Purchase Loans
B) Conventional Home Purchase Loans
C) Refinancings
D) Home Improvement Loans
F) Non-occupant Loans on < 5 Family Dwellings (A B C & D)
G) Loans On Manufactured Home Dwelling (A B C & D)
Number
Average Value
Number
Average Value
Number
Average Value
Number
Average Value
Number
Average Value
Number
Average Value
LOANS ORIGINATED
8
$108,079
58
$120,869
54
$111,517
10
$59,052
18
$92,082
21
$75,176
APPLICATIONS APPROVED, NOT ACCEPTED
1
$118,390
9
$106,954
10
$104,725
1
$26,750
3
$134,860
4
$80,388
APPLICATIONS DENIED
2
$211,850
28
$76,365
59
$98,332
16
$48,958
9
$81,597
32
$64,611
APPLICATIONS WITHDRAWN
2
$134,395
8
$108,974
19
$104,117
3
$65,370
3
$87,147
3
$52,867
FILES CLOSED FOR INCOMPLETENESS
1
$101,500
4
$128,602
8
$99,101
0
$0
1
$162,130
1
$51,900
Aggregated Statistics For Year 2005 (Based on 6 partial tracts)
A) FHA, FSA/RHS & VA Home Purchase Loans
B) Conventional Home Purchase Loans
C) Refinancings
D) Home Improvement Loans
F) Non-occupant Loans on < 5 Family Dwellings (A B C & D)
G) Loans On Manufactured Home Dwelling (A B C & D)
Number
Average Value
Number
Average Value
Number
Average Value
Number
Average Value
Number
Average Value
Number
Average Value
LOANS ORIGINATED
6
$102,428
49
$112,221
55
$104,393
8
$57,229
18
$92,895
20
$74,188
APPLICATIONS APPROVED, NOT ACCEPTED
1
$75,870
10
$87,157
13
$95,219
2
$22,445
1
$148,870
6
$65,953
APPLICATIONS DENIED
2
$71,220
30
$66,228
69
$101,563
13
$47,693
4
$75,448
37
$65,470
APPLICATIONS WITHDRAWN
0
$0
6
$120,150
31
$122,180
2
$81,660
2
$130,540
10
$86,964
FILES CLOSED FOR INCOMPLETENESS
0
$0
0
$0
5
$111,556
0
$0
0
$0
0
$0
Aggregated Statistics For Year 2004 (Based on 6 partial tracts)
A) FHA, FSA/RHS & VA Home Purchase Loans
B) Conventional Home Purchase Loans
C) Refinancings
D) Home Improvement Loans
F) Non-occupant Loans on < 5 Family Dwellings (A B C & D)
G) Loans On Manufactured Home Dwelling (A B C & D)
Number
Average Value
Number
Average Value
Number
Average Value
Number
Average Value
Number
Average Value
Number
Average Value
LOANS ORIGINATED
7
$102,326
41
$113,823
56
$91,766
9
$36,228
12
$111,098
25
$73,518
APPLICATIONS APPROVED, NOT ACCEPTED
1
$79,710
9
$70,946
20
$85,502
2
$47,760
1
$108,480
10
$47,154
APPLICATIONS DENIED
4
$94,830
19
$76,603
58
$87,819
9
$34,179
1
$76,650
24
$71,792
APPLICATIONS WITHDRAWN
1
$110,310
10
$120,723
25
$103,965
2
$75,270
1
$176,020
4
$93,112
FILES CLOSED FOR INCOMPLETENESS
1
$72,710
1
$118,880
5
$110,482
0
$0
1
$269,050
1
$72,710
Aggregated Statistics For Year 2003 (Based on 6 partial tracts)
A) FHA, FSA/RHS & VA Home Purchase Loans
B) Conventional Home Purchase Loans
C) Refinancings
D) Home Improvement Loans
F) Non-occupant Loans on < 5 Family Dwellings (A B C & D)
Number
Average Value
Number
Average Value
Number
Average Value
Number
Average Value
Number
Average Value
LOANS ORIGINATED
5
$103,262
40
$86,490
103
$106,895
6
$12,278
12
$86,161
APPLICATIONS APPROVED, NOT ACCEPTED
0
$0
8
$63,908
17
$79,002
1
$29,440
2
$55,960
APPLICATIONS DENIED
3
$106,970
25
$72,773
71
$85,163
4
$34,780
2
$40,355
APPLICATIONS WITHDRAWN
3
$103,883
3
$97,133
24
$99,791
1
$12,310
1
$183,860
FILES CLOSED FOR INCOMPLETENESS
0
$0
3
$95,700
5
$101,988
0
$0
0
$0
Aggregated Statistics For Year 2002 (Based on 6 partial tracts)
A) FHA, FSA/RHS & VA Home Purchase Loans
B) Conventional Home Purchase Loans
C) Refinancings
D) Home Improvement Loans
F) Non-occupant Loans on < 5 Family Dwellings (A B C & D)
Number
Average Value
Number
Average Value
Number
Average Value
Number
Average Value
Number
Average Value
LOANS ORIGINATED
6
$111,860
34
$79,575
85
$102,136
7
$21,591
11
$86,504
APPLICATIONS APPROVED, NOT ACCEPTED
0
$0
11
$51,310
20
$75,326
1
$47,110
2
$47,360
APPLICATIONS DENIED
1
$77,640
32
$50,338
57
$79,281
6
$22,863
1
$97,100
APPLICATIONS WITHDRAWN
0
$0
5
$92,026
24
$82,530
2
$27,600
1
$63,150
FILES CLOSED FOR INCOMPLETENESS
0
$0
1
$69,190
5
$83,974
0
$0
0
$0
Aggregated Statistics For Year 2001 (Based on 6 partial tracts)
A) FHA, FSA/RHS & VA Home Purchase Loans
B) Conventional Home Purchase Loans
C) Refinancings
D) Home Improvement Loans
F) Non-occupant Loans on < 5 Family Dwellings (A B C & D)
Number
Average Value
Number
Average Value
Number
Average Value
Number
Average Value
Number
Average Value
LOANS ORIGINATED
6
$96,062
41
$84,076
64
$94,529
3
$12,323
11
$69,328
APPLICATIONS APPROVED, NOT ACCEPTED
0
$0
19
$45,513
14
$78,085
0
$0
1
$36,790
APPLICATIONS DENIED
2
$74,490
34
$46,497
49
$105,256
5
$24,766
3
$38,057
APPLICATIONS WITHDRAWN
2
$58,480
6
$79,258
21
$89,431
0
$0
0
$0
FILES CLOSED FOR INCOMPLETENESS
0
$0
0
$0
5
$96,618
0
$0
0
$0
Aggregated Statistics For Year 2000 (Based on 6 partial tracts)
A) FHA, FSA/RHS & VA Home Purchase Loans
B) Conventional Home Purchase Loans
C) Refinancings
D) Home Improvement Loans
F) Non-occupant Loans on < 5 Family Dwellings (A B C & D)
Number
Average Value
Number
Average Value
Number
Average Value
Number
Average Value
Number
Average Value
LOANS ORIGINATED
7
$95,016
37
$72,813
36
$72,889
11
$13,182
4
$68,892
APPLICATIONS APPROVED, NOT ACCEPTED
6
$40,387
14
$45,674
13
$64,879
1
$29,160
0
$0
APPLICATIONS DENIED
12
$39,252
49
$44,014
37
$66,595
5
$27,928
1
$70,630
APPLICATIONS WITHDRAWN
1
$81,560
3
$74,143
17
$70,939
1
$60,590
1
$43,880
FILES CLOSED FOR INCOMPLETENESS
0
$0
1
$40,650
4
$64,058
0
$0
0
$0
Aggregated Statistics For Year 1999 (Based on 3 partial tracts)
A) FHA, FSA/RHS & VA Home Purchase Loans
B) Conventional Home Purchase Loans
C) Refinancings
D) Home Improvement Loans
F) Non-occupant Loans on < 5 Family Dwellings (A B C & D)
2002 - 2018 National Fire Incident Reporting System (NFIRS) incidents
According to the data from the years 2002 - 2018 the average number of fires per year is 17. The highest number of reported fire incidents - 42 took place in 2011, and the least - 1 in 2003. The data has an increasing trend.
When looking into fire subcategories, the most reports belonged to: Structure Fires (43.2%), and Outside Fires (41.6%).
Fire incident types reported to NFIRS in Zip Code 27816


 Nearest zip codes: 27856, 27549, 27882, 27844, 27589, 27508.


 According to the data from the years 2002 - 2018 the average number of fires per year is 17. The highest number of reported fire incidents - 42 took place in 2011, and the least - 1 in 2003. The data has an increasing trend.
 When looking into fire subcategories, the most reports belonged to: Structure Fires (43.2%), and Outside Fires (41.6%).