Estimated zip code population in 2022: 3,996 Zip code population in 2010: 5,866 Zip code population in 2000: 6,282
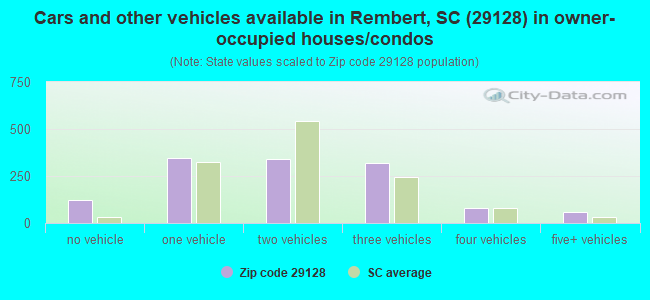
Houses and condos: 1,993 Renter-occupied apartments: 361
% of renters here:
22%
State:
28%
March 2022 cost of living index in zip code 29128: 80.7 (low, U.S. average is 100)
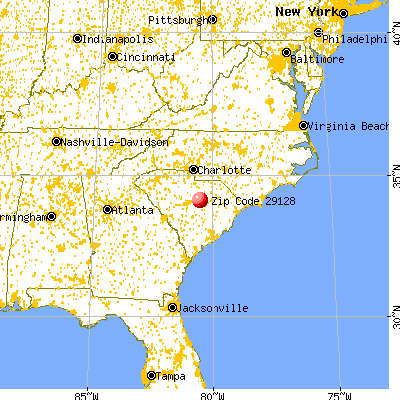
Land area: 108.0 sq. mi. Water area: 1.3 sq. mi.
Population density: 37 people per square mile
(very low).
OSM Map
General Map
Google Map
MSN Map
OSM Map
General Map
Google Map
MSN Map
OSM Map
General Map
Google Map
MSN Map
OSM Map
General Map
Google Map
MSN Map
Please wait while loading the map...
Real estate property taxes paid for housing units in 2022:
This zip code:
0.4% ($466)
South Carolina:
0.5% ($1,185)
Median real estate property taxes paid for housing units with mortgages in 2022: $898 (0.5%) Median real estate property taxes paid for housing units with no mortgage in 2022: $351 (0.3%)
Business Search- 14 Million verified businesses
Males: 2,169
(54.3%)
Females: 1,825
(45.7%)
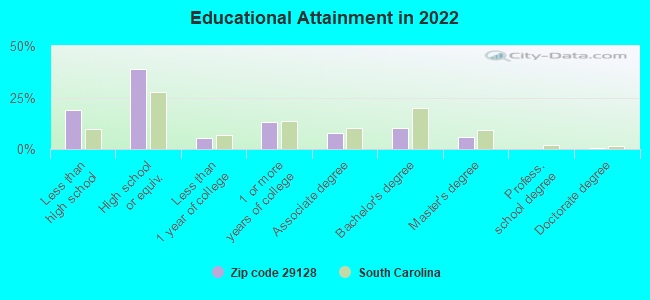
For population 25 years and over in 29128:
High school or higher: 78.4%
Bachelor's degree or higher: 15.6%
Graduate or professional degree: 6.0%
Unemployed: 5.4%
Mean travel time to work (commute): 34.3 minutes
For population 15 years and over in 29128:
Never married: 41.3%
Now married: 37.8%
Separated: 2.7%
Widowed: 11.5%
Divorced: 6.7%
Zip code 29128 compared to state average:
Median household income below state average.
Median house value below state average.
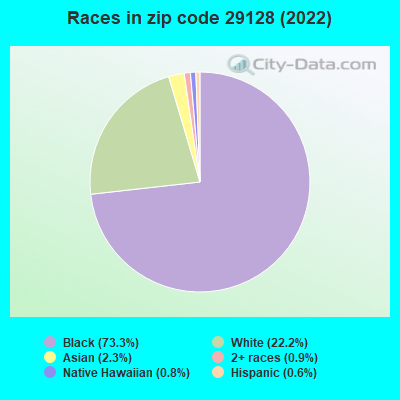
Black race population percentage above state average.
Hispanic race population percentage significantly below state average.
Median age above state average.
Foreign-born population percentage significantly below state average.
Length of stay since moving in significantly above state average.
Number of college students significantly below state average.
Percentage of population with a bachelor's degree or higher below state average.
Estimated median house/condo value in 2022: $114,346
29128:
$114,346
South Carolina:
$254,600
According to our research of South Carolina and other state lists, there were 4 registered sex offenders living in 29128 zip code as of May 28, 2024. The ratio of all residents to sex offenders in zip code 29128 is 1,403 to 1. The ratio of registered sex offenders to all residents in this zip code is near the state average.
Median resident age:
This zip code:
47.5 years
South Carolina median age:
40.5 years
Average household size:
This zip code:
2.0 people
South Carolina:
2.4 people
Averages for the 2020 tax year for zip code 29128, filed in 2021:
Average Adjusted Gross Income (AGI) in 2020: $43,357 (Individual Income Tax Returns)
Here:
$43,357
State:
$65,754
Salary/wage: $34,791 (reported on 84.2% of returns)
Here:
$34,791
State:
$52,566
(% of AGI for various income ranges: 1281.5% for AGIs below $25k, 4202.3% for AGIs $25k-50k, 8027.5% for AGIs $50k-75k, 9163.3% for AGIs $75k-100k, 20264.0% for AGIs $100k-200k)
Taxable interest for individuals: $503 (reported on 14.3% of returns)
This zip code:
$503
South Carolina:
$1,749
(% of AGI for various income ranges: 1.8% for AGIs below $25k, 1.3% for AGIs $25k-50k, 19.2% for AGIs $50k-75k, 13.3% for AGIs $75k-100k, 192.0% for AGIs $100k-200k)
Ordinary dividends: $9,423 (reported on 6.4% of returns)
Here:
$9,423
State:
$8,783
(% of AGI for various income ranges: 8.6% for AGIs below $25k, 159.2% for AGIs $50k-75k, 1942.0% for AGIs $100k-200k)
Net capital gain/loss in AGI: +$10,733 (reported on 5.9% of returns)
Here:
+$10,733
State:
+$24,194
(% of AGI for various income ranges: 4.0% for AGIs below $25k, 280.8% for AGIs $50k-75k, 1844.0% for AGIs $100k-200k)
Profit/loss from business: +$4,107 (reported on 14.3% of returns)
Here:
+$4,107
State:
+$11,253
(% of AGI for various income ranges: 62.2% for AGIs below $25k, 104.2% for AGIs $50k-75k, 723.3% for AGIs $75k-100k, 564.0% for AGIs $100k-200k)
Taxable individual retirement arrangement distribution: $20,722 (reported on 4.4% of returns)
29128:
$20,722
South Carolina:
$21,604
(% of AGI for various income ranges: 19.5% for AGIs below $25k, 83.2% for AGIs $25k-50k, 2220.0% for AGIs $75k-100k)
Total itemized deductions: $41,312 (reported on 3.9% of returns)
Here:
$41,312
State:
$35,199
(% of AGI for various income ranges: 107.4% for AGIs $25k-50k, 808.3% for AGIs $50k-75k, 3660.0% for AGIs $100k-200k)
Charity contributions: $14,488 (reported on 3.9% of returns)
Here:
$14,488
State:
$14,319
(% of AGI for various income ranges: 10.3% for AGIs below $25k, 301.7% for AGIs $50k-75k, 1444.0% for AGIs $100k-200k)
Taxes paid: $6,278 (reported on 4.4% of returns)
29128:
$6,278
State:
$7,486
(% of AGI for various income ranges: 15.1% for AGIs $25k-50k, 135.8% for AGIs $50k-75k, 662.0% for AGIs $100k-200k)
Earned income credit: $2,552 (reported on 31.5% of returns)
Here:
$2,552
State:
$2,397
(% of AGI for various income ranges: 156.6% for AGIs below $25k, 104.3% for AGIs $25k-50k)
Percentage of individuals using paid preparers for their 2020 taxes: 91.6%
Here:
92%
State:
93%
(% for various income ranges: 90.4% for AGIs below $25k, 90.6% for AGIs $25k-50k, 95.2% for AGIs $50k-75k, 90.0% for AGIs $75k-100k, 100.0% for AGIs $100k-200k, 100.0% for AGIs over 200k)
Averages for the 2012 tax year for zip code 29128, filed in 2013:
Average Adjusted Gross Income (AGI) in 2012: $31,487 (Individual Income Tax Returns)
Here:
$31,487
State:
$51,133
Salary/wage: $27,534 (reported on 87.4% of returns)
Here:
$27,534
State:
$42,173
(% of AGI for various income ranges: 82.0% for AGIs below $25k, 84.7% for AGIs $25k-50k, 76.3% for AGIs $50k-75k, 68.9% for AGIs $75k-100k, 60.1% for AGIs $100k-200k)
Taxable interest for individuals: $465 (reported on 15.0% of returns)
This zip code:
$465
South Carolina:
$1,468
(% of AGI for various income ranges: 0.2% for AGIs below $25k, 0.1% for AGIs $25k-50k, 0.4% for AGIs $50k-75k, 0.2% for AGIs $75k-100k, 0.2% for AGIs $100k-200k)
Ordinary dividends: $2,277 (reported on 6.3% of returns)
Here:
$2,277
State:
$6,511
(% of AGI for various income ranges: 0.6% for AGIs below $25k, 1.2% for AGIs $50k-75k, 0.8% for AGIs $100k-200k)
Net capital gain/loss in AGI: +$10,822 (reported on 4.4% of returns)
Here:
+$10,822
State:
+$13,061
(% of AGI for various income ranges: 1.2% for AGIs $50k-75k, 12.6% for AGIs $75k-100k)
Profit/loss from business: +$4,615 (reported on 12.6% of returns)
Here:
+$4,615
State:
+$10,167
(% of AGI for various income ranges: 4.8% for AGIs below $25k, 0.9% for AGIs $25k-50k, 3.9% for AGIs $75k-100k)
Taxable individual retirement arrangement distribution: $12,989 (reported on 4.4% of returns)
29128:
$12,989
South Carolina:
$17,019
(% of AGI for various income ranges: 1.1% for AGIs below $25k, 2.2% for AGIs $25k-50k, 8.0% for AGIs $75k-100k)
Total itemized deductions: $18,414 (27% of AGI, reported on 17.5% of returns)
Here:
$18,414
State:
$22,890
Here:
27.0% of AGI
State:
21.4% of AGI
(% of AGI for various income ranges: 4.3% for AGIs below $25k, 9.9% for AGIs $25k-50k, 12.1% for AGIs $50k-75k, 14.6% for AGIs $75k-100k, 14.6% for AGIs $100k-200k)
Charity contributions: $3,953 (reported on 15.5% of returns)
Here:
$3,953
State:
$5,169
(% of AGI for various income ranges: 0.8% for AGIs below $25k, 1.9% for AGIs $25k-50k, 2.4% for AGIs $50k-75k, 2.5% for AGIs $75k-100k, 2.8% for AGIs $100k-200k)
Taxes paid: $4,897 (reported on 17.5% of returns)
29128:
$4,897
State:
$7,644
(% of AGI for various income ranges: 0.7% for AGIs below $25k, 2.0% for AGIs $25k-50k, 3.0% for AGIs $50k-75k, 4.2% for AGIs $75k-100k, 5.5% for AGIs $100k-200k)
Earned income credit: $2,656 (reported on 38.8% of returns)
Here:
$2,656
State:
$2,418
(% of AGI for various income ranges: 11.2% for AGIs below $25k, 1.6% for AGIs $25k-50k)
Percentage of individuals using paid preparers for their 2012 taxes: 56.3%
Here:
56%
State:
57%
(% for various income ranges: 54.2% for AGIs below $25k, 54.4% for AGIs $25k-50k, 62.5% for AGIs $50k-75k, 75.0% for AGIs $75k-100k, 71.4% for AGIs $100k-200k)
Averages for the 2004 tax year for zip code 29128, filed in 2005:
Average Adjusted Gross Income (AGI) in 2004: $27,754 (Individual Income Tax Returns)
Here:
$27,754
State:
$41,965
Salary/wage: $24,365 (reported on 91.2% of returns)
Here:
$24,365
State:
$35,695
(% of AGI for various income ranges: 115.5% for AGIs below $10k, 88.5% for AGIs $10k-25k, 87.6% for AGIs $25k-50k, 79.8% for AGIs $50k-75k, 79.6% for AGIs $75k-100k, 43.9% for AGIs over 100k)
Taxable interest for individuals: $752 (reported on 20.8% of returns)
This zip code:
$752
South Carolina:
$1,623
(% of AGI for various income ranges: 0.8% for AGIs below $10k, 0.6% for AGIs $10k-25k, 0.4% for AGIs $25k-50k, 1.0% for AGIs $50k-75k, 0.5% for AGIs $75k-100k, 0.4% for AGIs over 100k)
Taxable dividends: $2,206 (reported on 7.6% of returns)
Here:
$2,206
State:
$3,999
(% of AGI for various income ranges: 2.7% for AGIs below $10k, 0.7% for AGIs $10k-25k, 0.2% for AGIs $25k-50k, 0.2% for AGIs $50k-75k, 0.8% for AGIs $75k-100k, 1.1% for AGIs over 100k)
Net capital gain/loss: +$4,056 (reported on 6.0% of returns)
Here:
+$4,056
State:
+$13,100
(% of AGI for various income ranges: 1.8% for AGIs below $10k, 0.1% for AGIs $10k-25k, 0.1% for AGIs $25k-50k, 0.9% for AGIs $50k-75k, 0.3% for AGIs $75k-100k, 3.7% for AGIs over 100k)
Profit/loss from business: +$2,111 (reported on 9.0% of returns)
Here:
+$2,111
State:
+$9,144
(% of AGI for various income ranges: 5.8% for AGIs below $10k, 1.5% for AGIs $10k-25k, -0.2% for AGIs $25k-50k, 0.2% for AGIs $50k-75k, 0.5% for AGIs $75k-100k, 0.6% for AGIs over 100k)
IRA payment deduction: $2,000 (reported on 0.6% of returns)
29128:
$2,000
South Carolina:
$2,972
Total itemized deductions: $15,760 (26% of AGI, reported on 18.7% of returns)
Here:
$15,760
State:
$19,039
Here:
26.1% of AGI
State:
22.8% of AGI
(% of AGI for various income ranges: 6.4% for AGIs $10k-25k, 10.5% for AGIs $25k-50k, 14.9% for AGIs $50k-75k, 13.9% for AGIs $75k-100k, 13.3% for AGIs over 100k)
Charity contributions deductions: $3,318 (6% of AGI, reported on 17.1% of returns)
Here:
$3,318
State:
$4,305
Here:
6.0% of AGI
State:
5.0% of AGI
(% of AGI for various income ranges: 1.0% for AGIs $10k-25k, 2.1% for AGIs $25k-50k, 3.6% for AGIs $50k-75k, 3.6% for AGIs $75k-100k, 1.5% for AGIs over 100k)
Total tax: $3,166 (reported on 57.0% of returns)
29128:
$3,166
State:
$6,497
(% of AGI for various income ranges: 2.0% for AGIs below $10k, 2.4% for AGIs $10k-25k, 5.3% for AGIs $25k-50k, 8.7% for AGIs $50k-75k, 10.5% for AGIs $75k-100k, 11.6% for AGIs over 100k)
Earned income credit: $1,892 (reported on 40.8% of returns)
Here:
$1,892
State:
$1,882
Percentage of individuals using paid preparers for their 2004 taxes: 71.1%
Here:
71%
State:
66%
(% for various income ranges: 69.5% for AGIs below $10k, 72.6% for AGIs $10k-25k, 70.0% for AGIs $25k-50k, 69.2% for AGIs $50k-75k, 70.8% for AGIs $75k-100k, 83.3% for AGIs over 100k)
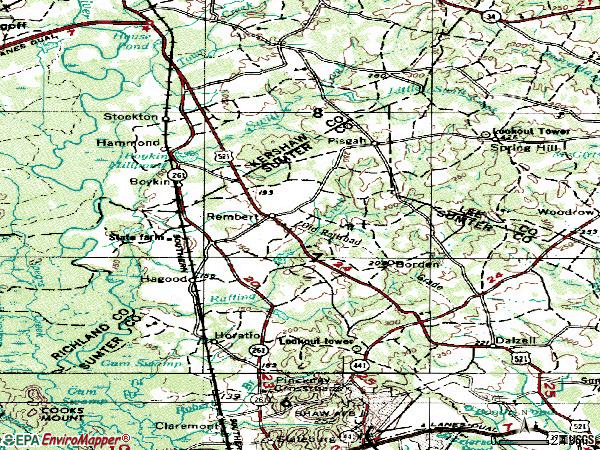
Notable locations in zip code 29128: South Carolina Penitentiary State Farm Number One (A), Ancrum Ferry (B), Wannah Plantation (C), Kershaw County Fire Department Boykin (D), Sumter County Rural Fire Department Rembert (E). Display/hide their locations on the map
Churches in zip code 29128 include: Pisgah Church (A), Pine Grove Church (B), New Hope Church (C), Union Church (D), Bethesda Church (E), Mount Calvary Church (F), Mount Bethel Church (G), Good Hope Church (H), Church of the Ascension (I). Display/hide their locations on the map
Cemeteries: Union Cemetery (1), Sand Hill Cemetery (2), Boykin Cemetery (3), Mount Carmel Cemetery (4), Elizabeth Cemetery (5). Display/hide their locations on the map
Lakes and reservoirs: Ruggs Lake (A), McDuffie Pond (B), Harvins Pond (C), Buckingham Landing Pond (D), Boykin Mill Pond (E), Ellerbees Millpond (F), McLeods Pond (G), Boykin Millpond (H). Display/hide their locations on the map
In group quarters: 733 (-1 institutionalized population)
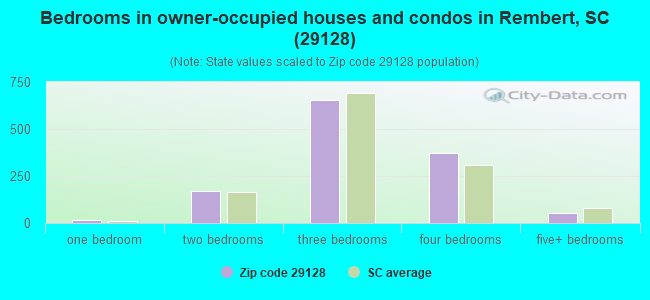
Size of family households: 518 2-persons, 157 3-persons, 46 4-persons, 115 5-persons, 16 6-persons
Size of nonfamily households: 753 1-person, 8 2-persons
126 married couples with children.
364 single-parent households (98 men, 266 women).
95.7% of residents of 29128 zip code speak English at home.
1.0% of residents speak Spanish at home (92% very well, 5% not well, 2% not at all).
0.3% of residents speak other Indo-European language at home (100% very well).
2.0% of residents speak Asian or Pacific Island language at home (100% very well).
0.7% of residents speak other language at home (22% very well, 78% well).
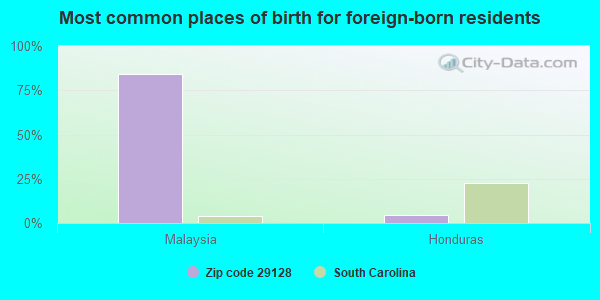
Foreign born population: 93 (2.3%) (95.0% of them are naturalized citizens)
This zip code:
2.3%
Whole state:
5.2%
84%Malaysia
5%Honduras
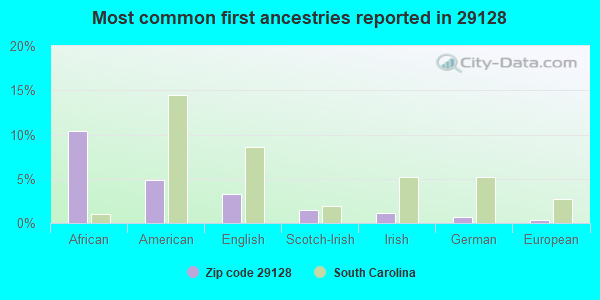
10%African
5%American
3%English
1%Scotch-Irish
1%Irish
1%German
0%European
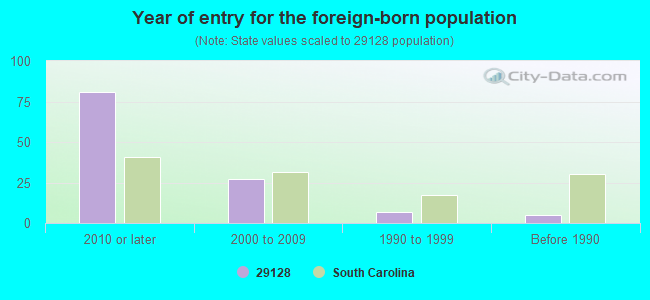
Year of entry for the foreign-born population
812010 or later
272000 to 2009
71990 to 1999
5Before 1990
Housing units lacking complete plumbing facilities: 0.6%
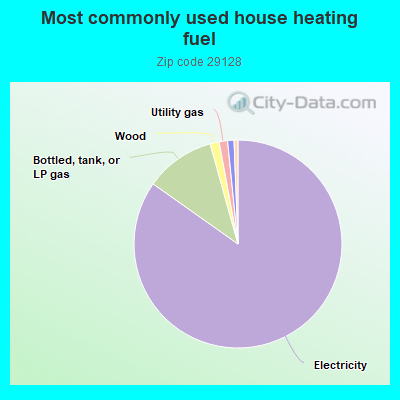
84.9%Electricity
10.9%Bottled, tank, or LP gas
1.4%Wood
1.3%Utility gas
1.0%Fuel oil, kerosene, etc.
0.6%No fuel used
Population in 1990: 5,577. Population change in the 1990s: +705 (+12.6%).
Place of birth for U.S.-born residents:
This state: 3,112
Northeast: 388
Midwest: 39
South: 247
West: 35
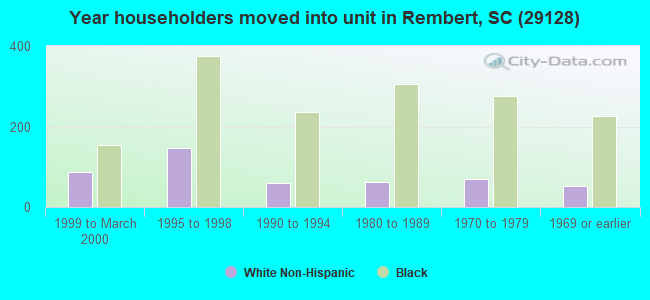
66% of the 29128 zip code residents lived in the same house 5 years ago. Out of people who lived in different houses, 38% lived in this county. Out of people who lived in different counties, 50% lived in South Carolina.
96% of the 29128 zip code residents lived in the same house 1 year ago. Out of people who lived in different houses, 16% moved from this county. Out of people who lived in different houses, 75% moved from different county within same state. Out of people who lived in different houses, 5% moved from different state. Out of people who lived in different houses, 4% moved from abroad.
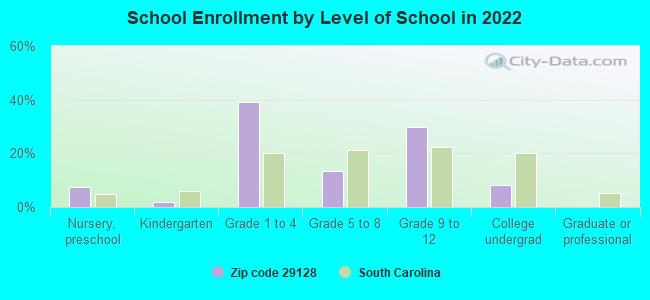
Private vs. public school enrollment:
Students in private schools in grades 1 to 8 (elementary and middle school): 19
Here:
6.2%
South Carolina:
14.4%
Students in private schools in grades 9 to 12 (high school): 38
Here:
21.0%
South Carolina:
11.1%
Students in private undergraduate colleges: 8
Here:
15.5%
South Carolina:
21.9%
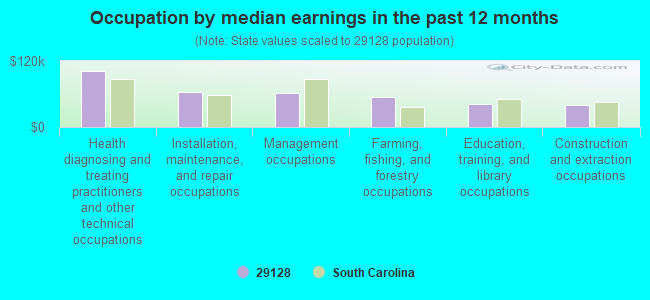
Occupation by median earnings in the past 12 months ($)
101,266Health diagnosing and treating practitioners and other technical occupations
63,310Installation, maintenance, and repair occupations
61,960Management occupations
53,815Farming, fishing, and forestry occupations
42,601Education, training, and library occupations
40,564Construction and extraction occupations
Top industries in this zip code by the number of employees in 2005:
Construction: Poured Concrete Foundation and Structure Contractors (20-49 employees: 1 establishment, 5-9 employees: 1 establishment, 1-4 employees: 1 establishment)
Accommodation and Food Services: Snack and Nonalcoholic Beverage Bars (20-49: 1)
Accommodation and Food Services: Full-Service Restaurants (10-19: 1, 1-4: 1)
Wholesale Trade: Other Construction Material Merchant Wholesalers (10-19: 1)
Other Services (except Public Administration): Religious Organizations (5-9: 2)
Construction: Painting and Wall Covering Contractors (5-9: 1)
Other Services (except Public Administration): Grantmaking Foundations (1-4: 1)
Construction: New Multifamily Housing Construction (except Operative Builders) (1-4: 1)
People in group quarters in 2010:
861 people in state prisons
12 people in workers' group living quarters and job corps centers
People in group quarters in 2000:
748 people in state prisons
Fatal accident statistics in 2014:
Fatal accident count: 1
Vehicles involved in fatal accidents: 1
Fatal accidents caused by drunken drivers: 1
Fatalities: 1
Persons involved in fatal accidents: 1
Pedestrians involved in fatal accidents: 0
Fatal accident statistics in 2013:
Fatal accident count: 4
Vehicles involved in fatal accidents: 5
Fatal accidents caused by drunken drivers: 4
Fatalities: 4
Persons involved in fatal accidents: 5
Pedestrians involved in fatal accidents: 0
Home Mortgage Disclosure Act Aggregated Statistics For Year 2009 (Based on 2 full and 8 partial tracts)
A) FHA, FSA/RHS & VA Home Purchase Loans
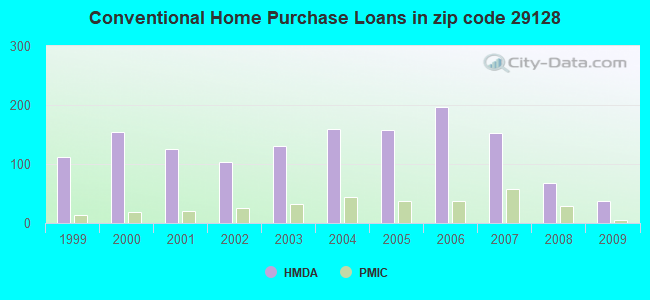
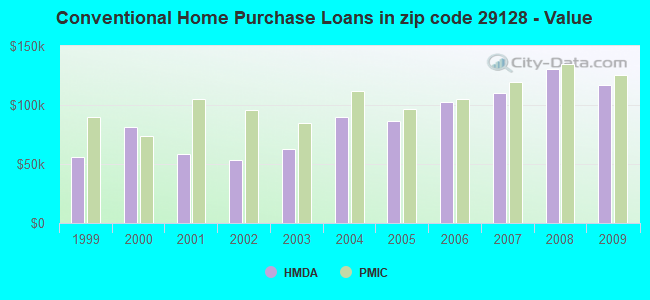
B) Conventional Home Purchase Loans
C) Refinancings
D) Home Improvement Loans
F) Non-occupant Loans on < 5 Family Dwellings (A B C & D)
G) Loans On Manufactured Home Dwelling (A B C & D)
Number
Average Value
Number
Average Value
Number
Average Value
Number
Average Value
Number
Average Value
Number
Average Value
LOANS ORIGINATED
96
$138,175
38
$117,256
225
$147,893
3
$45,993
31
$119,437
22
$56,083
APPLICATIONS APPROVED, NOT ACCEPTED
2
$138,170
11
$67,092
17
$173,009
1
$6,830
4
$57,558
11
$57,563
APPLICATIONS DENIED
11
$122,673
51
$70,141
96
$117,573
15
$20,605
8
$38,912
47
$50,441
APPLICATIONS WITHDRAWN
13
$125,698
13
$81,422
65
$140,244
5
$33,418
8
$104,408
5
$40,660
FILES CLOSED FOR INCOMPLETENESS
3
$107,187
1
$64,840
15
$129,555
0
$0
5
$105,278
0
$0
Aggregated Statistics For Year 2008 (Based on 2 full and 8 partial tracts)
A) FHA, FSA/RHS & VA Home Purchase Loans
B) Conventional Home Purchase Loans
C) Refinancings
D) Home Improvement Loans
E) Loans on Dwellings For 5+ Families
F) Non-occupant Loans on < 5 Family Dwellings (A B C & D)
G) Loans On Manufactured Home Dwelling (A B C & D)
Number
Average Value
Number
Average Value
Number
Average Value
Number
Average Value
Number
Average Value
Number
Average Value
Number
Average Value
LOANS ORIGINATED
74
$127,088
67
$130,158
169
$141,038
30
$39,538
1
$692,710
32
$145,947
32
$67,910
APPLICATIONS APPROVED, NOT ACCEPTED
1
$43,630
19
$60,759
34
$102,656
6
$10,868
0
$0
9
$69,663
17
$54,107
APPLICATIONS DENIED
7
$111,897
66
$68,826
189
$94,562
26
$47,842
0
$0
14
$81,065
73
$59,640
APPLICATIONS WITHDRAWN
11
$96,472
9
$141,188
59
$127,356
12
$73,348
0
$0
4
$65,147
9
$69,160
FILES CLOSED FOR INCOMPLETENESS
1
$71,830
0
$0
13
$153,885
0
$0
0
$0
1
$141,150
0
$0
Aggregated Statistics For Year 2007 (Based on 2 full and 8 partial tracts)
A) FHA, FSA/RHS & VA Home Purchase Loans
B) Conventional Home Purchase Loans
C) Refinancings
D) Home Improvement Loans
F) Non-occupant Loans on < 5 Family Dwellings (A B C & D)
G) Loans On Manufactured Home Dwelling (A B C & D)
Number
Average Value
Number
Average Value
Number
Average Value
Number
Average Value
Number
Average Value
Number
Average Value
LOANS ORIGINATED
52
$111,335
153
$110,274
195
$128,118
44
$25,579
58
$104,384
53
$51,652
APPLICATIONS APPROVED, NOT ACCEPTED
3
$59,857
27
$90,880
42
$83,745
11
$31,439
9
$87,633
16
$59,706
APPLICATIONS DENIED
4
$93,472
79
$61,059
184
$94,818
72
$40,832
17
$102,394
72
$51,044
APPLICATIONS WITHDRAWN
3
$118,843
25
$96,685
86
$113,069
7
$31,883
6
$57,147
8
$57,461
FILES CLOSED FOR INCOMPLETENESS
1
$89,330
5
$90,420
20
$98,797
4
$44,802
2
$87,765
1
$57,080
Aggregated Statistics For Year 2006 (Based on 2 full and 8 partial tracts)
A) FHA, FSA/RHS & VA Home Purchase Loans
B) Conventional Home Purchase Loans
C) Refinancings
D) Home Improvement Loans
F) Non-occupant Loans on < 5 Family Dwellings (A B C & D)
G) Loans On Manufactured Home Dwelling (A B C & D)
Number
Average Value
Number
Average Value
Number
Average Value
Number
Average Value
Number
Average Value
Number
Average Value
LOANS ORIGINATED
62
$116,177
197
$102,172
200
$106,631
42
$33,322
74
$96,429
41
$48,103
APPLICATIONS APPROVED, NOT ACCEPTED
3
$105,753
28
$86,185
36
$82,678
6
$34,693
5
$82,742
19
$59,126
APPLICATIONS DENIED
3
$120,070
86
$61,741
225
$95,477
57
$44,886
22
$75,550
91
$50,417
APPLICATIONS WITHDRAWN
4
$115,462
34
$97,627
86
$93,754
9
$69,549
7
$95,893
5
$72,552
FILES CLOSED FOR INCOMPLETENESS
2
$104,530
6
$120,038
24
$121,750
0
$0
0
$0
0
$0
Aggregated Statistics For Year 2005 (Based on 2 full and 8 partial tracts)
A) FHA, FSA/RHS & VA Home Purchase Loans
B) Conventional Home Purchase Loans
C) Refinancings
D) Home Improvement Loans
F) Non-occupant Loans on < 5 Family Dwellings (A B C & D)
G) Loans On Manufactured Home Dwelling (A B C & D)
Number
Average Value
Number
Average Value
Number
Average Value
Number
Average Value
Number
Average Value
Number
Average Value
LOANS ORIGINATED
56
$112,872
158
$86,141
184
$95,725
30
$44,701
39
$96,413
41
$47,989
APPLICATIONS APPROVED, NOT ACCEPTED
3
$100,390
17
$78,712
50
$78,460
10
$26,561
6
$84,472
19
$50,447
APPLICATIONS DENIED
8
$70,029
88
$67,024
276
$78,687
69
$39,363
21
$54,872
112
$55,517
APPLICATIONS WITHDRAWN
2
$109,305
58
$72,424
159
$94,694
11
$140,088
23
$95,287
51
$71,292
FILES CLOSED FOR INCOMPLETENESS
3
$93,263
7
$84,249
35
$130,341
1
$92,210
2
$70,230
1
$54,400
Aggregated Statistics For Year 2004 (Based on 2 full and 8 partial tracts)
A) FHA, FSA/RHS & VA Home Purchase Loans
B) Conventional Home Purchase Loans
C) Refinancings
D) Home Improvement Loans
F) Non-occupant Loans on < 5 Family Dwellings (A B C & D)
G) Loans On Manufactured Home Dwelling (A B C & D)
Number
Average Value
Number
Average Value
Number
Average Value
Number
Average Value
Number
Average Value
Number
Average Value
LOANS ORIGINATED
36
$104,704
160
$90,126
233
$92,583
24
$34,432
48
$70,499
62
$50,159
APPLICATIONS APPROVED, NOT ACCEPTED
1
$23,770
28
$68,971
51
$88,197
6
$26,558
7
$95,934
24
$61,387
APPLICATIONS DENIED
2
$85,350
80
$65,522
283
$78,553
44
$36,135
23
$88,314
90
$51,894
APPLICATIONS WITHDRAWN
8
$93,666
26
$98,187
88
$86,319
7
$16,923
7
$131,634
12
$56,527
FILES CLOSED FOR INCOMPLETENESS
1
$81,410
8
$125,641
37
$93,716
4
$30,608
3
$64,273
2
$58,640
Aggregated Statistics For Year 2003 (Based on 2 full and 4 partial tracts)
A) FHA, FSA/RHS & VA Home Purchase Loans
B) Conventional Home Purchase Loans
C) Refinancings
D) Home Improvement Loans
F) Non-occupant Loans on < 5 Family Dwellings (A B C & D)
Number
Average Value
Number
Average Value
Number
Average Value
Number
Average Value
Number
Average Value
LOANS ORIGINATED
65
$95,733
131
$62,656
292
$80,200
11
$21,872
37
$53,163
APPLICATIONS APPROVED, NOT ACCEPTED
6
$67,560
89
$42,765
59
$67,764
6
$32,667
6
$48,072
APPLICATIONS DENIED
11
$31,997
206
$43,785
250
$78,724
33
$24,895
16
$97,197
APPLICATIONS WITHDRAWN
2
$83,155
17
$88,465
98
$85,578
2
$20,360
8
$142,551
FILES CLOSED FOR INCOMPLETENESS
0
$0
2
$100,495
36
$103,576
0
$0
2
$42,085
Aggregated Statistics For Year 2002 (Based on 2 full and 4 partial tracts)
A) FHA, FSA/RHS & VA Home Purchase Loans
B) Conventional Home Purchase Loans
C) Refinancings
D) Home Improvement Loans
F) Non-occupant Loans on < 5 Family Dwellings (A B C & D)
Number
Average Value
Number
Average Value
Number
Average Value
Number
Average Value
Number
Average Value
LOANS ORIGINATED
60
$86,837
103
$53,071
170
$79,777
12
$14,047
19
$72,057
APPLICATIONS APPROVED, NOT ACCEPTED
5
$45,184
68
$40,836
70
$73,601
8
$31,376
3
$84,123
APPLICATIONS DENIED
4
$77,568
159
$45,061
255
$75,986
19
$17,514
5
$290,054
APPLICATIONS WITHDRAWN
5
$108,622
9
$67,374
58
$91,309
9
$19,738
3
$53,430
FILES CLOSED FOR INCOMPLETENESS
0
$0
4
$67,785
14
$76,993
0
$0
1
$46,110
Aggregated Statistics For Year 2001 (Based on 2 full and 4 partial tracts)
A) FHA, FSA/RHS & VA Home Purchase Loans
B) Conventional Home Purchase Loans
C) Refinancings
D) Home Improvement Loans
F) Non-occupant Loans on < 5 Family Dwellings (A B C & D)
Number
Average Value
Number
Average Value
Number
Average Value
Number
Average Value
Number
Average Value
LOANS ORIGINATED
35
$96,526
126
$58,540
135
$70,707
22
$24,265
18
$79,152
APPLICATIONS APPROVED, NOT ACCEPTED
1
$70,600
38
$31,151
37
$50,365
3
$31,470
1
$60,120
APPLICATIONS DENIED
5
$89,916
152
$40,634
238
$61,940
31
$9,753
6
$21,233
APPLICATIONS WITHDRAWN
2
$63,510
15
$77,451
73
$58,764
14
$15,184
2
$28,000
FILES CLOSED FOR INCOMPLETENESS
0
$0
3
$56,317
25
$84,371
2
$10,000
0
$0
Aggregated Statistics For Year 2000 (Based on 2 full and 4 partial tracts)
A) FHA, FSA/RHS & VA Home Purchase Loans
B) Conventional Home Purchase Loans
C) Refinancings
D) Home Improvement Loans
E) Loans on Dwellings For 5+ Families
F) Non-occupant Loans on < 5 Family Dwellings (A B C & D)
Number
Average Value
Number
Average Value
Number
Average Value
Number
Average Value
Number
Average Value
Number
Average Value
LOANS ORIGINATED
39
$78,135
155
$81,735
102
$51,207
22
$19,048
0
$0
19
$41,937
APPLICATIONS APPROVED, NOT ACCEPTED
9
$36,301
58
$41,095
61
$47,208
2
$29,730
0
$0
5
$44,498
APPLICATIONS DENIED
20
$43,866
290
$38,851
344
$47,641
28
$27,844
1
$60,510
13
$48,591
APPLICATIONS WITHDRAWN
2
$49,620
17
$75,918
85
$53,154
14
$23,769
0
$0
2
$60,155
FILES CLOSED FOR INCOMPLETENESS
0
$0
2
$175,000
42
$48,900
0
$0
0
$0
2
$175,000
Aggregated Statistics For Year 1999 (Based on 1 full and 2 partial tracts)
A) FHA, FSA/RHS & VA Home Purchase Loans
B) Conventional Home Purchase Loans
C) Refinancings
D) Home Improvement Loans
F) Non-occupant Loans on < 5 Family Dwellings (A B C & D)
2002 - 2018 National Fire Incident Reporting System (NFIRS) incidents
Based on the data from the years 2002 - 2018 the average number of fire incidents per year is 30. The highest number of fires - 65 took place in 2013, and the least - 0 in 2004. The data has a rising trend.
When looking into fire subcategories, the most incidents belonged to: Outside Fires (44.1%), and Structure Fires (40.9%).
Fire incident types reported to NFIRS in Zip Code 29128


 Nearest zip codes: 29040, 29062, 29152, 29078, 29020, 29044.


 Based on the data from the years 2002 - 2018 the average number of fire incidents per year is 30. The highest number of fires - 65 took place in 2013, and the least - 0 in 2004. The data has a rising trend.
 When looking into fire subcategories, the most incidents belonged to: Outside Fires (44.1%), and Structure Fires (40.9%).