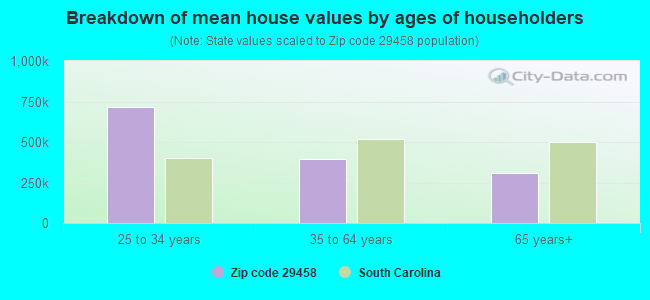
Estimated median house/condo value in 2022: $327,848
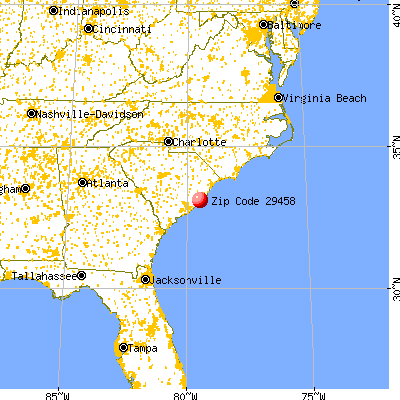
29458:
$327,848
South Carolina:
$254,600
According to our research of South Carolina and other state lists, there was 1 registered sex offender living in 29458 zip code as of May 28, 2024. The ratio of all residents to sex offenders in zip code 29458 is 2,549 to 1. The ratio of registered sex offenders to all residents in this zip code is lower than the state average.
Median resident age:
This zip code:
48.7 years
South Carolina median age:
40.5 years
Average household size:
This zip code:
2.6 people
South Carolina:
2.4 people
Averages for the 2020 tax year for zip code 29458, filed in 2021:
Average Adjusted Gross Income (AGI) in 2020: $59,996 (Individual Income Tax Returns)
Here:
$59,996
State:
$65,754
Salary/wage: $45,528 (reported on 78.1% of returns)
Here:
$45,528
State:
$52,566
(% of AGI for various income ranges: 1366.7% for AGIs below $25k, 3994.8% for AGIs $25k-50k, 6667.5% for AGIs $50k-75k, 11760.0% for AGIs $75k-100k, 17607.1% for AGIs $100k-200k)
Taxable interest for individuals: $1,708 (reported on 20.3% of returns)
This zip code:
$1,708
South Carolina:
$1,749
(% of AGI for various income ranges: 4.5% for AGIs below $25k, 3.6% for AGIs $25k-50k, 8.8% for AGIs $50k-75k, 22.5% for AGIs $75k-100k, 355.7% for AGIs $100k-200k)
Ordinary dividends: $5,575 (reported on 15.6% of returns)
Here:
$5,575
State:
$8,783
(% of AGI for various income ranges: 12.4% for AGIs below $25k, 34.4% for AGIs $25k-50k, 86.2% for AGIs $50k-75k, 941.4% for AGIs $100k-200k)
Net capital gain/loss in AGI: +$19,783 (reported on 14.1% of returns)
Here:
+$19,783
State:
+$24,194
(% of AGI for various income ranges: 11.2% for AGIs below $25k, 22.0% for AGIs $25k-50k, 261.2% for AGIs $50k-75k, 617.1% for AGIs $100k-200k)
Profit/loss from business: +$15,976 (reported on 19.5% of returns)
Here:
+$15,976
State:
+$11,253
(% of AGI for various income ranges: 152.4% for AGIs below $25k, 162.8% for AGIs $25k-50k, 905.0% for AGIs $50k-75k, 3371.4% for AGIs $100k-200k)
Taxable individual retirement arrangement distribution: $14,489 (reported on 7.0% of returns)
29458:
$14,489
South Carolina:
$21,604
(% of AGI for various income ranges: 51.5% for AGIs below $25k, 581.2% for AGIs $50k-75k, 955.7% for AGIs $100k-200k)
Total itemized deductions: $27,391 (reported on 8.6% of returns)
Here:
$27,391
State:
$35,199
(% of AGI for various income ranges: 150.0% for AGIs below $25k, 770.0% for AGIs $50k-75k, 1464.3% for AGIs $100k-200k)
Charity contributions: $6,925 (reported on 6.2% of returns)
Here:
$6,925
State:
$14,319
(% of AGI for various income ranges: 85.2% for AGIs $25k-50k, 487.1% for AGIs $100k-200k)
Taxes paid: $6,600 (reported on 7.8% of returns)
29458:
$6,600
State:
$7,486
(% of AGI for various income ranges: 29.4% for AGIs below $25k, 177.5% for AGIs $50k-75k, 311.4% for AGIs $100k-200k)
Earned income credit: $2,139 (reported on 24.2% of returns)
Here:
$2,139
State:
$2,397
(% of AGI for various income ranges: 124.5% for AGIs below $25k, 100.8% for AGIs $25k-50k)
Percentage of individuals using paid preparers for their 2020 taxes: 93.0%
Here:
93%
State:
93%
(% for various income ranges: 89.8% for AGIs below $25k, 94.4% for AGIs $25k-50k, 93.3% for AGIs $50k-75k, 100.0% for AGIs $75k-100k, 93.3% for AGIs $100k-200k, 100.0% for AGIs over 200k)
Averages for the 2012 tax year for zip code 29458, filed in 2013:
Average Adjusted Gross Income (AGI) in 2012: $38,290 (Individual Income Tax Returns)
Here:
$38,290
State:
$51,133
Salary/wage: $31,934 (reported on 80.9% of returns)
Here:
$31,934
State:
$42,173
(% of AGI for various income ranges: 78.3% for AGIs below $25k, 72.1% for AGIs $25k-50k, 73.2% for AGIs $50k-75k, 64.2% for AGIs $75k-100k, 55.4% for AGIs $100k-200k)
Taxable interest for individuals: $676 (reported on 19.1% of returns)
This zip code:
$676
South Carolina:
$1,468
(% of AGI for various income ranges: 0.1% for AGIs $25k-50k, 0.3% for AGIs $50k-75k, 0.2% for AGIs $75k-100k, 0.7% for AGIs $100k-200k)
Ordinary dividends: $3,486 (reported on 12.7% of returns)
Here:
$3,486
State:
$6,511
(% of AGI for various income ranges: 0.5% for AGIs below $25k, 0.2% for AGIs $25k-50k, 1.6% for AGIs $50k-75k, 2.5% for AGIs $100k-200k)
Net capital gain/loss in AGI: +$4,220 (reported on 9.1% of returns)
Here:
+$4,220
State:
+$13,061
(% of AGI for various income ranges: 3.5% for AGIs $100k-200k)
Profit/loss from business: +$7,914 (reported on 19.1% of returns)
Here:
+$7,914
State:
+$10,167
(% of AGI for various income ranges: 6.0% for AGIs below $25k, 3.4% for AGIs $25k-50k, 3.1% for AGIs $50k-75k, 9.1% for AGIs $75k-100k, 1.4% for AGIs $100k-200k)
Taxable individual retirement arrangement distribution: $11,171 (reported on 6.4% of returns)
29458:
$11,171
South Carolina:
$17,019
Total itemized deductions: $20,973 (26% of AGI, reported on 23.6% of returns)
Here:
$20,973
State:
$22,890
Here:
25.8% of AGI
State:
21.4% of AGI
(% of AGI for various income ranges: 3.8% for AGIs below $25k, 10.0% for AGIs $25k-50k, 16.0% for AGIs $50k-75k, 18.3% for AGIs $75k-100k, 16.3% for AGIs $100k-200k)
Charity contributions: $4,091 (reported on 20.9% of returns)
Here:
$4,091
State:
$5,169
(% of AGI for various income ranges: 2.2% for AGIs $25k-50k, 2.9% for AGIs $50k-75k, 3.1% for AGIs $75k-100k, 2.8% for AGIs $100k-200k)
Taxes paid: $6,254 (reported on 23.6% of returns)
29458:
$6,254
State:
$7,644
(% of AGI for various income ranges: 0.9% for AGIs below $25k, 2.5% for AGIs $25k-50k, 4.5% for AGIs $50k-75k, 4.6% for AGIs $75k-100k, 6.0% for AGIs $100k-200k)
Earned income credit: $2,200 (reported on 32.7% of returns)
Here:
$2,200
State:
$2,418
(% of AGI for various income ranges: 9.2% for AGIs below $25k, 1.2% for AGIs $25k-50k)
Percentage of individuals using paid preparers for their 2012 taxes: 64.5%
Here:
65%
State:
57%
(% for various income ranges: 61.4% for AGIs below $25k, 69.2% for AGIs $25k-50k, 61.5% for AGIs $50k-75k, 66.7% for AGIs $75k-100k, 75.0% for AGIs $100k-200k)
Averages for the 2004 tax year for zip code 29458, filed in 2005:
Average Adjusted Gross Income (AGI) in 2004: $30,036 (Individual Income Tax Returns)
Here:
$30,036
State:
$41,965
Salary/wage: $25,208 (reported on 84.6% of returns)
Here:
$25,208
State:
$35,695
(% of AGI for various income ranges: 112.9% for AGIs below $10k, 81.7% for AGIs $10k-25k, 79.9% for AGIs $25k-50k, 71.2% for AGIs $50k-75k, 74.0% for AGIs $75k-100k, 46.9% for AGIs over 100k)
Taxable interest for individuals: $1,272 (reported on 23.2% of returns)
This zip code:
$1,272
South Carolina:
$1,623
(% of AGI for various income ranges: 2.2% for AGIs below $10k, 0.9% for AGIs $10k-25k, 0.7% for AGIs $25k-50k, 0.6% for AGIs $50k-75k, 0.6% for AGIs $75k-100k, 1.6% for AGIs over 100k)
Taxable dividends: $4,088 (reported on 9.9% of returns)
Here:
$4,088
State:
$3,999
(% of AGI for various income ranges: 0.9% for AGIs below $10k, 0.4% for AGIs $10k-25k, 0.3% for AGIs $25k-50k, 2.2% for AGIs $50k-75k, 2.5% for AGIs $75k-100k, 2.1% for AGIs over 100k)
Net capital gain/loss: +$16,204 (reported on 8.1% of returns)
Here:
+$16,204
State:
+$13,100
(% of AGI for various income ranges: 2.7% for AGIs below $10k, -0.2% for AGIs $10k-25k, 0.4% for AGIs $25k-50k, 0.1% for AGIs $50k-75k, 0.5% for AGIs $75k-100k, 16.0% for AGIs over 100k)
Profit/loss from business: +$6,489 (reported on 15.8% of returns)
Here:
+$6,489
State:
+$9,144
(% of AGI for various income ranges: 12.9% for AGIs below $10k, 5.3% for AGIs $10k-25k, 0.5% for AGIs $25k-50k, 10.3% for AGIs $50k-75k, 4.2% for AGIs $75k-100k, -0.5% for AGIs over 100k)
IRA payment deduction: $3,000 (reported on 1.0% of returns)
29458:
$3,000
South Carolina:
$2,972
Total itemized deductions: $18,828 (27% of AGI, reported on 22.6% of returns)
Here:
$18,828
State:
$19,039
Here:
27.2% of AGI
State:
22.8% of AGI
(% of AGI for various income ranges: 11.5% for AGIs below $10k, 6.3% for AGIs $10k-25k, 13.6% for AGIs $25k-50k, 19.6% for AGIs $50k-75k, 21.3% for AGIs $75k-100k, 14.8% for AGIs over 100k)
Charity contributions deductions: $4,057 (6% of AGI, reported on 19.8% of returns)
Here:
$4,057
State:
$4,305
Here:
5.5% of AGI
State:
5.0% of AGI
(% of AGI for various income ranges: 1.0% for AGIs below $10k, 0.9% for AGIs $10k-25k, 2.3% for AGIs $25k-50k, 3.0% for AGIs $50k-75k, 4.4% for AGIs $75k-100k, 3.7% for AGIs over 100k)
Total tax: $4,513 (reported on 57.3% of returns)
29458:
$4,513
State:
$6,497
(% of AGI for various income ranges: 2.9% for AGIs below $10k, 2.7% for AGIs $10k-25k, 6.2% for AGIs $25k-50k, 9.9% for AGIs $50k-75k, 10.1% for AGIs $75k-100k, 14.8% for AGIs over 100k)
Earned income credit: $2,068 (reported on 36.9% of returns)
Here:
$2,068
State:
$1,882
Percentage of individuals using paid preparers for their 2004 taxes: 74.8%
Here:
75%
State:
66%
(% for various income ranges: 70.9% for AGIs below $10k, 78.9% for AGIs $10k-25k, 74.3% for AGIs $25k-50k, 69.5% for AGIs $50k-75k, 71.1% for AGIs $75k-100k, 80.4% for AGIs over 100k)
Household received Food Stamps/SNAP in the past 12 months: 254 Household did not receive Food Stamps/SNAP in the past 12 months: 672
Women who had a birth in the past 12 months: 37 (39 now married, 0 unmarried) Women who did not have a birth in the past 12 months: 369 (125 now married, 243 unmarried)
Housing units in zip code 29458 with a mortgage: 323 (5 second mortgage, 5 both second mortgage and home equity loan) Median monthly owner costs for units with a mortgage: $1,932 Median monthly owner costs for units without a mortgage: $416
Residents with income below the poverty level in 2022:
This zip code:
35.9%
Whole state:
14.0%
Residents with income below 50% of the poverty level in 2022:
This zip code:
34.0%
Whole state:
7.3%
Median number of rooms in houses and condos:
Here:
6.6
State:
6.4
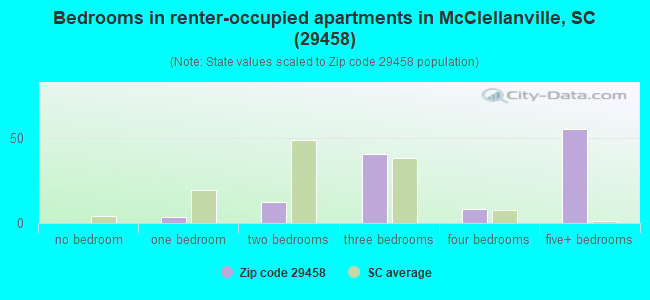
Median number of rooms in apartments:
Here:
10.0
State:
4.5
Notable locations in this zip code not listed on our city pages
Notable locations in zip code 29458: The Beach (A), Walnut Grove Ranger Station (B), Buck Hall Recreation Area (C), Wambaw District Ranger Office (D), Elmwood Hunt Camp (E), Wedge Plantation (F), Harrietta Plantation (G), Hampton Plantation (H), Silver Hill Plantation (I), Santee Gun Club (J), Tibwin Plantation (K), Fairfield Plantation (L), Cape Romain Lighthouses (M), United States Forest Service Wambaugh (N), McClellanville Magistrate Office (O), The Village Museum (P), Charleston County Public Library McClellanville Branch (Q), Awendaw Fire District Station 6 (R), Awendaw Fire Department Station 5 (S), Awendaw Fire District Station 3 (T). Display/hide their locations on the map
Churches in zip code 29458 include: Rhems Church (A), Saint Peters Church (B), Tibwin Church (C), Saint James Church (D), Our Chapel (E), Germantown Church (F), Saint James Church (G). Display/hide their locations on the map
Streams, rivers, and creeks: Sandy Point Creek (A), South Santee River (B), South Creek (C), Sett Creek (D), Harbor River (E), Sall Creek (F), Romain River (G), Tibwin Creek (H), Ormand Hall Creek (I). Display/hide their locations on the map
In group quarters: 3 (-1 institutionalized population)
Size of family households: 252 2-persons, 113 3-persons, 93 4-persons, 39 5-persons, 38 6-persons
Size of nonfamily households: 262 1-person, 122 2-persons
329 married couples with children.
11 single-parent households (5 men, 6 women).
99.4% of residents of 29458 zip code speak English at home.
0.3% of residents speak Spanish at home (43% very well, 57% well).
0.1% of residents speak other language at home (100% very well).
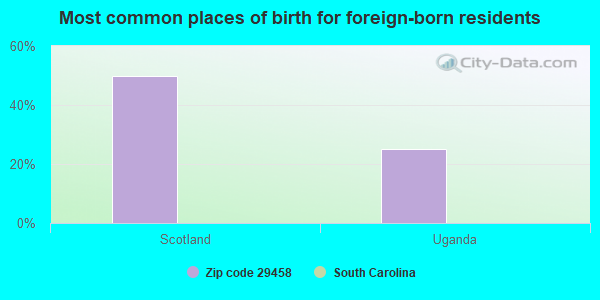
Foreign born population: 8 (0.4%) (77.7% of them are naturalized citizens)
This zip code:
0.4%
Whole state:
5.2%
50%Scotland
25%Uganda
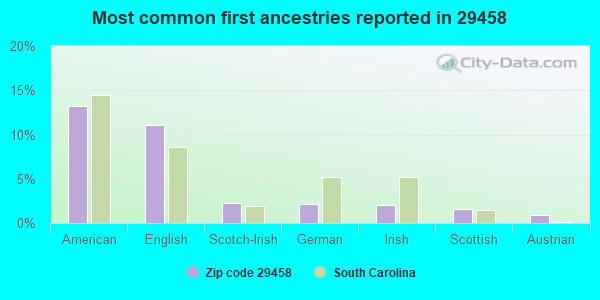
13%American
11%English
2%Scotch-Irish
2%German
2%Irish
2%Scottish
1%Austrian
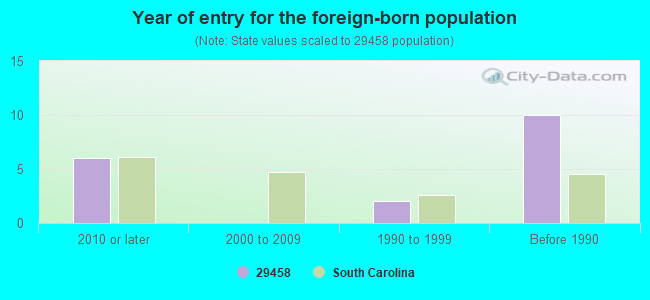
Year of entry for the foreign-born population
62010 or later
02000 to 2009
21990 to 1999
10Before 1990
Facilities with environmental interests located in this zip code:
BUSINESS TELECOM, INC. (BTI) (10775 N. HIGHWAY 17 in MCCLELLANVILLE, SC)
ENFORCEMENT/COMPLIANCE ACTIVITY (Integrated Compliance Information System) - ICIS-04-2003-9973, FORMAL ENFORCEMENT ACTION (Integrated Compliance Information System) - ICIS-04-2003-9973, FORMAL ENFORCEMENT ACTION
BULLS BAY SEAFOOD CO (MORRISON STREET in MCCLELLANVILLE, SC)
AIR MINOR (AIRS/AFS) STATE MASTER (South Carolina database) - National Pollutant Discharge Elimination System Permit Business SIC classification: PREPARED FRESH OR FROZEN FISH AND SEAFOODS
CAROLINA SEAFOODS (22 OAK STREET in MCCLELLANVILLE, SC)
AIR MINOR (AIRS/AFS) STATE MASTER (South Carolina database) - UNDERGROUND STORAGE TANK PROGRAM, National Pollutant Discharge Elimination System Permit, 401 CERTIFICATION Business SIC classification: PREPARED FRESH OR FROZEN FISH AND SEAFOODS
CONTRACTING SERVICES/BUCK HALL (8060 HWY 17 in MCCLELLANVILLE, SC)
National Pollutant Discharge Elimination System NON-MAJOR (Tracking pollutant discharge elimination systems) - permit Business SIC classification: MISCELLANEOUS NONMETALLIC MINERALS, EXCEPT FUELS
Housing units lacking complete plumbing facilities: 9.3% Housing units lacking complete kitchen facilities: 5.8%
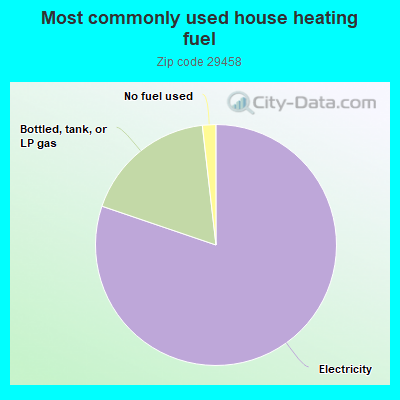
80.3%Electricity
18.0%Bottled, tank, or LP gas
1.8%No fuel used
Population in 1990: 3,020.
Place of birth for U.S.-born residents:
This state: 1,621
Northeast: 331
Midwest: 87
South: 275
West: 7
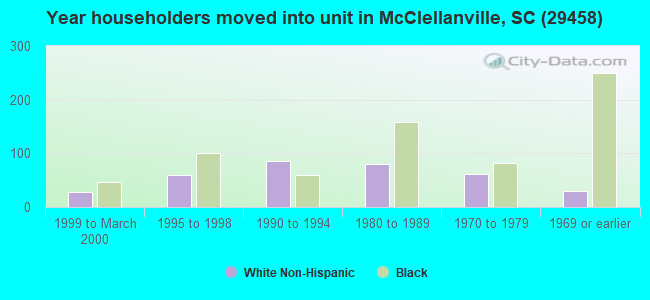
80% of the 29458 zip code residents lived in the same house 5 years ago. Out of people who lived in different houses, 61% lived in this county. Out of people who lived in different counties, 50% lived in South Carolina.
97% of the 29458 zip code residents lived in the same house 1 year ago. Out of people who lived in different houses, 63% moved from this county. Out of people who lived in different houses, 4% moved from different county within same state. Out of people who lived in different houses, 22% moved from different state.
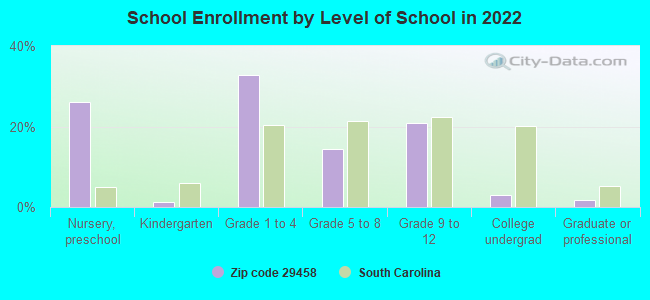
Private vs. public school enrollment:
Students in private schools in grades 1 to 8 (elementary and middle school): 2
Here:
0.9%
South Carolina:
14.4%
Students in private schools in grades 9 to 12 (high school): 25
Here:
21.5%
South Carolina:
11.1%
Students in private undergraduate colleges: 10
Here:
57.0%
South Carolina:
21.9%
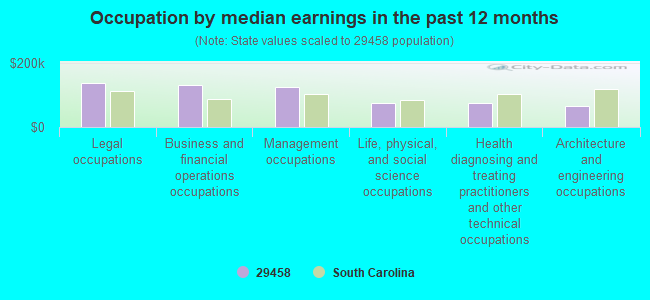
Occupation by median earnings in the past 12 months ($)
136,985Legal occupations
130,144Business and financial operations occupations
123,976Management occupations
75,360Life, physical, and social science occupations
74,404Health diagnosing and treating practitioners and other technical occupations
66,071Architecture and engineering occupations
Companies with federal contracts located in this zip code:
R L MORRISON AND SON INC (623 MORRISON ST in MC CLELLANVILL, SC; small business)
$46,714 with U.S. Army Corps of Engineers - civil program financing only for Salvage of Marine Vessels. Signed on 2002-02-08. Completion date: 2002-05-30.
Top industries in this zip code by the number of employees in 2005:
Construction: Site Preparation Contractors (10-19 employees: 1 establishment)
Construction: Other Heavy and Civil Engineering Construction (10-19: 1)
Health Care and Social Assistance: All Other Outpatient Care Centers (10-19: 1)
Educational Services: Elementary and Secondary Schools (10-19: 1)
Health Care and Social Assistance: Services for the Elderly and Persons with Disabilities (10-19: 1)
People in group quarters in 2010:
21 people in group homes intended for adults
People in group quarters in 2000:
8 people in other noninstitutional group quarters
Fatal accident statistics in 2013:
Fatal accident count: 1
Vehicles involved in fatal accidents: 2
Fatal accidents caused by drunken drivers: 1
Fatalities: 1
Persons involved in fatal accidents: 2
Pedestrians involved in fatal accidents: 0
Fatal accident statistics in 2012:
Fatal accident count: 1
Vehicles involved in fatal accidents: 1
Fatal accidents caused by drunken drivers: 1
Fatalities: 2
Persons involved in fatal accidents: 2
Pedestrians involved in fatal accidents: 0
Home Mortgage Disclosure Act Aggregated Statistics For Year 2009 (Based on 50 partial tracts)
A) FHA, FSA/RHS & VA Home Purchase Loans
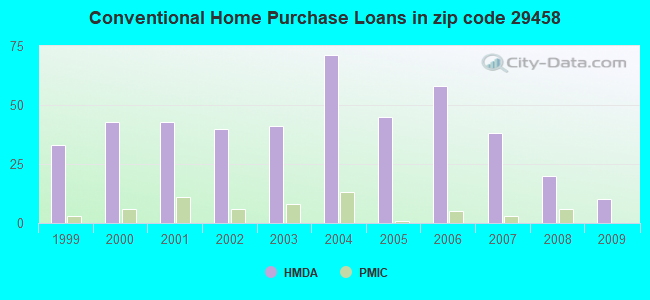
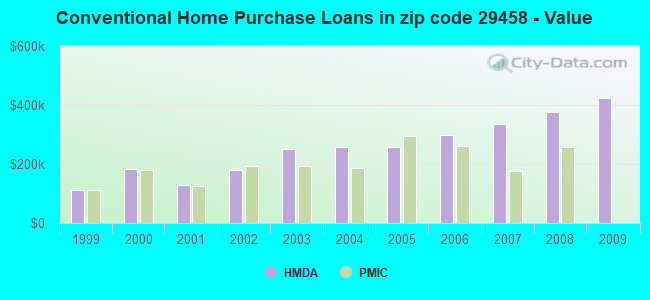
B) Conventional Home Purchase Loans
C) Refinancings
D) Home Improvement Loans
F) Non-occupant Loans on < 5 Family Dwellings (A B C & D)
G) Loans On Manufactured Home Dwelling (A B C & D)
Number
Average Value
Number
Average Value
Number
Average Value
Number
Average Value
Number
Average Value
Number
Average Value
LOANS ORIGINATED
4
$254,712
10
$422,671
87
$264,816
4
$93,898
17
$358,351
2
$103,155
APPLICATIONS APPROVED, NOT ACCEPTED
0
$0
2
$144,415
12
$198,022
0
$0
2
$87,815
0
$0
APPLICATIONS DENIED
0
$0
7
$349,291
58
$235,752
2
$72,475
6
$409,975
6
$123,787
APPLICATIONS WITHDRAWN
1
$130,130
2
$112,150
39
$217,677
0
$0
2
$142,300
12
$123,786
FILES CLOSED FOR INCOMPLETENESS
0
$0
2
$568,675
7
$279,010
0
$0
0
$0
1
$133,310
Aggregated Statistics For Year 2008 (Based on 50 partial tracts)
A) FHA, FSA/RHS & VA Home Purchase Loans
B) Conventional Home Purchase Loans
C) Refinancings
D) Home Improvement Loans
F) Non-occupant Loans on < 5 Family Dwellings (A B C & D)
G) Loans On Manufactured Home Dwelling (A B C & D)
Number
Average Value
Number
Average Value
Number
Average Value
Number
Average Value
Number
Average Value
Number
Average Value
LOANS ORIGINATED
1
$121,670
20
$377,336
83
$304,296
15
$143,747
17
$455,251
6
$127,665
APPLICATIONS APPROVED, NOT ACCEPTED
0
$0
3
$685,937
10
$169,809
1
$52,900
3
$160,110
1
$327,980
APPLICATIONS DENIED
4
$176,685
11
$85,025
53
$218,746
11
$99,933
12
$249,335
10
$60,729
APPLICATIONS WITHDRAWN
1
$170,340
7
$188,324
20
$316,818
0
$0
7
$366,370
3
$104,037
FILES CLOSED FOR INCOMPLETENESS
0
$0
3
$411,913
8
$218,080
0
$0
2
$204,195
3
$145,300
Aggregated Statistics For Year 2007 (Based on 50 partial tracts)
A) FHA, FSA/RHS & VA Home Purchase Loans
B) Conventional Home Purchase Loans
C) Refinancings
D) Home Improvement Loans
E) Loans on Dwellings For 5+ Families
F) Non-occupant Loans on < 5 Family Dwellings (A B C & D)
G) Loans On Manufactured Home Dwelling (A B C & D)
Number
Average Value
Number
Average Value
Number
Average Value
Number
Average Value
Number
Average Value
Number
Average Value
Number
Average Value
LOANS ORIGINATED
0
$0
38
$336,026
80
$294,653
13
$161,060
0
$0
22
$362,605
8
$51,710
APPLICATIONS APPROVED, NOT ACCEPTED
0
$0
6
$227,823
21
$170,137
2
$42,850
0
$0
2
$167,165
5
$79,774
APPLICATIONS DENIED
2
$205,250
7
$322,539
89
$418,790
21
$85,245
0
$0
12
$1,157,981
11
$64,442
APPLICATIONS WITHDRAWN
0
$0
12
$283,632
39
$431,989
4
$138,598
1
$4,761,000
4
$1,531,455
2
$60,835
FILES CLOSED FOR INCOMPLETENESS
0
$0
2
$133,835
7
$303,949
0
$0
0
$0
1
$158,700
0
$0
Aggregated Statistics For Year 2006 (Based on 50 partial tracts)
A) FHA, FSA/RHS & VA Home Purchase Loans
B) Conventional Home Purchase Loans
C) Refinancings
D) Home Improvement Loans
F) Non-occupant Loans on < 5 Family Dwellings (A B C & D)
G) Loans On Manufactured Home Dwelling (A B C & D)
Number
Average Value
Number
Average Value
Number
Average Value
Number
Average Value
Number
Average Value
Number
Average Value
LOANS ORIGINATED
1
$136,480
58
$299,797
105
$249,214
12
$143,800
23
$377,200
7
$88,116
APPLICATIONS APPROVED, NOT ACCEPTED
0
$0
19
$282,431
19
$124,454
2
$86,225
2
$1,512,940
12
$62,157
APPLICATIONS DENIED
1
$88,870
43
$111,434
84
$169,230
16
$39,411
8
$200,888
31
$70,954
APPLICATIONS WITHDRAWN
1
$149,180
12
$203,665
30
$148,543
1
$152,350
4
$138,862
5
$106,224
FILES CLOSED FOR INCOMPLETENESS
0
$0
1
$211,600
13
$131,518
0
$0
1
$78,290
2
$99,450
Aggregated Statistics For Year 2005 (Based on 50 partial tracts)
A) FHA, FSA/RHS & VA Home Purchase Loans
B) Conventional Home Purchase Loans
C) Refinancings
D) Home Improvement Loans
F) Non-occupant Loans on < 5 Family Dwellings (A B C & D)
G) Loans On Manufactured Home Dwelling (A B C & D)
Number
Average Value
Number
Average Value
Number
Average Value
Number
Average Value
Number
Average Value
Number
Average Value
LOANS ORIGINATED
0
$0
45
$256,459
103
$194,282
14
$68,544
20
$167,058
8
$115,984
APPLICATIONS APPROVED, NOT ACCEPTED
1
$85,700
18
$109,092
22
$175,724
0
$0
3
$147,767
18
$66,066
APPLICATIONS DENIED
0
$0
42
$92,248
69
$179,124
15
$67,712
5
$111,724
37
$76,233
APPLICATIONS WITHDRAWN
0
$0
19
$219,173
43
$205,941
3
$196,437
6
$214,245
8
$90,856
FILES CLOSED FOR INCOMPLETENESS
0
$0
1
$343,850
24
$185,767
0
$0
0
$0
2
$76,705
Aggregated Statistics For Year 2004 (Based on 50 partial tracts)
A) FHA, FSA/RHS & VA Home Purchase Loans
B) Conventional Home Purchase Loans
C) Refinancings
D) Home Improvement Loans
F) Non-occupant Loans on < 5 Family Dwellings (A B C & D)
G) Loans On Manufactured Home Dwelling (A B C & D)
Number
Average Value
Number
Average Value
Number
Average Value
Number
Average Value
Number
Average Value
Number
Average Value
LOANS ORIGINATED
0
$0
71
$256,811
79
$217,064
12
$35,619
30
$331,401
16
$61,166
APPLICATIONS APPROVED, NOT ACCEPTED
1
$38,090
18
$82,054
29
$150,163
0
$0
1
$83,580
19
$50,506
APPLICATIONS DENIED
2
$68,770
55
$94,681
71
$120,865
11
$50,592
5
$108,550
49
$52,922
APPLICATIONS WITHDRAWN
0
$0
5
$257,518
31
$118,803
2
$108,445
2
$345,435
0
$0
FILES CLOSED FOR INCOMPLETENESS
0
$0
3
$504,667
14
$124,693
1
$47,610
0
$0
2
$76,705
Aggregated Statistics For Year 2003 (Based on 50 partial tracts)
A) FHA, FSA/RHS & VA Home Purchase Loans
B) Conventional Home Purchase Loans
C) Refinancings
D) Home Improvement Loans
E) Loans on Dwellings For 5+ Families
F) Non-occupant Loans on < 5 Family Dwellings (A B C & D)
Number
Average Value
Number
Average Value
Number
Average Value
Number
Average Value
Number
Average Value
Number
Average Value
LOANS ORIGINATED
0
$0
41
$250,488
171
$184,073
2
$34,915
2
$130,665
22
$218,333
APPLICATIONS APPROVED, NOT ACCEPTED
1
$68,770
11
$136,482
37
$140,600
2
$35,970
0
$0
0
$0
APPLICATIONS DENIED
1
$104,740
30
$69,899
89
$128,101
7
$101,266
0
$0
4
$107,388
APPLICATIONS WITHDRAWN
0
$0
8
$270,848
34
$179,922
1
$105,800
0
$0
4
$182,505
FILES CLOSED FOR INCOMPLETENESS
1
$133,310
0
$0
6
$179,155
0
$0
0
$0
0
$0
Aggregated Statistics For Year 2002 (Based on 50 partial tracts)
A) FHA, FSA/RHS & VA Home Purchase Loans
B) Conventional Home Purchase Loans
C) Refinancings
D) Home Improvement Loans
F) Non-occupant Loans on < 5 Family Dwellings (A B C & D)
Number
Average Value
Number
Average Value
Number
Average Value
Number
Average Value
Number
Average Value
LOANS ORIGINATED
1
$133,310
40
$179,728
126
$185,427
5
$33,432
24
$176,157
APPLICATIONS APPROVED, NOT ACCEPTED
1
$68,770
16
$64,274
26
$112,636
1
$52,900
0
$0
APPLICATIONS DENIED
1
$68,770
36
$55,045
76
$139,127
13
$12,452
3
$118,143
APPLICATIONS WITHDRAWN
0
$0
7
$125,449
21
$108,370
1
$5,290
3
$107,563
FILES CLOSED FOR INCOMPLETENESS
0
$0
6
$218,830
11
$76,465
1
$15,870
1
$267,670
Aggregated Statistics For Year 2001 (Based on 50 partial tracts)
A) FHA, FSA/RHS & VA Home Purchase Loans
B) Conventional Home Purchase Loans
C) Refinancings
D) Home Improvement Loans
F) Non-occupant Loans on < 5 Family Dwellings (A B C & D)
Number
Average Value
Number
Average Value
Number
Average Value
Number
Average Value
Number
Average Value
LOANS ORIGINATED
4
$101,040
43
$128,855
108
$166,606
14
$26,828
16
$227,404
APPLICATIONS APPROVED, NOT ACCEPTED
1
$3,170
31
$47,678
17
$79,536
2
$68,240
3
$67,007
APPLICATIONS DENIED
0
$0
94
$44,166
85
$78,603
10
$10,580
6
$72,650
APPLICATIONS WITHDRAWN
0
$0
4
$56,338
28
$126,431
5
$60,094
2
$183,565
FILES CLOSED FOR INCOMPLETENESS
0
$0
3
$167,163
5
$63,268
0
$0
1
$49,730
Aggregated Statistics For Year 2000 (Based on 50 partial tracts)
A) FHA, FSA/RHS & VA Home Purchase Loans
B) Conventional Home Purchase Loans
C) Refinancings
D) Home Improvement Loans
F) Non-occupant Loans on < 5 Family Dwellings (A B C & D)
Number
Average Value
Number
Average Value
Number
Average Value
Number
Average Value
Number
Average Value
LOANS ORIGINATED
4
$53,430
43
$182,247
41
$88,640
8
$15,474
13
$200,532
APPLICATIONS APPROVED, NOT ACCEPTED
3
$39,500
23
$111,734
17
$106,236
1
$58,190
1
$24,330
APPLICATIONS DENIED
3
$58,897
92
$46,092
85
$61,152
16
$10,646
7
$50,936
APPLICATIONS WITHDRAWN
1
$65,600
3
$123,433
22
$84,111
3
$23,980
1
$10,580
FILES CLOSED FOR INCOMPLETENESS
0
$0
4
$479,010
8
$59,116
0
$0
2
$549,100
Aggregated Statistics For Year 1999 (Based on 23 partial tracts)
B) Conventional Home Purchase Loans
C) Refinancings
D) Home Improvement Loans
F) Non-occupant Loans on < 5 Family Dwellings (A B C & D)
Detailed PMIC statistics for the following Tracts:0050.00
2003 - 2018 National Fire Incident Reporting System (NFIRS) incidents
Based on the data from the years 2003 - 2018 the average number of fire incidents per year is 21. The highest number of reported fire incidents - 38 took place in 2011, and the least - 0 in 2005. The data has a decreasing trend.
When looking into fire subcategories, the most incidents belonged to: Outside Fires (47.9%), and Structure Fires (27.4%).
Fire incident types reported to NFIRS in Zip Code 29458


 Nearest zip codes: 29453, 29429, 29440, 29450, 29434, 29510.


 Based on the data from the years 2003 - 2018 the average number of fire incidents per year is 21. The highest number of reported fire incidents - 38 took place in 2011, and the least - 0 in 2005. The data has a decreasing trend.
 When looking into fire subcategories, the most incidents belonged to: Outside Fires (47.9%), and Structure Fires (27.4%).