Estimated zip code population in 2022: 2,383 Zip code population in 2010: 2,292 Zip code population in 2000: 2,009
Houses and condos: 1,066 Renter-occupied apartments: 271
% of renters here:
27%
State:
33%
March 2022 cost of living index in zip code 37012: 79.7 (low, U.S. average is 100)
Land area: 34.8 sq. mi. Water area: 0.0 sq. mi.
Population density: 68 people per square mile
(very low).
OSM Map
General Map
Google Map
MSN Map
OSM Map
General Map
Google Map
MSN Map
OSM Map
General Map
Google Map
MSN Map
OSM Map
General Map
Google Map
MSN Map
Please wait while loading the map...
Real estate property taxes paid for housing units in 2022:
This zip code:
0.3% ($732)
Tennessee:
0.5% ($1,376)
Median real estate property taxes paid for housing units with mortgages in 2022: $588 (0.3%) Median real estate property taxes paid for housing units with no mortgage in 2022: $905 (0.3%)
Business Search- 14 Million verified businesses
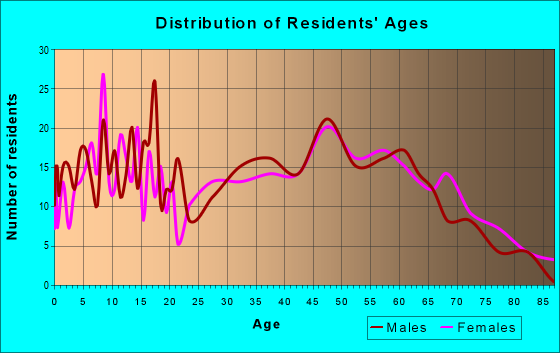
Males: 1,311
(55.0%)
Females: 1,071
(45.0%)
For population 25 years and over in 37012:
High school or higher: 84.6%
Bachelor's degree or higher: 12.5%
Graduate or professional degree: 1.4%
Unemployed: 3.8%
Mean travel time to work (commute): 38.2 minutes
For population 15 years and over in 37012:
Never married: 20.2%
Now married: 54.8%
Separated: 3.9%
Widowed: 10.5%
Divorced: 10.5%
Zip code 37012 compared to state average:
Black race population percentage significantly below state average.
Hispanic race population percentage significantly below state average.
Foreign-born population percentage significantly below state average.
Length of stay since moving in significantly above state average.
Percentage of population with a bachelor's degree or higher significantly below state average.
Estimated median house/condo value in 2022: $234,123
37012:
$234,123
Tennessee:
$284,800
According to our research of Tennessee and other state lists, there were 4 registered sex offenders living in 37012 zip code as of May 28, 2024. The ratio of all residents to sex offenders in zip code 37012 is 615 to 1. The ratio of registered sex offenders to all residents in this zip code is lower than the state average.
Median resident age:
This zip code:
38.6 years
Tennessee median age:
39.2 years
Average household size:
This zip code:
2.4 people
Tennessee:
2.4 people
Averages for the 2020 tax year for zip code 37012, filed in 2021:
Average Adjusted Gross Income (AGI) in 2020: $46,936 (Individual Income Tax Returns)
Here:
$46,936
State:
$69,014
Salary/wage: $45,697 (reported on 81.3% of returns)
Here:
$45,697
State:
$55,872
(% of AGI for various income ranges: 995.7% for AGIs below $25k, 3728.8% for AGIs $25k-50k, 6450.8% for AGIs $50k-75k, 9856.2% for AGIs $75k-100k, 16354.3% for AGIs $100k-200k)
Taxable interest for individuals: $1,034 (reported on 27.1% of returns)
This zip code:
$1,034
Tennessee:
$1,945
(% of AGI for various income ranges: 32.7% for AGIs below $25k, 38.1% for AGIs $25k-50k, 34.2% for AGIs $50k-75k, 66.2% for AGIs $75k-100k, 12.9% for AGIs $100k-200k)
Ordinary dividends: $900 (reported on 11.2% of returns)
Here:
$900
State:
$8,105
(% of AGI for various income ranges: 11.7% for AGIs below $25k, 21.5% for AGIs $25k-50k, 11.2% for AGIs $75k-100k, 11.4% for AGIs $100k-200k)
Net capital gain/loss in AGI: +$8,344 (reported on 8.4% of returns)
Here:
+$8,344
State:
+$33,664
(% of AGI for various income ranges: 29.0% for AGIs below $25k, 90.0% for AGIs $50k-75k, 794.3% for AGIs $100k-200k)
Profit/loss from business: +$13,169 (reported on 15.0% of returns)
Here:
+$13,169
State:
+$18,991
(% of AGI for various income ranges: 157.0% for AGIs below $25k, 88.5% for AGIs $25k-50k, 445.0% for AGIs $50k-75k, 1245.7% for AGIs $100k-200k)
Taxable individual retirement arrangement distribution: $9,757 (reported on 6.5% of returns)
37012:
$9,757
Tennessee:
$20,036
(% of AGI for various income ranges: 92.0% for AGIs below $25k, 339.2% for AGIs $50k-75k)
Earned income credit: $2,257 (reported on 19.6% of returns)
Here:
$2,257
State:
$2,391
(% of AGI for various income ranges: 92.7% for AGIs below $25k, 75.4% for AGIs $25k-50k)
Percentage of individuals using paid preparers for their 2020 taxes: 96.3%
Here:
96%
State:
93%
(% for various income ranges: 94.9% for AGIs below $25k, 96.7% for AGIs $25k-50k, 93.8% for AGIs $50k-75k, 100.0% for AGIs $75k-100k, 100.0% for AGIs $100k-200k)
Averages for the 2012 tax year for zip code 37012, filed in 2013:
Average Adjusted Gross Income (AGI) in 2012: $40,618 (Individual Income Tax Returns)
Here:
$40,618
State:
$53,767
Salary/wage: $40,327 (reported on 83.3% of returns)
Here:
$40,327
State:
$45,421
(% of AGI for various income ranges: 73.8% for AGIs below $25k, 81.6% for AGIs $25k-50k, 86.5% for AGIs $50k-75k, 91.6% for AGIs $75k-100k, 78.6% for AGIs $100k-200k)
Taxable interest for individuals: $1,268 (reported on 34.4% of returns)
This zip code:
$1,268
Tennessee:
$1,732
(% of AGI for various income ranges: 2.8% for AGIs below $25k, 1.4% for AGIs $25k-50k, 1.2% for AGIs $50k-75k, 0.3% for AGIs $75k-100k, 0.2% for AGIs $100k-200k)
Ordinary dividends: $927 (reported on 12.2% of returns)
Here:
$927
State:
$6,739
(% of AGI for various income ranges: 0.6% for AGIs below $25k, 0.5% for AGIs $25k-50k, 0.2% for AGIs $50k-75k, 0.2% for AGIs $75k-100k)
Net capital gain/loss in AGI: +$1,364 (reported on 12.2% of returns)
Here:
+$1,364
State:
+$19,082
(% of AGI for various income ranges: 0.6% for AGIs below $25k, 0.6% for AGIs $25k-50k, 0.8% for AGIs $50k-75k)
Profit/loss from business: +$7,054 (reported on 14.4% of returns)
Here:
+$7,054
State:
+$15,240
(% of AGI for various income ranges: 9.4% for AGIs below $25k, 2.9% for AGIs $25k-50k, 2.3% for AGIs $50k-75k)
Taxable individual retirement arrangement distribution: $7,067 (reported on 6.7% of returns)
37012:
$7,067
Tennessee:
$15,505
Total itemized deductions: $15,300 (23% of AGI, reported on 15.6% of returns)
Here:
$15,300
State:
$21,976
Here:
22.8% of AGI
State:
17.8% of AGI
(% of AGI for various income ranges: 6.3% for AGIs below $25k, 8.5% for AGIs $25k-50k, 8.4% for AGIs $75k-100k, 6.2% for AGIs $100k-200k)
Charity contributions: $4,760 (reported on 11.1% of returns)
Here:
$4,760
State:
$6,709
(% of AGI for various income ranges: 2.1% for AGIs $25k-50k, 2.0% for AGIs $75k-100k, 1.9% for AGIs $100k-200k)
Taxes paid: $2,614 (reported on 15.6% of returns)
37012:
$2,614
State:
$4,829
(% of AGI for various income ranges: 0.5% for AGIs below $25k, 1.3% for AGIs $25k-50k, 1.5% for AGIs $75k-100k, 1.6% for AGIs $100k-200k)
Earned income credit: $2,289 (reported on 21.1% of returns)
Here:
$2,289
State:
$2,404
(% of AGI for various income ranges: 6.5% for AGIs below $25k, 1.3% for AGIs $25k-50k)
Percentage of individuals using paid preparers for their 2012 taxes: 63.3%
Here:
63%
State:
52%
(% for various income ranges: 57.9% for AGIs below $25k, 69.2% for AGIs $25k-50k, 61.5% for AGIs $50k-75k, 62.5% for AGIs $75k-100k, 80.0% for AGIs $100k-200k)
Averages for the 2004 tax year for zip code 37012, filed in 2005:
Average Adjusted Gross Income (AGI) in 2004: $33,392 (Individual Income Tax Returns)
Here:
$33,392
State:
$44,088
Salary/wage: $32,511 (reported on 85.7% of returns)
Here:
$32,511
State:
$38,825
(% of AGI for various income ranges: 74.9% for AGIs below $10k, 80.9% for AGIs $10k-25k, 87.3% for AGIs $25k-50k, 87.2% for AGIs $50k-75k, 84.6% for AGIs $75k-100k, 62.6% for AGIs over 100k)
Taxable interest for individuals: $1,525 (reported on 38.0% of returns)
This zip code:
$1,525
Tennessee:
$1,802
(% of AGI for various income ranges: 9.7% for AGIs below $10k, 3.9% for AGIs $10k-25k, 1.6% for AGIs $25k-50k, 1.0% for AGIs $50k-75k, 0.5% for AGIs $75k-100k, 0.8% for AGIs over 100k)
Taxable dividends: $444 (reported on 9.0% of returns)
Here:
$444
State:
$3,727
(% of AGI for various income ranges: 0.7% for AGIs below $10k, 0.1% for AGIs $10k-25k, 0.1% for AGIs $25k-50k, 0.4% for AGIs $75k-100k)
Net capital gain/loss: +$5,485 (reported on 11.0% of returns)
Here:
+$5,485
State:
+$15,776
(% of AGI for various income ranges: -1.8% for AGIs below $10k, 0.2% for AGIs $10k-25k, 0.5% for AGIs $25k-50k, 3.0% for AGIs $50k-75k, 5.7% for AGIs $75k-100k)
Profit/loss from business: +$6,837 (reported on 17.1% of returns)
Here:
+$6,837
State:
+$12,882
(% of AGI for various income ranges: 18.3% for AGIs below $10k, 2.5% for AGIs $10k-25k, 4.4% for AGIs $25k-50k, -0.1% for AGIs $50k-75k, 8.5% for AGIs $75k-100k)
IRA payment deduction: $3,150 (reported on 2.2% of returns)
37012:
$3,150
Tennessee:
$2,934
Total itemized deductions: $12,829 (24% of AGI, reported on 15.6% of returns)
Here:
$12,829
State:
$18,035
Here:
23.9% of AGI
State:
19.9% of AGI
(% of AGI for various income ranges: 5.9% for AGIs $10k-25k, 5.7% for AGIs $25k-50k, 6.0% for AGIs $50k-75k, 11.2% for AGIs $75k-100k)
Charity contributions deductions: $3,783 (7% of AGI, reported on 11.8% of returns)
Here:
$3,783
State:
$5,167
Here:
6.5% of AGI
State:
5.3% of AGI
(% of AGI for various income ranges: 0.9% for AGIs $10k-25k, 0.8% for AGIs $25k-50k, 1.2% for AGIs $50k-75k, 4.1% for AGIs $75k-100k)
Total tax: $3,573 (reported on 76.8% of returns)
37012:
$3,573
State:
$7,482
(% of AGI for various income ranges: 3.7% for AGIs below $10k, 3.7% for AGIs $10k-25k, 6.8% for AGIs $25k-50k, 7.8% for AGIs $50k-75k, 12.3% for AGIs $75k-100k, 16.8% for AGIs over 100k)
Earned income credit: $1,766 (reported on 19.1% of returns)
Here:
$1,766
State:
$1,826
Percentage of individuals using paid preparers for their 2004 taxes: 74.5%
Here:
74%
State:
60%
(% for various income ranges: 73.1% for AGIs below $10k, 71.4% for AGIs $10k-25k, 72.6% for AGIs $25k-50k, 79.4% for AGIs $50k-75k, 84.6% for AGIs $75k-100k, 90.0% for AGIs over 100k)
Household received Food Stamps/SNAP in the past 12 months: 135 Household did not receive Food Stamps/SNAP in the past 12 months: 871
Women who had a birth in the past 12 months: 63 (44 now married, 18 unmarried) Women who did not have a birth in the past 12 months: 485 (349 now married, 136 unmarried)
Housing units in zip code 37012 with a mortgage: 481 (14 second mortgage, 9 both second mortgage and home equity loan) Median monthly owner costs for units with a mortgage: $972 Median monthly owner costs for units without a mortgage: $367
Residents with income below the poverty level in 2022:
This zip code:
13.9%
Whole state:
13.3%
Residents with income below 50% of the poverty level in 2022:
This zip code:
5.9%
Whole state:
7.1%
Median number of rooms in houses and condos:
Here:
6.0
State:
6.5
Median number of rooms in apartments:
Here:
4.3
State:
4.4
Notable locations in this zip code not listed on our city pages
Churches in zip code 37012 include: Liberty Hill Church (A), Upper Helton Missionary Baptist Church (B), Helton Creek Baptist Church (C), Malones Chapel Missionary Baptist Church (D), New Hope Baptist Church (E), Alexandria African Methodist Episcopal Church (F), Alexandria Church of Christ (G), Walkers Chapel Primitive Baptist Church (H), West Main Baptist Church (I). Display/hide their locations on the map
Cemeteries: Talley Cemetery (1), Gualtney Cemetery (2), Driver Cemetery (3), Highland Memorial Cemetery (4), Foutch Cemetery (5), Eastview Cemetery (6), Blue Cemetery (7). Display/hide their locations on the map
Streams, rivers, and creeks: Johnson Creek (A), Reynolds Branch (B), Oakley Branch (C), Griffin Branch (D), Goose Creek (E), Dry Branch (F), Coon Branch (G), Purtle Creek (H). Display/hide their locations on the map
Size of family households: 366 2-persons, 142 3-persons, 71 4-persons, 111 5-persons, 17 6-persons, 12 7-or-more-persons
Size of nonfamily households: 234 1-person, 51 2-persons, 3 4-persons
416 married couples with children.
128 single-parent households (128 women).
97.7% of residents of 37012 zip code speak English at home.
1.0% of residents speak Spanish at home (100% very well).
0.5% of residents speak Asian or Pacific Island language at home (100% very well).
0.5% of residents speak other language at home (100% very well).
Foreign born population: 31 (1.3%) (6.6% of them are naturalized citizens)
This zip code:
1.3%
Whole state:
5.6%
45%Denmark
23%Malaysia
43%American
9%English
9%European
8%Irish
3%German
3%Italian
2%Scottish
Year of entry for the foreign-born population
82010 or later
62000 to 2009
171990 to 1999
18Before 1990
Facilities with environmental interests located in this zip code:
ALEXANDRIA WWTP (35_EDGEWOOD RD. in ALEXANDRIA, TN)
National Pollutant Discharge Elimination System NON-MAJOR (Tracking pollutant discharge elimination systems) - permit Business SIC classification: SEWERAGE SYSTEMS Organizations: CITY OF ALEXANDRIA STP (CONTACT/OWNER)
Alternative names: ALEXANDRIA STP, CITY OF ALEXANDRIA
Housing units lacking complete plumbing facilities: 0.8%
71.7%Electricity
22.7%Utility gas
4.4%Bottled, tank, or LP gas
1.4%Wood
Population in 1990: 993. Population change in the 1990s: +1,016 (+102.3%).
Place of birth for U.S.-born residents:
This state: 1,915
Northeast: 107
Midwest: 98
South: 170
West: 12
62% of the 37012 zip code residents lived in the same house 5 years ago. Out of people who lived in different houses, 40% lived in this county. Out of people who lived in different counties, 50% lived in Tennessee.
94% of the 37012 zip code residents lived in the same house 1 year ago. Out of people who lived in different houses, 21% moved from this county. Out of people who lived in different houses, 64% moved from different county within same state. Out of people who lived in different houses, 22% moved from different state.
Private vs. public school enrollment:
Students in private schools in grades 1 to 8 (elementary and middle school): 40
Here:
16.4%
Tennessee:
15.0%
Students in private schools in grades 9 to 12 (high school): 17
Here:
14.5%
Tennessee:
16.2%
Students in private undergraduate colleges: 25
Here:
52.9%
Tennessee:
23.5%
Occupation by median earnings in the past 12 months ($)
76,784Management occupations
70,704Fire fighting and prevention, and other protective service workers including supervisors
60,741Business and financial operations occupations
56,641Installation, maintenance, and repair occupations
55,037Production occupations
52,001Architecture and engineering occupations
Top industries in this zip code by the number of employees in 2005:
Finance and Insurance: Commercial Banking (5-9: 2, 1-4: 1)
Construction: Water and Sewer Line and Related Structures Construction (10-19: 1)
Accommodation and Food Services: Full-Service Restaurants (10-19: 1)
Other Services (except Public Administration): Religious Organizations (5-9: 1, 1-4: 3)
Health Care and Social Assistance: Offices of Dentists (5-9: 1)
People in group quarters in 2000:
9 people in other group homes
Fatal accident statistics in 2013:
Fatal accident count: 2
Vehicles involved in fatal accidents: 3
Fatal accidents caused by drunken drivers: 0
Fatalities: 2
Persons involved in fatal accidents: 3
Pedestrians involved in fatal accidents: 0
Fatal accident statistics in 2012:
Fatal accident count: 1
Vehicles involved in fatal accidents: 2
Fatal accidents caused by drunken drivers: 1
Fatalities: 1
Persons involved in fatal accidents: 2
Pedestrians involved in fatal accidents: 0
2002 - 2018 National Fire Incident Reporting System (NFIRS) incidents
According to the data from the years 2002 - 2018 the average number of fires per year is 9. The highest number of reported fires - 14 took place in 2009, and the least - 0 in 2003. The data has a growing trend.
When looking into fire subcategories, the most incidents belonged to: Structure Fires (52.8%), and Outside Fires (32.1%).
Fire incident types reported to NFIRS in Zip Code 37012


 Nearest zip codes: 38547, 38567, 37095, 37059, 38569, 38563.


 According to the data from the years 2002 - 2018 the average number of fires per year is 9. The highest number of reported fires - 14 took place in 2009, and the least - 0 in 2003. The data has a growing trend.
 When looking into fire subcategories, the most incidents belonged to: Structure Fires (52.8%), and Outside Fires (32.1%).