Estimated zip code population in 2022: 1,749 Zip code population in 2010: 1,975 Zip code population in 2000: 1,517
Houses and condos: 799 Renter-occupied apartments: 20
% of renters here:
3%
State:
33%
March 2022 cost of living index in zip code 38547: 77.5 (low, U.S. average is 100)
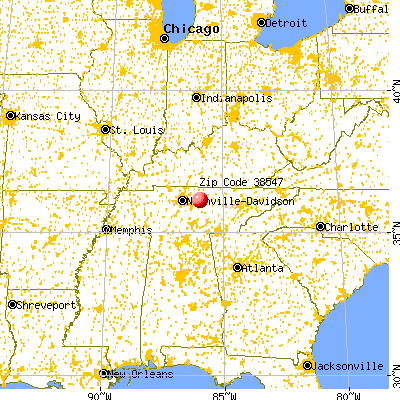
Land area: 32.8 sq. mi. Water area: 0.0 sq. mi.
Population density: 53 people per square mile
(very low).
OSM Map
General Map
Google Map
MSN Map
OSM Map
General Map
Google Map
MSN Map
OSM Map
General Map
Google Map
MSN Map
OSM Map
General Map
Google Map
MSN Map
Please wait while loading the map...
Real estate property taxes paid for housing units in 2022:
This zip code:
0.3% ($851)
Tennessee:
0.5% ($1,376)
Median real estate property taxes paid for housing units with mortgages in 2022: $822 (0.3%) Median real estate property taxes paid for housing units with no mortgage in 2022: $871 (0.4%)
Business Search- 14 Million verified businesses
Males: 884
(50.6%)
Females: 864
(49.4%)
For population 25 years and over in 38547:
High school or higher: 87.5%
Bachelor's degree or higher: 21.0%
Graduate or professional degree: 5.5%
Unemployed: 2.8%
Mean travel time to work (commute): 31.1 minutes
For population 15 years and over in 38547:
Never married: 14.9%
Now married: 65.1%
Separated: 1.7%
Widowed: 4.4%
Divorced: 14.0%
Zip code 38547 compared to state average:
Black race population percentage significantly below state average.
Hispanic race population percentage significantly below state average.
Median age above state average.
Foreign-born population percentage significantly below state average.
Renting percentage significantly below state average.
Length of stay since moving in significantly above state average.
Estimated median house/condo value in 2022: $258,173
38547:
$258,173
Tennessee:
$284,800
According to our research of Tennessee and other state lists, there were 5 registered sex offenders living in 38547 zip code as of May 28, 2024. The ratio of all residents to sex offenders in zip code 38547 is 369 to 1. The ratio of registered sex offenders to all residents in this zip code is near the state average.
Median resident age:
This zip code:
46.4 years
Tennessee median age:
39.2 years
Average household size:
This zip code:
2.3 people
Tennessee:
2.4 people
Averages for the 2020 tax year for zip code 38547, filed in 2021:
Average Adjusted Gross Income (AGI) in 2020: $59,942 (Individual Income Tax Returns)
Here:
$59,942
State:
$69,014
Salary/wage: $54,712 (reported on 85.0% of returns)
Here:
$54,712
State:
$55,872
(% of AGI for various income ranges: 1091.4% for AGIs below $25k, 3912.9% for AGIs $25k-50k, 6486.4% for AGIs $50k-75k, 9004.4% for AGIs $75k-100k, 13118.0% for AGIs $100k-200k)
Taxable interest for individuals: $641 (reported on 29.0% of returns)
This zip code:
$641
Tennessee:
$1,945
(% of AGI for various income ranges: 13.6% for AGIs below $25k, 22.4% for AGIs $25k-50k, 22.1% for AGIs $50k-75k, 11.1% for AGIs $75k-100k, 68.0% for AGIs $100k-200k)
Ordinary dividends: $2,325 (reported on 12.0% of returns)
Here:
$2,325
State:
$8,105
(% of AGI for various income ranges: 39.1% for AGIs below $25k, 50.7% for AGIs $50k-75k, 122.0% for AGIs $100k-200k)
Net capital gain/loss in AGI: +$17,773 (reported on 11.0% of returns)
Here:
+$17,773
State:
+$33,664
(% of AGI for various income ranges: 35.9% for AGIs below $25k, 49.3% for AGIs $50k-75k, 1807.0% for AGIs $100k-200k)
Profit/loss from business: +$25,213 (reported on 15.0% of returns)
Here:
+$25,213
State:
+$18,991
(% of AGI for various income ranges: 217.3% for AGIs below $25k, 184.8% for AGIs $25k-50k, 272.1% for AGIs $50k-75k, 2535.0% for AGIs $100k-200k)
Taxable individual retirement arrangement distribution: $14,680 (reported on 5.0% of returns)
38547:
$14,680
Tennessee:
$20,036
(% of AGI for various income ranges: 136.8% for AGIs below $25k, 481.1% for AGIs $75k-100k)
Total itemized deductions: $32,875 (reported on 4.0% of returns)
Here:
$32,875
State:
$40,136
(% of AGI for various income ranges: 1315.0% for AGIs $100k-200k)
Charity contributions: $17,267 (reported on 3.0% of returns)
Here:
$17,267
State:
$19,852
(% of AGI for various income ranges: 518.0% for AGIs $100k-200k)
Taxes paid: $5,075 (reported on 4.0% of returns)
38547:
$5,075
State:
$6,038
(% of AGI for various income ranges: 203.0% for AGIs $100k-200k)
Earned income credit: $2,173 (reported on 15.0% of returns)
Here:
$2,173
State:
$2,391
(% of AGI for various income ranges: 94.5% for AGIs below $25k, 56.2% for AGIs $25k-50k)
Percentage of individuals using paid preparers for their 2020 taxes: 94.0%
Here:
94%
State:
93%
(% for various income ranges: 93.1% for AGIs below $25k, 96.3% for AGIs $25k-50k, 88.9% for AGIs $50k-75k, 100.0% for AGIs $75k-100k, 92.3% for AGIs $100k-200k, 100.0% for AGIs over 200k)
Averages for the 2012 tax year for zip code 38547, filed in 2013:
Average Adjusted Gross Income (AGI) in 2012: $45,309 (Individual Income Tax Returns)
Here:
$45,309
State:
$53,767
Salary/wage: $41,117 (reported on 85.4% of returns)
Here:
$41,117
State:
$45,421
(% of AGI for various income ranges: 72.8% for AGIs below $25k, 85.3% for AGIs $25k-50k, 84.3% for AGIs $50k-75k, 91.1% for AGIs $75k-100k, 56.4% for AGIs $100k-200k)
Taxable interest for individuals: $696 (reported on 32.9% of returns)
This zip code:
$696
Tennessee:
$1,732
(% of AGI for various income ranges: 1.5% for AGIs below $25k, 0.4% for AGIs $25k-50k, 0.4% for AGIs $50k-75k, 0.1% for AGIs $75k-100k, 0.5% for AGIs $100k-200k)
Ordinary dividends: $2,038 (reported on 9.8% of returns)
Here:
$2,038
State:
$6,739
Net capital gain/loss in AGI: +$3,029 (reported on 8.5% of returns)
Here:
+$3,029
State:
+$19,082
Profit/loss from business: +$9,738 (reported on 15.9% of returns)
Here:
+$9,738
State:
+$15,240
(% of AGI for various income ranges: 11.5% for AGIs below $25k, 4.3% for AGIs $25k-50k, 5.7% for AGIs $50k-75k)
Taxable individual retirement arrangement distribution: $11,225 (reported on 4.9% of returns)
38547:
$11,225
Tennessee:
$15,505
Total itemized deductions: $17,607 (21% of AGI, reported on 17.1% of returns)
Here:
$17,607
State:
$21,976
Here:
21.4% of AGI
State:
17.8% of AGI
(% of AGI for various income ranges: 6.7% for AGIs $25k-50k, 6.5% for AGIs $50k-75k, 6.6% for AGIs $75k-100k, 9.5% for AGIs $100k-200k)
Charity contributions: $4,227 (reported on 13.4% of returns)
Here:
$4,227
State:
$6,709
(% of AGI for various income ranges: 0.8% for AGIs $25k-50k, 2.1% for AGIs $50k-75k, 2.5% for AGIs $100k-200k)
Taxes paid: $3,136 (reported on 17.1% of returns)
38547:
$3,136
State:
$4,829
(% of AGI for various income ranges: 1.0% for AGIs $25k-50k, 1.0% for AGIs $50k-75k, 1.2% for AGIs $75k-100k, 2.0% for AGIs $100k-200k)
Earned income credit: $2,394 (reported on 20.7% of returns)
Here:
$2,394
State:
$2,404
(% of AGI for various income ranges: 7.2% for AGIs below $25k, 1.4% for AGIs $25k-50k)
Percentage of individuals using paid preparers for their 2012 taxes: 65.9%
Here:
66%
State:
52%
(% for various income ranges: 61.3% for AGIs below $25k, 65.2% for AGIs $25k-50k, 69.2% for AGIs $50k-75k, 66.7% for AGIs $75k-100k, 83.3% for AGIs $100k-200k)
Averages for the 2004 tax year for zip code 38547, filed in 2005:
Average Adjusted Gross Income (AGI) in 2004: $35,770 (Individual Income Tax Returns)
Here:
$35,770
State:
$44,088
Salary/wage: $36,960 (reported on 84.2% of returns)
Here:
$36,960
State:
$38,825
(% of AGI for various income ranges: 97.7% for AGIs below $10k, 70.0% for AGIs $10k-25k, 91.8% for AGIs $25k-50k, 92.4% for AGIs $50k-75k, 95.7% for AGIs $75k-100k, 68.6% for AGIs over 100k)
Taxable interest for individuals: $954 (reported on 39.1% of returns)
This zip code:
$954
Tennessee:
$1,802
(% of AGI for various income ranges: 4.6% for AGIs below $10k, 4.2% for AGIs $10k-25k, 0.8% for AGIs $25k-50k, 0.3% for AGIs $50k-75k, 0.6% for AGIs $75k-100k, 0.4% for AGIs over 100k)
Taxable dividends: $670 (reported on 12.9% of returns)
Here:
$670
State:
$3,727
(% of AGI for various income ranges: 0.2% for AGIs below $10k, 1.0% for AGIs $10k-25k, 0.1% for AGIs $25k-50k, 0.2% for AGIs $50k-75k, 0.1% for AGIs $75k-100k, 0.3% for AGIs over 100k)
Net capital gain/loss: +$2,570 (reported on 10.2% of returns)
Here:
+$2,570
State:
+$15,776
(% of AGI for various income ranges: 1.6% for AGIs $10k-25k, 0.4% for AGIs $25k-50k, 0.3% for AGIs $50k-75k, 1.2% for AGIs $75k-100k, 1.2% for AGIs over 100k)
Profit/loss from business: +$6,662 (reported on 16.7% of returns)
Here:
+$6,662
State:
+$12,882
(% of AGI for various income ranges: 7.1% for AGIs below $10k, 9.6% for AGIs $10k-25k, 3.9% for AGIs $25k-50k, 2.8% for AGIs $50k-75k, -0.9% for AGIs $75k-100k)
Total itemized deductions: $15,294 (26% of AGI, reported on 21.0% of returns)
Here:
$15,294
State:
$18,035
Here:
26.2% of AGI
State:
19.9% of AGI
(% of AGI for various income ranges: 8.3% for AGIs $10k-25k, 8.0% for AGIs $25k-50k, 9.0% for AGIs $50k-75k, 11.2% for AGIs $75k-100k, 10.4% for AGIs over 100k)
Charity contributions deductions: $3,875 (6% of AGI, reported on 15.4% of returns)
Here:
$3,875
State:
$5,167
Here:
6.2% of AGI
State:
5.3% of AGI
(% of AGI for various income ranges: 0.8% for AGIs $10k-25k, 1.0% for AGIs $25k-50k, 1.5% for AGIs $50k-75k, 2.8% for AGIs $75k-100k, 3.4% for AGIs over 100k)
Total tax: $3,993 (reported on 76.2% of returns)
38547:
$3,993
State:
$7,482
(% of AGI for various income ranges: 5.6% for AGIs below $10k, 4.2% for AGIs $10k-25k, 6.4% for AGIs $25k-50k, 8.5% for AGIs $50k-75k, 9.9% for AGIs $75k-100k, 15.9% for AGIs over 100k)
Earned income credit: $1,774 (reported on 15.9% of returns)
Here:
$1,774
State:
$1,826
Percentage of individuals using paid preparers for their 2004 taxes: 71.9%
Here:
72%
State:
60%
(% for various income ranges: 62.2% for AGIs below $10k, 71.1% for AGIs $10k-25k, 74.5% for AGIs $25k-50k, 73.4% for AGIs $50k-75k, 87.2% for AGIs $75k-100k, 71.4% for AGIs over 100k)
Likely homosexual households (counted as self-reported same-sex unmarried-partner households)
Lesbian couples: 2.4% of all households
Gay men: 0.0% of all households
Household received Food Stamps/SNAP in the past 12 months: 24 Household did not receive Food Stamps/SNAP in the past 12 months: 727
Women who did not have a birth in the past 12 months: 336 (223 now married, 112 unmarried)
Housing units in zip code 38547 with a mortgage: 449 Median monthly owner costs for units with a mortgage: $1,263 Median monthly owner costs for units without a mortgage: $437
Residents with income below the poverty level in 2022:
This zip code:
11.2%
Whole state:
13.3%
Residents with income below 50% of the poverty level in 2022:
This zip code:
5.8%
Whole state:
7.1%
Median number of rooms in houses and condos:
Here:
6.1
State:
6.5
Median number of rooms in apartments:
Here:
6.4
State:
4.4
Notable locations in this zip code not listed on our city pages
Churches in zip code 38547 include: Sykes Church of Christ (A), Union Hill Cumberland Presbyterian Church (B), Brush Creek Baptist Church (C). Display/hide their locations on the map
Cemeteries: Bransford Cemetery (1), Brush Creek Cemetery (2), Moore Cemetery (3), Davis Cemetery (4), Phillips Cemetery (5). Display/hide their locations on the map
Size of family households: 280 2-persons, 174 3-persons, 55 4-persons, 34 5-persons, 11 6-persons, 4 7-or-more-persons
Size of nonfamily households: 173 1-person, 14 2-persons
230 married couples with children.
45 single-parent households (45 women).
95.4% of residents of 38547 zip code speak English at home.
2.1% of residents speak Spanish at home (56% very well, 44% well).
1.9% of residents speak other Indo-European language at home (94% very well, 6% not well).
0.3% of residents speak Asian or Pacific Island language at home (100% not well).
Foreign born population: 37 (2.1%) (52.4% of them are naturalized citizens)
This zip code:
2.1%
Whole state:
5.6%
43%India
16%France
16%Costa Rica
14%Bolivia
34%American
14%English
7%Irish
7%European
6%German
5%Italian
2%Iranian
Year of entry for the foreign-born population
122010 or later
82000 to 2009
121990 to 1999
5Before 1990
Housing units lacking complete plumbing facilities: 3.9% Housing units lacking complete kitchen facilities: 4.4%
55.3%Electricity
37.0%Utility gas
4.8%Bottled, tank, or LP gas
3.2%Wood
Population in 1990: 656. Population change in the 1990s: +861 (+131.2%).
Place of birth for U.S.-born residents:
This state: 1,056
Northeast: 161
Midwest: 172
South: 247
West: 74
56% of the 38547 zip code residents lived in the same house 5 years ago. Out of people who lived in different houses, 34% lived in this county. Out of people who lived in different counties, 50% lived in Tennessee.
98% of the 38547 zip code residents lived in the same house 1 year ago. Out of people who lived in different houses, 46% moved from this county. Out of people who lived in different houses, 75% moved from different county within same state.
Private vs. public school enrollment:
Students in private schools in grades 1 to 8 (elementary and middle school): 3
Here:
1.4%
Tennessee:
15.0%
Students in private schools in grades 9 to 12 (high school):
Here:
0.0%
Tennessee:
16.2%
Students in private undergraduate colleges:
Here:
0.0%
Tennessee:
23.5%
Occupation by median earnings in the past 12 months ($)
75,053Sales and related occupations
67,433Health diagnosing and treating practitioners and other technical occupations
66,897Construction and extraction occupations
54,096Installation, maintenance, and repair occupations
49,761Production occupations
37,928Transportation occupations
Top industries in this zip code by the number of employees in 2005:
Construction: Water and Sewer Line and Related Structures Construction (10-19 employees: 1 establishment)
Arts, Entertainment, and Recreation: Promoters of Performing Arts, Sports, and Similar Events without Facilities (1-4: 1)
Fatal accident statistics in 2014:
Fatal accident count: 1
Vehicles involved in fatal accidents: 2
Fatal accidents caused by drunken drivers: 0
Fatalities: 1
Persons involved in fatal accidents: 4
Pedestrians involved in fatal accidents: 0
Fatal accident statistics in 2013:
Fatal accident count: 1
Vehicles involved in fatal accidents: 2
Fatal accidents caused by drunken drivers: 0
Fatalities: 1
Persons involved in fatal accidents: 3
Pedestrians involved in fatal accidents: 0
2004 - 2018 National Fire Incident Reporting System (NFIRS) incidents
Based on the data from the years 2004 - 2018 the average number of fires per year is 11. The highest number of reported fire incidents - 26 took place in 2007, and the least - 0 in 2017. The data has a declining trend.
When looking into fire subcategories, the most reports belonged to: Structure Fires (43.0%), and Outside Fires (41.2%).
Fire incident types reported to NFIRS in Zip Code 38547


 Nearest zip codes: 38563, 37012, 38567, 37030, 37184, 38569.


 Based on the data from the years 2004 - 2018 the average number of fires per year is 11. The highest number of reported fire incidents - 26 took place in 2007, and the least - 0 in 2017. The data has a declining trend.
 When looking into fire subcategories, the most reports belonged to: Structure Fires (43.0%), and Outside Fires (41.2%).