Estimated zip code population in 2022: 3,227 Zip code population in 2010: 3,093 Zip code population in 2000: 2,519
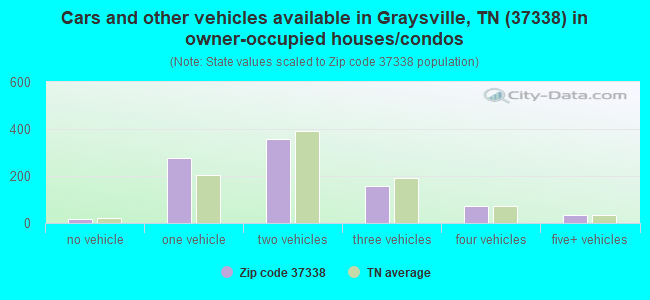
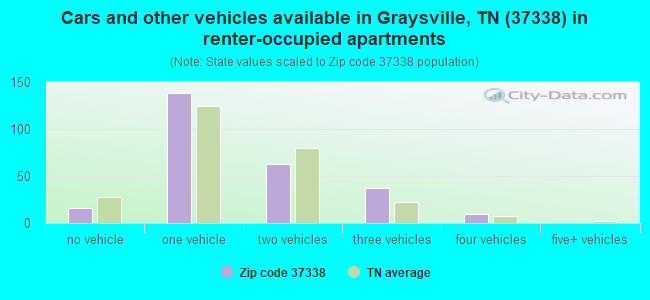
Houses and condos: 1,331 Renter-occupied apartments: 261
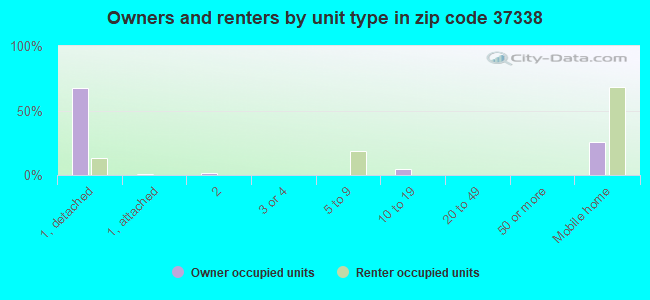
% of renters here:
22%
State:
33%
March 2022 cost of living index in zip code 37338: 79.1 (low, U.S. average is 100)
Land area: 75.3 sq. mi. Water area: 0.1 sq. mi.
Population density: 43 people per square mile
(very low).
OSM Map
General Map
Google Map
MSN Map
OSM Map
General Map
Google Map
MSN Map
OSM Map
General Map
Google Map
MSN Map
OSM Map
General Map
Google Map
MSN Map
Please wait while loading the map...
Real estate property taxes paid for housing units in 2022:
This zip code:
0.5% ($793)
Tennessee:
0.5% ($1,376)
Median real estate property taxes paid for housing units with mortgages in 2022: $1,049 (0.5%) Median real estate property taxes paid for housing units with no mortgage in 2022: $705 (0.5%)
Averages for the 2020 tax year for zip code 37338, filed in 2021:
Average Adjusted Gross Income (AGI) in 2020: $46,545 (Individual Income Tax Returns)
Here:
$46,545
State:
$69,014
Salary/wage: $42,644 (reported on 82.5% of returns)
Here:
$42,644
State:
$55,872
(% of AGI for various income ranges: 1009.6% for AGIs below $25k, 3653.1% for AGIs $25k-50k, 5916.5% for AGIs $50k-75k, 9250.0% for AGIs $75k-100k, 12479.0% for AGIs $100k-200k)
Taxable interest for individuals: $488 (reported on 18.2% of returns)
This zip code:
$488
Tennessee:
$1,945
(% of AGI for various income ranges: 4.3% for AGIs below $25k, 9.1% for AGIs $25k-50k, 15.3% for AGIs $50k-75k, 18.8% for AGIs $75k-100k, 37.0% for AGIs $100k-200k)
Ordinary dividends: $1,122 (reported on 6.3% of returns)
Here:
$1,122
State:
$8,105
(% of AGI for various income ranges: 5.4% for AGIs below $25k, 10.0% for AGIs $25k-50k, 7.1% for AGIs $50k-75k, 32.0% for AGIs $100k-200k)
Net capital gain/loss in AGI: +$5,078 (reported on 6.3% of returns)
Here:
+$5,078
State:
+$33,664
(% of AGI for various income ranges: 13.1% for AGIs $25k-50k, 35.9% for AGIs $50k-75k, 354.0% for AGIs $100k-200k)
Profit/loss from business: +$11,005 (reported on 14.0% of returns)
Here:
+$11,005
State:
+$18,991
(% of AGI for various income ranges: 132.2% for AGIs below $25k, 184.4% for AGIs $25k-50k, 204.1% for AGIs $50k-75k, 656.0% for AGIs $100k-200k)
Taxable individual retirement arrangement distribution: $14,529 (reported on 4.9% of returns)
37338:
$14,529
Tennessee:
$20,036
(% of AGI for various income ranges: 118.4% for AGIs $25k-50k, 797.5% for AGIs $75k-100k)
Total itemized deductions: $22,667 (reported on 2.1% of returns)
Here:
$22,667
State:
$40,136
(% of AGI for various income ranges: 212.5% for AGIs $25k-50k)
Taxes paid: $4,750 (reported on 1.4% of returns)
37338:
$4,750
State:
$6,038
(% of AGI for various income ranges: 29.7% for AGIs $25k-50k)
Earned income credit: $2,297 (reported on 24.5% of returns)
Here:
$2,297
State:
$2,391
(% of AGI for various income ranges: 117.4% for AGIs below $25k, 82.5% for AGIs $25k-50k)
Percentage of individuals using paid preparers for their 2020 taxes: 95.8%
Here:
96%
State:
93%
(% for various income ranges: 96.5% for AGIs below $25k, 92.5% for AGIs $25k-50k, 100.0% for AGIs $50k-75k, 90.9% for AGIs $75k-100k, 100.0% for AGIs $100k-200k, 100.0% for AGIs over 200k)
Averages for the 2012 tax year for zip code 37338, filed in 2013:
Average Adjusted Gross Income (AGI) in 2012: $38,682 (Individual Income Tax Returns)
Here:
$38,682
State:
$53,767
Salary/wage: $36,529 (reported on 85.7% of returns)
Here:
$36,529
State:
$45,421
(% of AGI for various income ranges: 75.7% for AGIs below $25k, 86.7% for AGIs $25k-50k, 87.2% for AGIs $50k-75k, 79.4% for AGIs $75k-100k, 71.8% for AGIs $100k-200k)
Taxable interest for individuals: $335 (reported on 19.3% of returns)
This zip code:
$335
Tennessee:
$1,732
(% of AGI for various income ranges: 0.4% for AGIs below $25k, 0.2% for AGIs $25k-50k, 0.1% for AGIs $75k-100k)
Ordinary dividends: $371 (reported on 5.9% of returns)
Here:
$371
State:
$6,739
(% of AGI for various income ranges: 0.1% for AGIs below $25k, 0.1% for AGIs $25k-50k)
Profit/loss from business: +$9,565 (reported on 14.3% of returns)
Here:
+$9,565
State:
+$15,240
(% of AGI for various income ranges: 9.1% for AGIs below $25k, 2.9% for AGIs $25k-50k, 0.8% for AGIs $50k-75k, 8.5% for AGIs $75k-100k)
Taxable individual retirement arrangement distribution: $8,180 (reported on 4.2% of returns)
37338:
$8,180
Tennessee:
$15,505
Total itemized deductions: $17,962 (22% of AGI, reported on 13.4% of returns)
Here:
$17,962
State:
$21,976
Here:
22.0% of AGI
State:
17.8% of AGI
(% of AGI for various income ranges: 5.4% for AGIs $25k-50k, 7.4% for AGIs $50k-75k, 8.3% for AGIs $75k-100k, 9.2% for AGIs $100k-200k)
Charity contributions: $4,108 (reported on 10.1% of returns)
Here:
$4,108
State:
$6,709
(% of AGI for various income ranges: 1.1% for AGIs below $25k, 1.0% for AGIs $50k-75k, 1.9% for AGIs $75k-100k, 1.9% for AGIs $100k-200k)
Taxes paid: $3,006 (reported on 13.4% of returns)
37338:
$3,006
State:
$4,829
(% of AGI for various income ranges: 0.6% for AGIs $25k-50k, 1.2% for AGIs $50k-75k, 1.3% for AGIs $75k-100k, 2.0% for AGIs $100k-200k)
Earned income credit: $2,471 (reported on 28.6% of returns)
Here:
$2,471
State:
$2,404
(% of AGI for various income ranges: 9.4% for AGIs below $25k, 1.6% for AGIs $25k-50k)
Percentage of individuals using paid preparers for their 2012 taxes: 52.9%
Here:
53%
State:
52%
(% for various income ranges: 50.9% for AGIs below $25k, 52.8% for AGIs $25k-50k, 62.5% for AGIs $50k-75k, 50.0% for AGIs $75k-100k, 50.0% for AGIs $100k-200k)
Averages for the 2004 tax year for zip code 37338, filed in 2005:
Average Adjusted Gross Income (AGI) in 2004: $29,174 (Individual Income Tax Returns)
Here:
$29,174
State:
$44,088
Salary/wage: $28,653 (reported on 89.4% of returns)
Here:
$28,653
State:
$38,825
(% of AGI for various income ranges: 96.7% for AGIs below $10k, 87.0% for AGIs $10k-25k, 89.7% for AGIs $25k-50k, 92.0% for AGIs $50k-75k, 77.6% for AGIs $75k-100k, 72.5% for AGIs over 100k)
Taxable interest for individuals: $537 (reported on 23.2% of returns)
This zip code:
$537
Tennessee:
$1,802
(% of AGI for various income ranges: 0.7% for AGIs below $10k, 0.5% for AGIs $10k-25k, 0.6% for AGIs $25k-50k, 0.2% for AGIs $50k-75k, 0.2% for AGIs $75k-100k, 0.3% for AGIs over 100k)
Taxable dividends: $417 (reported on 5.9% of returns)
Here:
$417
State:
$3,727
(% of AGI for various income ranges: 0.2% for AGIs $10k-25k, 0.1% for AGIs $25k-50k, 0.1% for AGIs $50k-75k, 0.1% for AGIs $75k-100k)
Net capital gain/loss: +$1,900 (reported on 4.9% of returns)
Here:
+$1,900
State:
+$15,776
(% of AGI for various income ranges: -0.9% for AGIs below $10k, 0.1% for AGIs $10k-25k, 0.0% for AGIs $25k-50k, 0.3% for AGIs $50k-75k, 3.7% for AGIs $75k-100k)
Profit/loss from business: +$3,280 (reported on 14.3% of returns)
Here:
+$3,280
State:
+$12,882
(% of AGI for various income ranges: 5.0% for AGIs below $10k, 3.9% for AGIs $10k-25k, 2.2% for AGIs $25k-50k, -0.2% for AGIs $50k-75k)
Total itemized deductions: $15,336 (28% of AGI, reported on 12.0% of returns)
Here:
$15,336
State:
$18,035
Here:
27.8% of AGI
State:
19.9% of AGI
(% of AGI for various income ranges: 6.6% for AGIs $10k-25k, 5.5% for AGIs $25k-50k, 7.1% for AGIs $50k-75k, 7.6% for AGIs $75k-100k, 7.8% for AGIs over 100k)
Charity contributions deductions: $2,577 (5% of AGI, reported on 9.1% of returns)
Here:
$2,577
State:
$5,167
Here:
4.6% of AGI
State:
5.3% of AGI
(% of AGI for various income ranges: 0.3% for AGIs $10k-25k, 0.8% for AGIs $25k-50k, 1.2% for AGIs $50k-75k, 1.6% for AGIs over 100k)
Total tax: $3,179 (reported on 67.4% of returns)
37338:
$3,179
State:
$7,482
(% of AGI for various income ranges: 3.8% for AGIs below $10k, 3.4% for AGIs $10k-25k, 6.1% for AGIs $25k-50k, 8.3% for AGIs $50k-75k, 12.0% for AGIs $75k-100k, 15.7% for AGIs over 100k)
Earned income credit: $1,622 (reported on 28.4% of returns)
Here:
$1,622
State:
$1,826
Percentage of individuals using paid preparers for their 2004 taxes: 66.5%
Here:
67%
State:
60%
(% for various income ranges: 60.3% for AGIs below $10k, 67.7% for AGIs $10k-25k, 67.9% for AGIs $25k-50k, 68.6% for AGIs $50k-75k, 73.3% for AGIs $75k-100k, 81.0% for AGIs over 100k)
Likely homosexual households (counted as self-reported same-sex unmarried-partner households)
Lesbian couples: 0.0% of all households
Gay men: 0.8% of all households
Household received Food Stamps/SNAP in the past 12 months: 293 Household did not receive Food Stamps/SNAP in the past 12 months: 876
Women who had a birth in the past 12 months: 13 (11 now married, 2 unmarried) Women who did not have a birth in the past 12 months: 562 (290 now married, 272 unmarried)
Housing units in zip code 37338 with a mortgage: 448 (47 second mortgage, 47 both second mortgage and home equity loan) Median monthly owner costs for units with a mortgage: $1,425 Median monthly owner costs for units without a mortgage: $356
Residents with income below the poverty level in 2022:
This zip code:
16.2%
Whole state:
13.3%
Residents with income below 50% of the poverty level in 2022:
This zip code:
7.6%
Whole state:
7.1%
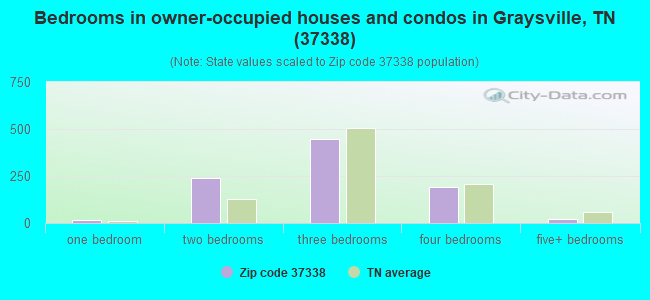
Median number of rooms in houses and condos:
Here:
5.7
State:
6.5
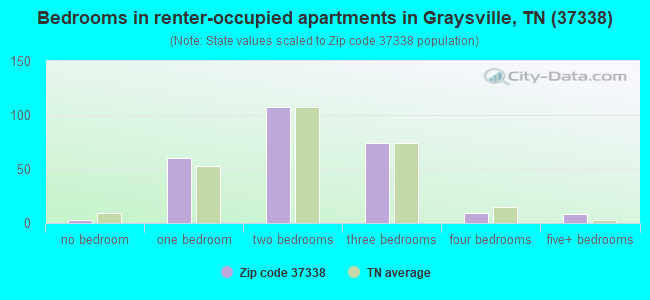
Median number of rooms in apartments:
Here:
4.1
State:
4.4
Notable locations in this zip code not listed on our city pages
Notable locations in zip code 37338: Lewis Chapel (A), Brayton-Hendon Community Center (B), Graysville Volunteer Fire Department (C), Lewis Chapel Volunteer Fire Department (D), Brayton Volunteer Fire Department (E), Rhea County Fire Department Station 780 Graysville Fire District (F). Display/hide their locations on the map
Churches in zip code 37338 include: Hopewell Church (A), Seventh Day Adventist Church (B), Graysville United Methodist Church (C), Graysville Church of God (D), First Baptist Church (E), Calvary Baptist Church (F), Brayton Church (G), Elder Church (H). Display/hide their locations on the map
Cemeteries: Lone Mountain Cemetery (1), Metz Cemetery (2), Harvey Cemetery (3), Hendon Cemetery (4), Hickory Grove Cemetery (5). Display/hide their locations on the map
243 married couples with children.
184 single-parent households (42 men, 142 women).
97.6% of residents of 37338 zip code speak English at home.
2.0% of residents speak Spanish at home (100% very well).
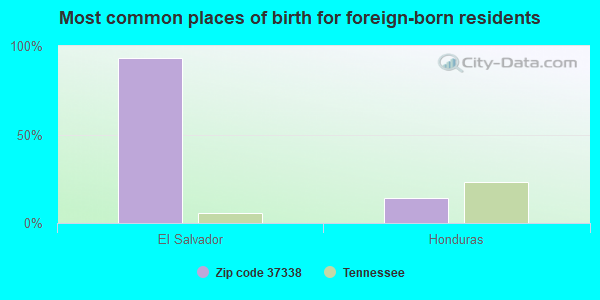
Foreign born population: 44 (1.4%) (16.5% of them are naturalized citizens)
This zip code:
1.4%
Whole state:
5.6%
93%El Salvador
14%Honduras
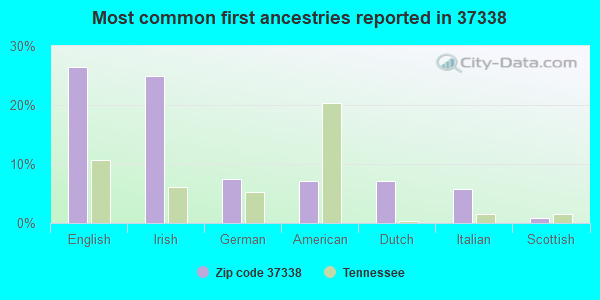
26%English
25%Irish
7%German
7%American
7%Dutch
6%Italian
1%Scottish
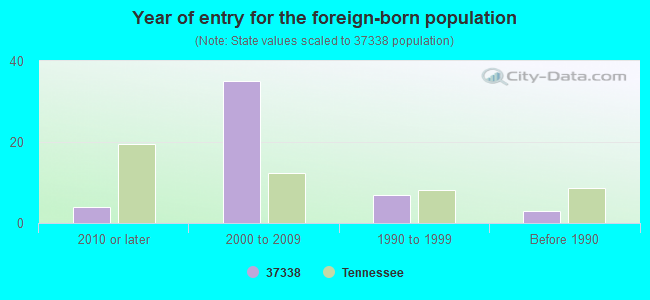
Year of entry for the foreign-born population
42010 or later
352000 to 2009
71990 to 1999
3Before 1990
Housing units lacking complete plumbing facilities: 7.2% Housing units lacking complete kitchen facilities: 7.6%
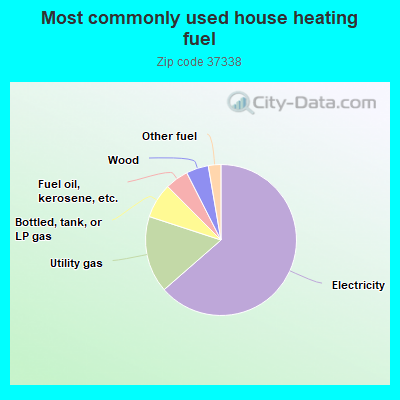
63.7%Electricity
16.5%Utility gas
7.5%Bottled, tank, or LP gas
5.0%Fuel oil, kerosene, etc.
4.8%Wood
2.7%Other fuel
Population in 1990: 1,067. Population change in the 1990s: +1,452 (+136.1%).
Place of birth for U.S.-born residents:
This state: 1,952
Northeast: 174
Midwest: 495
South: 479
West: 56
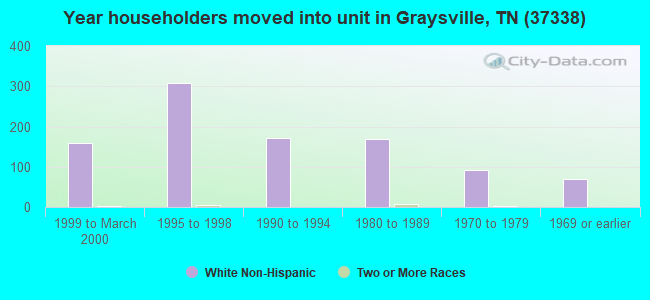
57% of the 37338 zip code residents lived in the same house 5 years ago. Out of people who lived in different houses, 49% lived in this county. Out of people who lived in different counties, 50% lived in Tennessee.
90% of the 37338 zip code residents lived in the same house 1 year ago. Out of people who lived in different houses, 33% moved from this county. Out of people who lived in different houses, 50% moved from different county within same state. Out of people who lived in different houses, 19% moved from different state.
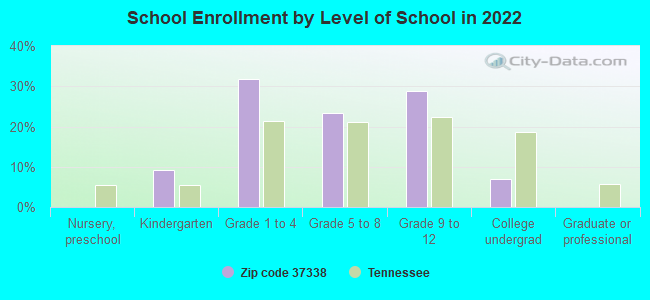
Private vs. public school enrollment:
Students in private schools in grades 1 to 8 (elementary and middle school): 14
Here:
5.1%
Tennessee:
15.0%
Students in private schools in grades 9 to 12 (high school): 53
Here:
36.0%
Tennessee:
16.2%
Students in private undergraduate colleges: 8
Here:
23.7%
Tennessee:
23.5%
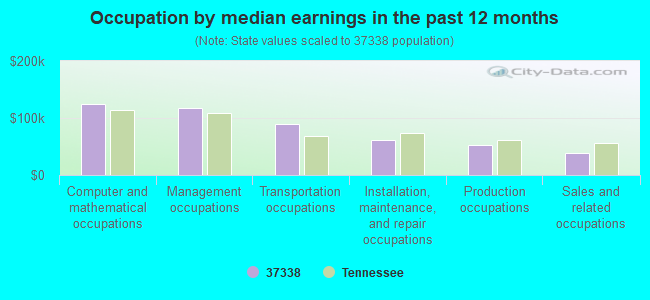
Occupation by median earnings in the past 12 months ($)
124,857Computer and mathematical occupations
116,671Management occupations
89,560Transportation occupations
61,088Installation, maintenance, and repair occupations
52,212Production occupations
37,892Sales and related occupations
Companies with federal contracts located in this zip code:
STRINGER BEAD WELDING (HCR 71 BOX 76 in GRAYSVILLE, TN; small business)
$4,450 with U.S. Army Corps of Engineers - civil program financing only for Lectures For Training. Signed on 2003-07-02. Completion date: 2003-06-24.
Top industries in this zip code by the number of employees in 2005:
Construction: Plumbing, Heating, and Air-Conditioning Contractors (10-19 employees: 1 establishment)
Accommodation and Food Services: Limited-Service Restaurants (10-19: 1)
Wholesale Trade: Medical, Dental, and Hospital Equipment and Supplies Merchant Wholesalers (5-9: 1)
Construction: Other Building Finishing Contractors (5-9: 1)
Administrative and Support and Waste Management and Remediation Services: Exterminating and Pest Control Services (1-4: 1)
Mining: Construction Sand and Gravel Mining (1-4: 1)
Other Services (except Public Administration): Religious Organizations (1-4: 1)
People in group quarters in 2010:
7 people in workers' group living quarters and job corps centers
People in group quarters in 2000:
8 people in other noninstitutional group quarters
Fatal accident statistics in 2013:
Fatal accident count: 1
Vehicles involved in fatal accidents: 1
Fatal accidents caused by drunken drivers: 0
Fatalities: 1
Persons involved in fatal accidents: 1
Pedestrians involved in fatal accidents: 0
2002 - 2018 National Fire Incident Reporting System (NFIRS) incidents
According to the data from the years 2002 - 2018 the average number of fire incidents per year is 17. The highest number of fire incidents - 39 took place in 2006, and the least - 0 in 2003. The data has an increasing trend.
When looking into fire subcategories, the most incidents belonged to: Outside Fires (44.4%), and Structure Fires (38.0%).
Fire incident types reported to NFIRS in Zip Code 37338

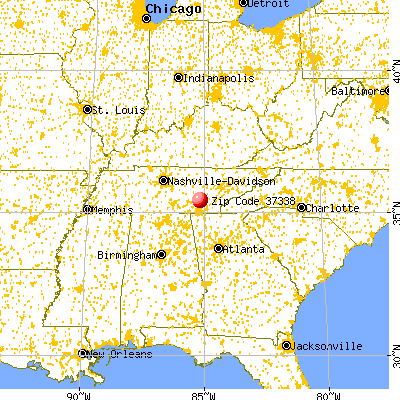


 Nearest zip codes: 37373, 37379, 37367, 37327, 37321, 37308.
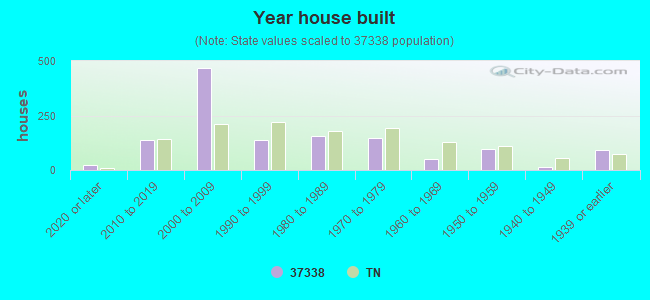


 According to the data from the years 2002 - 2018 the average number of fire incidents per year is 17. The highest number of fire incidents - 39 took place in 2006, and the least - 0 in 2003. The data has an increasing trend.
 When looking into fire subcategories, the most incidents belonged to: Outside Fires (44.4%), and Structure Fires (38.0%).