Estimated zip code population in 2022: 4,613 Zip code population in 2010: 4,621 Zip code population in 2000: 4,662
Houses and condos: 2,024 Renter-occupied apartments: 400
% of renters here:
24%
State:
31%
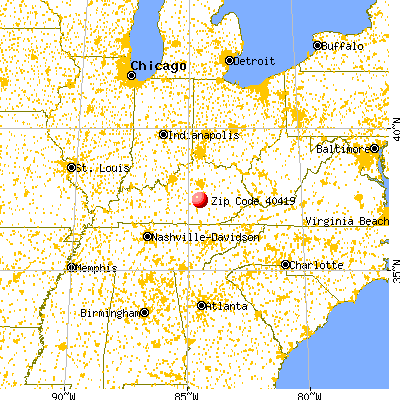
March 2022 cost of living index in zip code 40419: 80.9 (low, U.S. average is 100)
Land area: 92.1 sq. mi. Water area: 0.5 sq. mi.
Population density: 50 people per square mile
(very low).
OSM Map
General Map
Google Map
MSN Map
OSM Map
General Map
Google Map
MSN Map
OSM Map
General Map
Google Map
MSN Map
OSM Map
General Map
Google Map
MSN Map
Please wait while loading the map...
Real estate property taxes paid for housing units in 2022:
This zip code:
0.6% ($827)
Kentucky:
0.7% ($1,456)
Median real estate property taxes paid for housing units with mortgages in 2022: $961 (0.7%) Median real estate property taxes paid for housing units with no mortgage in 2022: $575 (0.5%)
Business Search- 14 Million verified businesses
Males: 2,479
(53.7%)
Females: 2,133
(46.3%)
For population 25 years and over in 40419:
High school or higher: 78.7%
Bachelor's degree or higher: 11.6%
Graduate or professional degree: 4.1%
Unemployed: 7.6%
Mean travel time to work (commute): 32.1 minutes
For population 15 years and over in 40419:
Never married: 23.3%
Now married: 60.2%
Separated: 1.7%
Widowed: 4.7%
Divorced: 10.1%
Zip code 40419 compared to state average:
Unemployed percentage above state average.
Black race population percentage significantly below state average.
Hispanic race population percentage below state average.
Foreign-born population percentage significantly below state average.
Length of stay since moving in significantly above state average.
Number of college students below state average.
Percentage of population with a bachelor's degree or higher significantly below state average.
Averages for the 2020 tax year for zip code 40419, filed in 2021:
Average Adjusted Gross Income (AGI) in 2020: $42,464 (Individual Income Tax Returns)
Here:
$42,464
State:
$61,342
Salary/wage: $36,931 (reported on 76.8% of returns)
Here:
$36,931
State:
$50,827
(% of AGI for various income ranges: 1042.5% for AGIs below $25k, 3387.9% for AGIs $25k-50k, 6060.0% for AGIs $50k-75k, 9638.8% for AGIs $75k-100k, 14570.0% for AGIs $100k-200k)
Taxable interest for individuals: $994 (reported on 18.5% of returns)
This zip code:
$994
Kentucky:
$1,441
(% of AGI for various income ranges: 15.4% for AGIs below $25k, 20.0% for AGIs $25k-50k, 33.2% for AGIs $50k-75k, 15.0% for AGIs $75k-100k, 115.7% for AGIs $100k-200k)
Ordinary dividends: $1,311 (reported on 5.4% of returns)
Here:
$1,311
State:
$7,388
(% of AGI for various income ranges: 4.2% for AGIs below $25k, 6.7% for AGIs $25k-50k, 16.3% for AGIs $50k-75k, 58.6% for AGIs $100k-200k)
Net capital gain/loss in AGI: +$11,164 (reported on 6.5% of returns)
Here:
+$11,164
State:
+$19,475
(% of AGI for various income ranges: 8.8% for AGIs below $25k, 28.7% for AGIs $25k-50k, 218.9% for AGIs $50k-75k, 940.0% for AGIs $100k-200k)
Profit/loss from business: +$17,297 (reported on 19.0% of returns)
Here:
+$17,297
State:
+$11,386
(% of AGI for various income ranges: 260.8% for AGIs below $25k, 344.6% for AGIs $25k-50k, 668.9% for AGIs $50k-75k, 855.0% for AGIs $75k-100k, 1405.7% for AGIs $100k-200k)
Taxable individual retirement arrangement distribution: $7,667 (reported on 5.4% of returns)
40419:
$7,667
Kentucky:
$18,941
(% of AGI for various income ranges: 35.2% for AGIs below $25k, 61.8% for AGIs $25k-50k, 147.4% for AGIs $50k-75k)
Total itemized deductions: $35,850 (reported on 1.2% of returns)
Here:
$35,850
State:
$32,473
(% of AGI for various income ranges: 377.4% for AGIs $50k-75k)
Taxes paid: $7,500 (reported on 1.2% of returns)
40419:
$7,500
State:
$7,830
(% of AGI for various income ranges: 38.5% for AGIs $25k-50k)
Earned income credit: $2,602 (reported on 23.8% of returns)
Here:
$2,602
State:
$2,336
(% of AGI for various income ranges: 142.7% for AGIs below $25k, 91.3% for AGIs $25k-50k)
Percentage of individuals using paid preparers for their 2020 taxes: 95.8%
Here:
96%
State:
94%
(% for various income ranges: 95.5% for AGIs below $25k, 96.0% for AGIs $25k-50k, 96.3% for AGIs $50k-75k, 100.0% for AGIs $75k-100k, 91.7% for AGIs $100k-200k)
Averages for the 2012 tax year for zip code 40419, filed in 2013:
Average Adjusted Gross Income (AGI) in 2012: $33,158 (Individual Income Tax Returns)
Here:
$33,158
State:
$50,814
Salary/wage: $31,422 (reported on 77.4% of returns)
Here:
$31,422
State:
$42,723
(% of AGI for various income ranges: 62.9% for AGIs below $25k, 77.6% for AGIs $25k-50k, 81.3% for AGIs $50k-75k, 75.4% for AGIs $75k-100k, 57.4% for AGIs $100k-200k)
Taxable interest for individuals: $781 (reported on 27.7% of returns)
This zip code:
$781
Kentucky:
$1,381
(% of AGI for various income ranges: 1.3% for AGIs below $25k, 1.0% for AGIs $25k-50k, 0.3% for AGIs $50k-75k, 0.1% for AGIs $75k-100k)
Ordinary dividends: $864 (reported on 7.1% of returns)
Here:
$864
State:
$6,239
(% of AGI for various income ranges: 0.2% for AGIs $25k-50k, 0.4% for AGIs $50k-75k)
Net capital gain/loss in AGI: +$2,550 (reported on 12.9% of returns)
Here:
+$2,550
State:
+$11,336
(% of AGI for various income ranges: 1.4% for AGIs below $25k, 1.4% for AGIs $25k-50k, 0.1% for AGIs $50k-75k, 2.0% for AGIs $75k-100k)
Profit/loss from business: +$11,188 (reported on 21.9% of returns)
Here:
+$11,188
State:
+$10,862
(% of AGI for various income ranges: 20.1% for AGIs below $25k, 7.2% for AGIs $25k-50k, 5.6% for AGIs $50k-75k)
Taxable individual retirement arrangement distribution: $9,900 (reported on 3.9% of returns)
40419:
$9,900
Kentucky:
$14,296
Total itemized deductions: $16,313 (25% of AGI, reported on 14.8% of returns)
Here:
$16,313
State:
$21,160
Here:
25.3% of AGI
State:
20.0% of AGI
(% of AGI for various income ranges: 4.1% for AGIs below $25k, 4.7% for AGIs $25k-50k, 8.6% for AGIs $50k-75k, 11.1% for AGIs $75k-100k, 11.7% for AGIs $100k-200k)
Charity contributions: $3,875 (reported on 10.3% of returns)
Here:
$3,875
State:
$4,303
(% of AGI for various income ranges: 1.0% for AGIs $25k-50k, 1.7% for AGIs $50k-75k, 1.8% for AGIs $75k-100k, 1.8% for AGIs $100k-200k)
Taxes paid: $5,030 (reported on 14.8% of returns)
40419:
$5,030
State:
$8,496
(% of AGI for various income ranges: 0.4% for AGIs below $25k, 1.2% for AGIs $25k-50k, 2.3% for AGIs $50k-75k, 4.1% for AGIs $75k-100k, 5.8% for AGIs $100k-200k)
Earned income credit: $2,362 (reported on 31.0% of returns)
Here:
$2,362
State:
$2,273
(% of AGI for various income ranges: 9.3% for AGIs below $25k, 1.5% for AGIs $25k-50k)
Percentage of individuals using paid preparers for their 2012 taxes: 77.4%
Here:
77%
State:
60%
(% for various income ranges: 72.2% for AGIs below $25k, 80.5% for AGIs $25k-50k, 87.0% for AGIs $50k-75k, 87.5% for AGIs $75k-100k, 75.0% for AGIs $100k-200k)
Averages for the 2004 tax year for zip code 40419, filed in 2005:
Average Adjusted Gross Income (AGI) in 2004: $27,523 (Individual Income Tax Returns)
Here:
$27,523
State:
$41,540
Salary/wage: $26,578 (reported on 79.1% of returns)
Here:
$26,578
State:
$36,432
(% of AGI for various income ranges: 76.1% for AGIs below $10k, 71.8% for AGIs $10k-25k, 84.8% for AGIs $25k-50k, 84.0% for AGIs $50k-75k, 83.8% for AGIs $75k-100k, 28.5% for AGIs over 100k)
Taxable interest for individuals: $1,224 (reported on 29.2% of returns)
This zip code:
$1,224
Kentucky:
$1,571
(% of AGI for various income ranges: 5.3% for AGIs below $10k, 1.9% for AGIs $10k-25k, 1.0% for AGIs $25k-50k, 1.0% for AGIs $50k-75k, 0.2% for AGIs $75k-100k, 0.9% for AGIs over 100k)
Taxable dividends: $691 (reported on 5.5% of returns)
Here:
$691
State:
$3,453
(% of AGI for various income ranges: 0.1% for AGIs below $10k, 0.2% for AGIs $10k-25k, 0.1% for AGIs $25k-50k, 0.2% for AGIs $50k-75k, 0.6% for AGIs $75k-100k)
Net capital gain/loss: +$8,264 (reported on 7.6% of returns)
Here:
+$8,264
State:
+$9,663
(% of AGI for various income ranges: 1.9% for AGIs below $10k, 1.5% for AGIs $10k-25k, 1.3% for AGIs $25k-50k, 0.6% for AGIs $50k-75k, 14.1% for AGIs over 100k)
Profit/loss from business: +$9,809 (reported on 22.6% of returns)
Here:
+$9,809
State:
+$9,233
(% of AGI for various income ranges: 22.8% for AGIs below $10k, 14.0% for AGIs $10k-25k, 7.5% for AGIs $25k-50k, 5.5% for AGIs $50k-75k, 3.5% for AGIs $75k-100k)
IRA payment deduction: $1,615 (reported on 0.8% of returns)
40419:
$1,615
Kentucky:
$2,955
Total itemized deductions: $13,610 (25% of AGI, reported on 13.6% of returns)
Here:
$13,610
State:
$17,474
Here:
25.0% of AGI
State:
21.0% of AGI
(% of AGI for various income ranges: 3.7% for AGIs $10k-25k, 7.2% for AGIs $25k-50k, 8.3% for AGIs $50k-75k, 11.3% for AGIs $75k-100k, 7.0% for AGIs over 100k)
Charity contributions deductions: $2,574 (4% of AGI, reported on 8.7% of returns)
Here:
$2,574
State:
$3,494
Here:
4.3% of AGI
State:
4.0% of AGI
(% of AGI for various income ranges: 0.4% for AGIs $10k-25k, 0.7% for AGIs $25k-50k, 1.1% for AGIs $50k-75k, 1.1% for AGIs $75k-100k, 1.7% for AGIs over 100k)
Total tax: $3,073 (reported on 65.5% of returns)
40419:
$3,073
State:
$6,162
(% of AGI for various income ranges: 3.6% for AGIs below $10k, 4.0% for AGIs $10k-25k, 5.7% for AGIs $25k-50k, 8.3% for AGIs $50k-75k, 10.2% for AGIs $75k-100k, 18.1% for AGIs over 100k)
Earned income credit: $1,779 (reported on 28.0% of returns)
Here:
$1,779
State:
$1,723
Percentage of individuals using paid preparers for their 2004 taxes: 82.0%
Here:
82%
State:
66%
(% for various income ranges: 80.4% for AGIs below $10k, 81.7% for AGIs $10k-25k, 82.3% for AGIs $25k-50k, 84.8% for AGIs $50k-75k, 80.5% for AGIs $75k-100k, 95.0% for AGIs over 100k)
Household received Food Stamps/SNAP in the past 12 months: 459 Household did not receive Food Stamps/SNAP in the past 12 months: 1,213
Women who had a birth in the past 12 months: 39 (22 now married, 17 unmarried) Women who did not have a birth in the past 12 months: 898 (597 now married, 305 unmarried)
Housing units in zip code 40419 with a mortgage: 638 (89 second mortgage, 89 both second mortgage and home equity loan) Houses without a mortgage: 20
Median monthly owner costs for units with a mortgage: $993 Median monthly owner costs for units without a mortgage: $294
Residents with income below the poverty level in 2022:
This zip code:
19.8%
Whole state:
16.5%
Residents with income below 50% of the poverty level in 2022:
This zip code:
12.7%
Whole state:
9.0%
Median number of rooms in houses and condos:
Here:
6.1
State:
6.4
Median number of rooms in apartments:
Here:
5.0
State:
4.4
Notable locations in this zip code not listed on our city pages
Notable locations in zip code 40419: Christian Assembly Campground (A), Lincoln County Fire Department Station 2 (B), Crab Orchard Fire Department (C), Lincoln County Fire Department Station 6 (D), East End Ambulance Service (E). Display/hide their locations on the map
Churches in zip code 40419 include: Flatwood Church (A), Friendship Church (B), Gilbert Henry Church (C), Good Hope Church (D), Watts Chapel Baptist Church (E), Harmony Church (F), Lawsons Chapel (G), Leavell Green Church (H), Liberty Church (I). Display/hide their locations on the map
Cemeteries: Brock Cemetery (1), Liberty Church Cemetery (2), Vanhock Cemetery (3), Collett Cemetery (4), Davis Cemetery (5), Stringtown Cemetery (6), Old Moss Cemetery (7). Display/hide their locations on the map
Streams, rivers, and creeks: Drakes Creek (A), Copper Creek (B), Turkey Creek (C), Cedar Creek (D), Slaty Branch (E), Long Branch (F), Mudlick Branch (G), Indian Branch (H), Harness Branch (I). Display/hide their locations on the map
In group quarters: 27 (-1 institutionalized population)
Size of family households: 454 2-persons, 295 3-persons, 252 4-persons, 145 5-persons, 103 6-persons, 45 7-or-more-persons
Size of nonfamily households: 332 1-person, 31 2-persons
998 married couples with children.
85 single-parent households (4 men, 81 women).
93.0% of residents of 40419 zip code speak English at home.
0.6% of residents speak Spanish at home (12% very well, 88% well).
6.7% of residents speak other Indo-European language at home (55% very well, 38% well, 7% not well).
Foreign born population: 0 (0.0%)
:
0.0%
Whole state:
4.0%
62%American
6%English
4%Pennsylvania German
4%European
3%German
2%Irish
2%Scottish
Facilities with environmental interests located in this zip code:
FIELD'S GROCERY (8290 HWY 1781 in CRAB ORCHARD, KY)
(Resource Conservation and Recovery Act (tracking hazardous waste)) Organizations: ROGER ADAMS (CONTACT/OWNER)
Housing units lacking complete plumbing facilities: 6.2% Housing units lacking complete kitchen facilities: 7.3%
79.9%Electricity
10.1%Wood
6.4%Bottled, tank, or LP gas
1.2%Fuel oil, kerosene, etc.
0.9%Utility gas
0.7%No fuel used
0.6%Coal or coke
Population in 1990: 5,197.
Place of birth for U.S.-born residents:
This state: 3,878
Northeast: 39
Midwest: 387
South: 247
West: 25
55% of the 40419 zip code residents lived in the same house 5 years ago. Out of people who lived in different houses, 49% lived in this county. Out of people who lived in different counties, 50% lived in Kentucky.
88% of the 40419 zip code residents lived in the same house 1 year ago. Out of people who lived in different houses, 71% moved from this county. Out of people who lived in different houses, 12% moved from different county within same state. Out of people who lived in different houses, 13% moved from different state. Out of people who lived in different houses, 1% moved from abroad.
Private vs. public school enrollment:
Students in private schools in grades 1 to 8 (elementary and middle school): 157
Here:
28.3%
Kentucky:
17.2%
Students in private schools in grades 9 to 12 (high school):
Here:
0.0%
Kentucky:
15.2%
Students in private undergraduate colleges: 27
Here:
33.7%
Kentucky:
19.6%
Occupation by median earnings in the past 12 months ($)
99,376Health diagnosing and treating practitioners and other technical occupations
43,714Community and social service occupations
42,242Production occupations
40,375Healthcare support occupations
38,790Education, training, and library occupations
35,862Management occupations
Companies with federal contracts located in this zip code:
LOCKER SPECIALTIES (223 MAIN ST in CRAB ORCHARD, KY; small business) : $69,402 in 8 contractsfrom 2004 to 2005
Contracts for Plumbing Fixtures and Accessories, Maintenance, Repair or Alteration of Real Property -- Miscellaneous Buildings by U.S. Army Corps of Engineers - civil program financing only, Army Signed by year:2000: $0; 2001: $0; 2002: $0; 2003: $0; 2004: $45,178; 2005: $24,224; 2006: $0.
Biggest contracts:
$15,494 with U.S. Army Corps of Engineers - civil program financing only for Plumbing Fixtures and Accessories. Signed on 2004-03-09. Completion date: 2004-04-30.
$15,494 with Army for Plumbing Fixtures and Accessories. Signed on 2004-03-09. Completion date: 2004-04-30.
$11,887 with Army for Maintenance, Repair or Alteration of Real Property -- Miscellaneous Buildings. Signed on 2005-01-18. Completion date: 2005-03-28.
$11,887 with U.S. Army Corps of Engineers - civil program financing only for Maintenance, Repair or Alteration of Real Property -- Miscellaneous Buildings. Signed on 2005-01-18. Completion date: 2005-03-28.
Top industries in this zip code by the number of employees in 2005:
Wholesale Trade: Recyclable Material Merchant Wholesalers (10-19 employees: 1 establishment)
Finance and Insurance: Commercial Banking (10-19: 1)
Construction: All Other Specialty Trade Contractors (5-9: 1)
Other Services (except Public Administration): Funeral Homes and Funeral Services (5-9: 1)
Other Services (except Public Administration): Automotive Body, Paint, and Interior Repair and Maintenance (1-4: 1)
People in group quarters in 2010:
14 people in group homes intended for adults
People in group quarters in 2000:
3 people in other noninstitutional group quarters
Fatal accident statistics in 2012:
Fatal accident count: 1
Vehicles involved in fatal accidents: 1
Fatal accidents caused by drunken drivers: 0
Fatalities: 1
Persons involved in fatal accidents: 1
Pedestrians involved in fatal accidents: 0
Fatal accident statistics in 2011:
Fatal accident count: 2
Vehicles involved in fatal accidents: 2
Fatal accidents caused by drunken drivers: 2
Fatalities: 2
Persons involved in fatal accidents: 3
Pedestrians involved in fatal accidents: 0
2002 - 2018 National Fire Incident Reporting System (NFIRS) incidents
According to the data from the years 2002 - 2018 the average number of fire incidents per year is 13. The highest number of reported fire incidents - 25 took place in 2014, and the least - 2 in 2004. The data has an increasing trend.
When looking into fire subcategories, the most incidents belonged to: Structure Fires (55.4%), and Outside Fires (30.4%).
Fire incident types reported to NFIRS in Zip Code 40419


 Nearest zip codes: 40409, 40461, 40489, 40484, 40456, 42567.


 According to the data from the years 2002 - 2018 the average number of fire incidents per year is 13. The highest number of reported fire incidents - 25 took place in 2014, and the least - 2 in 2004. The data has an increasing trend.
 When looking into fire subcategories, the most incidents belonged to: Structure Fires (55.4%), and Outside Fires (30.4%).