Estimated zip code population in 2022: 11,545 Zip code population in 2010: 10,785 Zip code population in 2000: 9,435
Houses and condos: 4,677 Renter-occupied apartments: 1,307
% of renters here:
29%
State:
31%
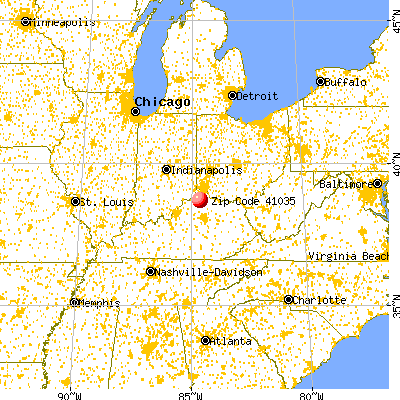
March 2022 cost of living index in zip code 41035: 81.3 (low, U.S. average is 100)
Land area: 106.5 sq. mi. Water area: 1.4 sq. mi.
Population density: 108 people per square mile
(very low).
OSM Map
General Map
Google Map
MSN Map
OSM Map
General Map
Google Map
MSN Map
OSM Map
General Map
Google Map
MSN Map
OSM Map
General Map
Google Map
MSN Map
Please wait while loading the map...
Real estate property taxes paid for housing units in 2022:
This zip code:
0.7% ($1,303)
Kentucky:
0.7% ($1,456)
Median real estate property taxes paid for housing units with mortgages in 2022: $1,477 (0.7%) Median real estate property taxes paid for housing units with no mortgage in 2022: $940 (0.6%)
Business Search- 14 Million verified businesses
Males: 5,712
(49.5%)
Females: 5,833
(50.5%)
For population 25 years and over in 41035:
High school or higher: 86.4%
Bachelor's degree or higher: 12.8%
Graduate or professional degree: 4.3%
Unemployed: 1.6%
Mean travel time to work (commute): 31.4 minutes
For population 15 years and over in 41035:
Never married: 34.3%
Now married: 50.1%
Separated: 0.8%
Widowed: 5.8%
Divorced: 9.0%
Zip code 41035 compared to state average:
Unemployed percentage below state average.
Black race population percentage significantly below state average.
Median age below state average.
Foreign-born population percentage significantly below state average.
Length of stay since moving in above state average.
House age below state average.
Percentage of population with a bachelor's degree or higher significantly below state average.
Estimated median house/condo value in 2022: $191,088
41035:
$191,088
Kentucky:
$196,300
According to our research of Kentucky and other state lists, there were 25 registered sex offenders living in 41035 zip code as of May 28, 2024. The ratio of all residents to sex offenders in zip code 41035 is 426 to 1. The ratio of registered sex offenders to all residents in this zip code is near the state average.
Median resident age:
This zip code:
35.0 years
Kentucky median age:
39.4 years
Average household size:
This zip code:
2.6 people
Kentucky:
2.4 people
Averages for the 2020 tax year for zip code 41035, filed in 2021:
Average Adjusted Gross Income (AGI) in 2020: $52,986 (Individual Income Tax Returns)
Here:
$52,986
State:
$61,342
Salary/wage: $46,235 (reported on 87.1% of returns)
Here:
$46,235
State:
$50,827
(% of AGI for various income ranges: 1154.1% for AGIs below $25k, 3571.4% for AGIs $25k-50k, 6387.5% for AGIs $50k-75k, 9124.5% for AGIs $75k-100k, 16315.6% for AGIs $100k-200k, 49560.0% for AGIs over 200k)
Taxable interest for individuals: $936 (reported on 17.8% of returns)
This zip code:
$936
Kentucky:
$1,441
(% of AGI for various income ranges: 9.5% for AGIs below $25k, 9.0% for AGIs $25k-50k, 34.0% for AGIs $50k-75k, 36.3% for AGIs $75k-100k, 37.5% for AGIs $100k-200k, 443.3% for AGIs over 200k)
Ordinary dividends: $5,798 (reported on 8.8% of returns)
Here:
$5,798
State:
$7,388
(% of AGI for various income ranges: 11.5% for AGIs below $25k, 20.0% for AGIs $25k-50k, 26.8% for AGIs $50k-75k, 60.3% for AGIs $75k-100k, 148.1% for AGIs $100k-200k, 4306.7% for AGIs over 200k)
Net capital gain/loss in AGI: +$9,922 (reported on 7.8% of returns)
Here:
+$9,922
State:
+$19,475
(% of AGI for various income ranges: 8.5% for AGIs below $25k, 6.0% for AGIs $25k-50k, 25.4% for AGIs $50k-75k, 63.4% for AGIs $75k-100k, 220.0% for AGIs $100k-200k, 8636.7% for AGIs over 200k)
Profit/loss from business: +$9,058 (reported on 11.8% of returns)
Here:
+$9,058
State:
+$11,386
(% of AGI for various income ranges: 88.6% for AGIs below $25k, 66.0% for AGIs $25k-50k, 149.8% for AGIs $50k-75k, 286.6% for AGIs $75k-100k, 399.4% for AGIs $100k-200k)
Taxable individual retirement arrangement distribution: $15,697 (reported on 5.7% of returns)
41035:
$15,697
Kentucky:
$18,941
(% of AGI for various income ranges: 39.9% for AGIs below $25k, 65.0% for AGIs $25k-50k, 123.8% for AGIs $50k-75k, 257.6% for AGIs $75k-100k, 417.5% for AGIs $100k-200k)
Total itemized deductions: $24,814 (reported on 4.1% of returns)
Here:
$24,814
State:
$32,473
(% of AGI for various income ranges: 71.7% for AGIs $25k-50k, 76.8% for AGIs $50k-75k, 224.7% for AGIs $75k-100k, 513.1% for AGIs $100k-200k, 4006.7% for AGIs over 200k)
Charity contributions: $8,900 (reported on 3.1% of returns)
Here:
$8,900
State:
$13,472
(% of AGI for various income ranges: 18.2% for AGIs $25k-50k, 43.9% for AGIs $75k-100k, 160.3% for AGIs $100k-200k, 1570.0% for AGIs over 200k)
Taxes paid: $7,215 (reported on 3.9% of returns)
41035:
$7,215
State:
$7,830
(% of AGI for various income ranges: 9.7% for AGIs $25k-50k, 24.9% for AGIs $50k-75k, 71.8% for AGIs $75k-100k, 161.1% for AGIs $100k-200k, 1070.0% for AGIs over 200k)
Earned income credit: $2,304 (reported on 19.4% of returns)
Here:
$2,304
State:
$2,336
(% of AGI for various income ranges: 101.5% for AGIs below $25k, 78.3% for AGIs $25k-50k)
Percentage of individuals using paid preparers for their 2020 taxes: 95.3%
Here:
95%
State:
94%
(% for various income ranges: 94.8% for AGIs below $25k, 95.6% for AGIs $25k-50k, 95.2% for AGIs $50k-75k, 96.1% for AGIs $75k-100k, 96.6% for AGIs $100k-200k, 88.9% for AGIs over 200k)
Averages for the 2012 tax year for zip code 41035, filed in 2013:
Average Adjusted Gross Income (AGI) in 2012: $43,499 (Individual Income Tax Returns)
Here:
$43,499
State:
$50,814
Salary/wage: $38,649 (reported on 88.7% of returns)
Here:
$38,649
State:
$42,723
(% of AGI for various income ranges: 79.5% for AGIs below $25k, 83.7% for AGIs $25k-50k, 82.3% for AGIs $50k-75k, 83.4% for AGIs $75k-100k, 78.0% for AGIs $100k-200k, 47.0% for AGIs over 200k)
Taxable interest for individuals: $685 (reported on 25.1% of returns)
This zip code:
$685
Kentucky:
$1,381
(% of AGI for various income ranges: 0.7% for AGIs below $25k, 0.6% for AGIs $25k-50k, 0.2% for AGIs $50k-75k, 0.4% for AGIs $75k-100k, 0.3% for AGIs $100k-200k, 0.2% for AGIs over 200k)
Ordinary dividends: $2,567 (reported on 10.2% of returns)
Here:
$2,567
State:
$6,239
(% of AGI for various income ranges: 0.7% for AGIs below $25k, 0.2% for AGIs $25k-50k, 0.2% for AGIs $50k-75k, 0.4% for AGIs $75k-100k, 1.6% for AGIs $100k-200k, 0.4% for AGIs over 200k)
Net capital gain/loss in AGI: +$5,288 (reported on 8.9% of returns)
Here:
+$5,288
State:
+$11,336
(% of AGI for various income ranges: 0.4% for AGIs $25k-50k, 0.2% for AGIs $50k-75k, 0.6% for AGIs $75k-100k, 1.6% for AGIs $100k-200k, 6.7% for AGIs over 200k)
Profit/loss from business: +$7,802 (reported on 12.6% of returns)
Here:
+$7,802
State:
+$10,862
(% of AGI for various income ranges: 7.3% for AGIs below $25k, 2.2% for AGIs $25k-50k, 1.5% for AGIs $50k-75k, 1.3% for AGIs $75k-100k, 1.9% for AGIs $100k-200k)
Taxable individual retirement arrangement distribution: $14,823 (reported on 6.9% of returns)
41035:
$14,823
Kentucky:
$14,296
(% of AGI for various income ranges: 1.7% for AGIs below $25k, 1.7% for AGIs $25k-50k, 2.3% for AGIs $50k-75k, 2.9% for AGIs $75k-100k, 3.9% for AGIs $100k-200k)
Total itemized deductions: $18,533 (22% of AGI, reported on 26.2% of returns)
Here:
$18,533
State:
$21,160
Here:
21.9% of AGI
State:
20.0% of AGI
(% of AGI for various income ranges: 6.2% for AGIs below $25k, 8.0% for AGIs $25k-50k, 11.3% for AGIs $50k-75k, 13.2% for AGIs $75k-100k, 14.9% for AGIs $100k-200k, 13.1% for AGIs over 200k)
Charity contributions: $3,308 (reported on 19.1% of returns)
Here:
$3,308
State:
$4,303
(% of AGI for various income ranges: 0.6% for AGIs below $25k, 0.8% for AGIs $25k-50k, 1.2% for AGIs $50k-75k, 1.7% for AGIs $75k-100k, 2.5% for AGIs $100k-200k, 2.0% for AGIs over 200k)
Taxes paid: $6,669 (reported on 26.2% of returns)
41035:
$6,669
State:
$8,496
(% of AGI for various income ranges: 0.9% for AGIs below $25k, 2.0% for AGIs $25k-50k, 3.8% for AGIs $50k-75k, 5.0% for AGIs $75k-100k, 6.3% for AGIs $100k-200k, 6.7% for AGIs over 200k)
Earned income credit: $2,310 (reported on 25.7% of returns)
Here:
$2,310
State:
$2,273
(% of AGI for various income ranges: 8.4% for AGIs below $25k, 1.6% for AGIs $25k-50k)
Percentage of individuals using paid preparers for their 2012 taxes: 64.1%
Here:
64%
State:
60%
(% for various income ranges: 61.5% for AGIs below $25k, 63.0% for AGIs $25k-50k, 68.2% for AGIs $50k-75k, 69.2% for AGIs $75k-100k, 64.5% for AGIs $100k-200k, 100.0% for AGIs over 200k)
Averages for the 2004 tax year for zip code 41035, filed in 2005:
Average Adjusted Gross Income (AGI) in 2004: $37,143 (Individual Income Tax Returns)
Here:
$37,143
State:
$41,540
Salary/wage: $35,008 (reported on 90.3% of returns)
Here:
$35,008
State:
$36,432
(% of AGI for various income ranges: 125.9% for AGIs below $10k, 84.0% for AGIs $10k-25k, 86.9% for AGIs $25k-50k, 90.4% for AGIs $50k-75k, 87.3% for AGIs $75k-100k, 68.8% for AGIs over 100k)
Taxable interest for individuals: $939 (reported on 32.9% of returns)
This zip code:
$939
Kentucky:
$1,571
(% of AGI for various income ranges: 4.7% for AGIs below $10k, 1.3% for AGIs $10k-25k, 0.6% for AGIs $25k-50k, 0.6% for AGIs $50k-75k, 0.3% for AGIs $75k-100k, 1.1% for AGIs over 100k)
Taxable dividends: $1,279 (reported on 13.2% of returns)
Here:
$1,279
State:
$3,453
(% of AGI for various income ranges: 1.4% for AGIs below $10k, 0.5% for AGIs $10k-25k, 0.3% for AGIs $25k-50k, 0.3% for AGIs $50k-75k, 0.2% for AGIs $75k-100k, 1.0% for AGIs over 100k)
Net capital gain/loss: +$10,407 (reported on 9.8% of returns)
Here:
+$10,407
State:
+$9,663
(% of AGI for various income ranges: 0.5% for AGIs below $10k, 0.6% for AGIs $10k-25k, 0.6% for AGIs $25k-50k, 0.3% for AGIs $50k-75k, 1.5% for AGIs $75k-100k, 12.3% for AGIs over 100k)
Profit/loss from business: +$6,855 (reported on 13.4% of returns)
Here:
+$6,855
State:
+$9,233
(% of AGI for various income ranges: 6.7% for AGIs below $10k, 5.5% for AGIs $10k-25k, 2.2% for AGIs $25k-50k, 1.0% for AGIs $50k-75k, 0.5% for AGIs $75k-100k, 4.4% for AGIs over 100k)
IRA payment deduction: $2,459 (reported on 1.9% of returns)
41035:
$2,459
Kentucky:
$2,955
(% of AGI for various income ranges: 0.1% for AGIs $10k-25k, 0.2% for AGIs $25k-50k, 0.2% for AGIs $50k-75k, 0.1% for AGIs over 100k)
Total itemized deductions: $15,217 (23% of AGI, reported on 31.8% of returns)
Here:
$15,217
State:
$17,474
Here:
23.2% of AGI
State:
21.0% of AGI
(% of AGI for various income ranges: 13.9% for AGIs below $10k, 6.4% for AGIs $10k-25k, 11.3% for AGIs $25k-50k, 14.8% for AGIs $50k-75k, 16.9% for AGIs $75k-100k, 14.0% for AGIs over 100k)
Charity contributions deductions: $2,426 (4% of AGI, reported on 25.4% of returns)
Here:
$2,426
State:
$3,494
Here:
3.5% of AGI
State:
4.0% of AGI
(% of AGI for various income ranges: 0.9% for AGIs below $10k, 0.7% for AGIs $10k-25k, 1.2% for AGIs $25k-50k, 1.7% for AGIs $50k-75k, 2.2% for AGIs $75k-100k, 2.5% for AGIs over 100k)
Total tax: $4,394 (reported on 72.3% of returns)
41035:
$4,394
State:
$6,162
(% of AGI for various income ranges: 3.0% for AGIs below $10k, 4.1% for AGIs $10k-25k, 6.1% for AGIs $25k-50k, 7.7% for AGIs $50k-75k, 9.6% for AGIs $75k-100k, 16.0% for AGIs over 100k)
Earned income credit: $1,787 (reported on 20.6% of returns)
Here:
$1,787
State:
$1,723
Percentage of individuals using paid preparers for their 2004 taxes: 68.2%
Here:
68%
State:
66%
(% for various income ranges: 63.3% for AGIs below $10k, 69.8% for AGIs $10k-25k, 69.0% for AGIs $25k-50k, 69.5% for AGIs $50k-75k, 69.3% for AGIs $75k-100k, 69.4% for AGIs over 100k)
Likely homosexual households (counted as self-reported same-sex unmarried-partner households)
Lesbian couples: 0.1% of all households
Gay men: 0.0% of all households
Household received Food Stamps/SNAP in the past 12 months: 763 Household did not receive Food Stamps/SNAP in the past 12 months: 3,758
Women who had a birth in the past 12 months: 153 (84 now married, 70 unmarried) Women who did not have a birth in the past 12 months: 2,618 (1,276 now married, 1,344 unmarried)
Housing units in zip code 41035 with a mortgage: 1,609 (176 second mortgage, 120 both second mortgage and home equity loan) Houses without a mortgage: 78
Median monthly owner costs for units with a mortgage: $1,362 Median monthly owner costs for units without a mortgage: $462
Residents with income below the poverty level in 2022:
This zip code:
13.8%
Whole state:
16.5%
Residents with income below 50% of the poverty level in 2022:
This zip code:
8.5%
Whole state:
9.0%
Median number of rooms in houses and condos:
Here:
6.2
State:
6.4
Median number of rooms in apartments:
Here:
5.5
State:
4.4
Notable locations in this zip code not listed on our city pages
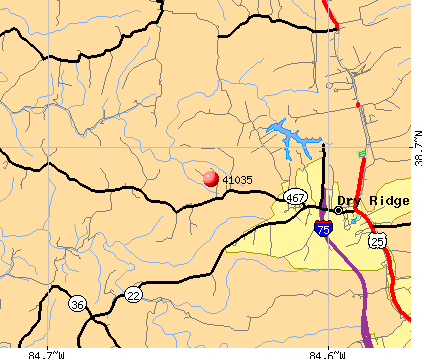
Notable locations in zip code 41035: Eagle Mill Ford (A), Dry Ridge Fire Department Station 2 (B), Dry Ridge Fire Department (C), Jonesville Volunteer Fire Department (D). Display/hide their locations on the map
Churches in zip code 41035 include: Wesley Church (A), Pleasant View Church (B), Sherman Church (C), Clarks Creek Church (D), Concord Church (E), Vine Run Baptist Church (F). Display/hide their locations on the map
Cemeteries: Tomlin Cemetery (1), Broad Ridge Cemetery (2), Pettit Cemetery (3), Webster Cemetery (4), Pennick-Price Cemetery (5), Clark Cemetery (6), Connley Cemetery (7). Display/hide their locations on the map
Streams, rivers, and creeks: Arnolds Creek (A), Townsend Branch (B), Clarks Creek (C), Sycamore Creek (D), Sulphur Lick Branch (E), Straight Fork Creek (F), Stevens Creek (G), Statlers Run (H), Little Ten Mile Creek (I). Display/hide their locations on the map
Size of family households: 1,447 2-persons, 781 3-persons, 507 4-persons, 235 5-persons, 93 6-persons, 67 7-or-more-persons
Size of nonfamily households: 1,235 1-person, 143 2-persons, 4 5-persons
1,743 married couples with children.
872 single-parent households (302 men, 570 women).
97.5% of residents of 41035 zip code speak English at home.
1.5% of residents speak Spanish at home (100% very well).
0.3% of residents speak other Indo-European language at home (100% very well).
0.3% of residents speak Asian or Pacific Island language at home (28% very well, 72% well).
Foreign born population: 94 (0.8%) (79.9% of them are naturalized citizens)
This zip code:
0.8%
Whole state:
4.0%
36%El Salvador
30%Honduras
12%Sweden
12%England
12%Germany
9%Singapore
25%American
21%German
12%English
11%Irish
2%Swiss
2%European
1%French
Year of entry for the foreign-born population
92010 or later
242000 to 2009
1311990 to 1999
85Before 1990
Facilities with environmental interests located in this zip code:
LONG RESIDENCE (TAFT HWY in DRY RIDGE, KY)
National Pollutant Discharge Elimination System NON-MAJOR (Tracking pollutant discharge elimination systems) - permit National Pollutant Discharge Elimination System NON-MAJOR (Tracking pollutant discharge elimination systems) - permit Business SIC classification: OPERATORS OF DWELLINGS OTHER THAN APARTMENT BUILDINGS Alternative names: STEWART RESIDENCE
FOLSOM'S STORE (6020 FOLSOM JONESVILLE ROAD HWY 467 in DRY RIDGE, KY)
BLACKWELL ESTATES MHP (3220 HYDE RD in DRY RIDGE, KY)
National Pollutant Discharge Elimination System NON-MAJOR (Tracking pollutant discharge elimination systems) - permit Business SIC classification: OPERATORS OF RESIDENTIAL MOBILE HOME SITES
BRENTWOOD PHASE IV (BRENTWOOD DR in DRY RIDGE, KY)
National Pollutant Discharge Elimination System NON-MAJOR (Tracking pollutant discharge elimination systems) - permit Business SIC classification: MANAGEMENT SERVICES
COACH STOP, THE (2825 DIXIE HIGHWAY in DRY RIDGE, KY)
(Resource Conservation and Recovery Act (tracking hazardous waste)) Organizations: LEE SPIERING (CONTACT/OWNER)
COUNTRYSIDE ESTATES MHP (TAYLOR LANE in DRY RIDGE, KY)
National Pollutant Discharge Elimination System NON-MAJOR (Tracking pollutant discharge elimination systems) - permit Business SIC classification: OPERATORS OF RESIDENTIAL MOBILE HOME SITES
KNOXVILLE GARDNERSVILLE ROAD DRUM (GARDNERSVILLE ROAD in DRY RIDGE, KY)
(Resource Conservation and Recovery Act (tracking hazardous waste)) Organizations: ELLA & MARCIE NAPIER (CONTACT/OWNER)
LANE RESIDENCE (685 KENNEY RD in DRY RIDGE, KY)
National Pollutant Discharge Elimination System NON-MAJOR (Tracking pollutant discharge elimination systems) - permit Business SIC classification: OPERATORS OF DWELLINGS OTHER THAN APARTMENT BUILDINGS Alternative names: SULLIVAN RESIDENCE
MIDTOWN SQUARE DRY CLEANERS (118 SOUTH MAIN STREET in DRY RIDGE, KY)
Conditionally Exempt Small Quantity Generators, less than 100 kg/month of hazardous waste (Resource Conservation and Recovery Act (tracking hazardous waste)) - notification Organizations: REBECCA CORIESSMANN (CONTACT/OWNER)
OHIO TRUCK BODY MFG., INC. (U.S. HIGHWAY 25 in SHERMAN, KY)
Conditionally Exempt Small Quantity Generators, less than 100 kg/month of hazardous waste (Resource Conservation and Recovery Act (tracking hazardous waste)) - notification Business NAICS classification: MOTOR VEHICLE BODY MANUFACTURING. Organizations: K. M. REVELSON (CONTACT/OWNER)
BRICKER ELEMENTARY SCHOOL (RT. 2 in DRY RIDGE, KY)
COMPLIANCE ACTIVITY (Tracking inspections of insecticide, fungicide, and rodenticide, and toxic substances)
Housing units lacking complete plumbing facilities: 1.0% Housing units lacking complete kitchen facilities: 0.3%
57.4%Electricity
19.6%Bottled, tank, or LP gas
12.2%Utility gas
5.3%Wood
4.8%Fuel oil, kerosene, etc.
0.6%Other fuel
Population in 1990: 6,092. Population change in the 1990s: +3,343 (+54.9%).
Place of birth for U.S.-born residents:
This state: 7,909
Northeast: 217
Midwest: 2,005
South: 794
West: 354
53% of the 41035 zip code residents lived in the same house 5 years ago. Out of people who lived in different houses, 43% lived in this county. Out of people who lived in different counties, 50% lived in Kentucky.
97% of the 41035 zip code residents lived in the same house 1 year ago. Out of people who lived in different houses, 22% moved from this county. Out of people who lived in different houses, 76% moved from different county within same state. Out of people who lived in different houses, 8% moved from different state.
Private vs. public school enrollment:
Students in private schools in grades 1 to 8 (elementary and middle school): 178
Here:
15.3%
Kentucky:
17.2%
Students in private schools in grades 9 to 12 (high school): 111
Here:
10.8%
Kentucky:
15.2%
Students in private undergraduate colleges: 119
Here:
32.4%
Kentucky:
19.6%
Occupation by median earnings in the past 12 months ($)
117,896Architecture and engineering occupations
81,791Arts, design, entertainment, sports, and media occupations
64,115Management occupations
57,781Transportation occupations
57,026Life, physical, and social science occupations
55,820Business and financial operations occupations
Top industries in this zip code by the number of employees in 2005:
Wholesale Trade: Fresh Fruit and Vegetable Merchant Wholesalers (100-249: 1)
Health Care and Social Assistance: Child Day Care Services (20-49: 2, 10-19: 1, 5-9: 1)
Construction: Framing Contractors (50-99: 1)
Administrative and Support and Waste Management and Remediation Services: Temporary Help Services (50-99: 1)
People in group quarters in 2010:
54 people in nursing facilities/skilled-nursing facilities
20 people in other noninstitutional facilities
People in group quarters in 2000:
83 people in nursing homes
Fatal accident statistics in 2013:
Fatal accident count: 1
Vehicles involved in fatal accidents: 1
Fatal accidents caused by drunken drivers: 0
Fatalities: 1
Persons involved in fatal accidents: 2
Pedestrians involved in fatal accidents: 0
Fatal accident statistics in 2012:
Fatal accident count: 1
Vehicles involved in fatal accidents: 2
Fatal accidents caused by drunken drivers: 0
Fatalities: 1
Persons involved in fatal accidents: 2
Pedestrians involved in fatal accidents: 0
2002 - 2018 National Fire Incident Reporting System (NFIRS) incidents
Based on the data from the years 2002 - 2018 the average number of fires per year is 46. The highest number of fires - 117 took place in 2010, and the least - 3 in 2004. The data has a decreasing trend.
When looking into fire subcategories, the most reports belonged to: Structure Fires (44.2%), and Outside Fires (37.0%).
Fire incident types reported to NFIRS in Zip Code 41035


 Nearest zip codes: 41030, 41092, 41095, 41052, 41097, 41046.


 Based on the data from the years 2002 - 2018 the average number of fires per year is 46. The highest number of fires - 117 took place in 2010, and the least - 3 in 2004. The data has a decreasing trend.
 When looking into fire subcategories, the most reports belonged to: Structure Fires (44.2%), and Outside Fires (37.0%).