Estimated zip code population in 2022: 1,793 Zip code population in 2010: 1,414 Zip code population in 2000: 1,242
Houses and condos: 620 Renter-occupied apartments: 116
% of renters here:
22%
State:
31%
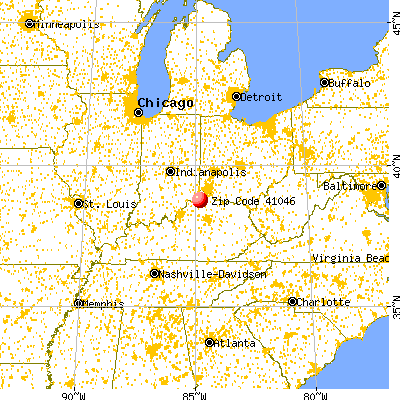
March 2022 cost of living index in zip code 41046: 81.7 (low, U.S. average is 100)
Land area: 16.9 sq. mi. Water area: 0.2 sq. mi.
Population density: 106 people per square mile
(very low).
OSM Map
General Map
Google Map
MSN Map
OSM Map
General Map
Google Map
MSN Map
OSM Map
General Map
Google Map
MSN Map
OSM Map
General Map
Google Map
MSN Map
Please wait while loading the map...
Real estate property taxes paid for housing units in 2022:
This zip code:
0.7% ($1,225)
Kentucky:
0.7% ($1,456)
Median real estate property taxes paid for housing units with mortgages in 2022: $1,533 (1.4%) Median real estate property taxes paid for housing units with no mortgage in 2022: $728 (0.5%)
Business Search- 14 Million verified businesses
Males: 792
(44.2%)
Females: 1,001
(55.8%)
For population 25 years and over in 41046:
High school or higher: 81.4%
Bachelor's degree or higher: 8.0%
Graduate or professional degree: 0.1%
Unemployed: 3.1%
Mean travel time to work (commute): 28.7 minutes
For population 15 years and over in 41046:
Never married: 21.9%
Now married: 70.7%
Separated: 1.8%
Widowed: 2.4%
Divorced: 3.2%
Zip code 41046 compared to state average:
Black race population percentage significantly below state average.
Hispanic race population percentage below state average.
Median age below state average.
Foreign-born population percentage significantly below state average.
Length of stay since moving in significantly above state average.
House age below state average.
Number of college students below state average.
Percentage of population with a bachelor's degree or higher significantly below state average.
Estimated median house/condo value in 2022: $180,219
41046:
$180,219
Kentucky:
$196,300
According to our research of Kentucky and other state lists, there were 2 registered sex offenders living in 41046 zip code as of May 28, 2024. The ratio of all residents to sex offenders in zip code 41046 is 619 to 1. The ratio of registered sex offenders to all residents in this zip code is lower than the state average.
Median resident age:
This zip code:
33.5 years
Kentucky median age:
39.4 years
Average household size:
This zip code:
3.4 people
Kentucky:
2.4 people
Averages for the 2020 tax year for zip code 41046, filed in 2021:
Average Adjusted Gross Income (AGI) in 2020: $49,978 (Individual Income Tax Returns)
Here:
$49,978
State:
$61,342
Salary/wage: $43,731 (reported on 88.8% of returns)
Here:
$43,731
State:
$50,827
(% of AGI for various income ranges: 1114.3% for AGIs below $25k, 3771.8% for AGIs $25k-50k, 6896.0% for AGIs $50k-75k, 10230.0% for AGIs $75k-100k, 15066.7% for AGIs $100k-200k)
Taxable interest for individuals: $740 (reported on 12.5% of returns)
This zip code:
$740
Kentucky:
$1,441
(% of AGI for various income ranges: 4.3% for AGIs below $25k, 17.6% for AGIs $25k-50k, 6.0% for AGIs $50k-75k, 46.7% for AGIs $100k-200k)
Ordinary dividends: $375 (reported on 5.0% of returns)
Here:
$375
State:
$7,388
(% of AGI for various income ranges: 25.0% for AGIs $75k-100k)
Net capital gain/loss in AGI: +$5,650 (reported on 5.0% of returns)
Here:
+$5,650
State:
+$19,475
(% of AGI for various income ranges: 376.7% for AGIs $75k-100k)
Profit/loss from business: +$3,460 (reported on 12.5% of returns)
Here:
+$3,460
State:
+$11,386
(% of AGI for various income ranges: 105.7% for AGIs below $25k, 73.5% for AGIs $25k-50k)
Taxable individual retirement arrangement distribution: $7,133 (reported on 3.8% of returns)
41046:
$7,133
Kentucky:
$18,941
(% of AGI for various income ranges: 125.9% for AGIs $25k-50k)
Earned income credit: $1,955 (reported on 25.0% of returns)
Here:
$1,955
State:
$2,336
(% of AGI for various income ranges: 106.1% for AGIs below $25k, 86.5% for AGIs $25k-50k)
Percentage of individuals using paid preparers for their 2020 taxes: 96.2%
Here:
96%
State:
94%
(% for various income ranges: 96.4% for AGIs below $25k, 90.9% for AGIs $25k-50k, 100.0% for AGIs $50k-75k, 100.0% for AGIs $75k-100k, 100.0% for AGIs $100k-200k)
Averages for the 2012 tax year for zip code 41046, filed in 2013:
Average Adjusted Gross Income (AGI) in 2012: $37,848 (Individual Income Tax Returns)
Here:
$37,848
State:
$50,814
Salary/wage: $32,863 (reported on 91.3% of returns)
Here:
$32,863
State:
$42,723
(% of AGI for various income ranges: 83.3% for AGIs below $25k, 80.1% for AGIs $25k-50k, 85.3% for AGIs $50k-75k, 85.2% for AGIs $75k-100k, 64.2% for AGIs $100k-200k)
Taxable interest for individuals: $600 (reported on 17.4% of returns)
This zip code:
$600
Kentucky:
$1,381
(% of AGI for various income ranges: 0.3% for AGIs below $25k, 0.4% for AGIs $25k-50k, 0.4% for AGIs $50k-75k)
Ordinary dividends: $267 (reported on 4.3% of returns)
Here:
$267
State:
$6,239
Net capital gain/loss in AGI: +$1,800 (reported on 5.8% of returns)
Here:
+$1,800
State:
+$11,336
Profit/loss from business: +$6,722 (reported on 13.0% of returns)
Here:
+$6,722
State:
+$10,862
(% of AGI for various income ranges: 7.9% for AGIs below $25k, 3.7% for AGIs $25k-50k, 0.4% for AGIs $50k-75k)
Total itemized deductions: $17,287 (23% of AGI, reported on 21.7% of returns)
Here:
$17,287
State:
$21,160
Here:
22.9% of AGI
State:
20.0% of AGI
(% of AGI for various income ranges: 11.5% for AGIs $25k-50k, 11.3% for AGIs $50k-75k, 15.4% for AGIs $75k-100k, 10.6% for AGIs $100k-200k)
Charity contributions: $2,518 (reported on 15.9% of returns)
Here:
$2,518
State:
$4,303
(% of AGI for various income ranges: 0.8% for AGIs $25k-50k, 2.5% for AGIs $50k-75k, 1.2% for AGIs $100k-200k)
Taxes paid: $5,940 (reported on 21.7% of returns)
41046:
$5,940
State:
$8,496
(% of AGI for various income ranges: 2.8% for AGIs $25k-50k, 3.4% for AGIs $50k-75k, 5.5% for AGIs $75k-100k, 5.4% for AGIs $100k-200k)
Earned income credit: $2,300 (reported on 31.9% of returns)
Here:
$2,300
State:
$2,273
(% of AGI for various income ranges: 9.0% for AGIs below $25k, 1.9% for AGIs $25k-50k)
Percentage of individuals using paid preparers for their 2012 taxes: 65.2%
Here:
65%
State:
60%
(% for various income ranges: 60.6% for AGIs below $25k, 66.7% for AGIs $25k-50k, 70.0% for AGIs $50k-75k, 75.0% for AGIs $75k-100k, 75.0% for AGIs $100k-200k)
Averages for the 2004 tax year for zip code 41046, filed in 2005:
Average Adjusted Gross Income (AGI) in 2004: $33,479 (Individual Income Tax Returns)
Here:
$33,479
State:
$41,540
Salary/wage: $32,824 (reported on 89.0% of returns)
Here:
$32,824
State:
$36,432
(% of AGI for various income ranges: 127.1% for AGIs below $10k, 84.3% for AGIs $10k-25k, 89.7% for AGIs $25k-50k, 89.9% for AGIs $50k-75k, 92.1% for AGIs $75k-100k, 66.4% for AGIs over 100k)
Taxable interest for individuals: $643 (reported on 24.5% of returns)
This zip code:
$643
Kentucky:
$1,571
(% of AGI for various income ranges: 5.5% for AGIs below $10k, 1.2% for AGIs $10k-25k, 0.4% for AGIs $25k-50k, 0.2% for AGIs $50k-75k, 0.1% for AGIs $75k-100k, 0.3% for AGIs over 100k)
Taxable dividends: $49 (reported on 5.9% of returns)
Here:
$49
State:
$3,453
Net capital gain/loss: +$1,484 (reported on 4.4% of returns)
Here:
+$1,484
State:
+$9,663
Profit/loss from business: +$2,329 (reported on 11.8% of returns)
Here:
+$2,329
State:
+$9,233
(% of AGI for various income ranges: 22.1% for AGIs below $10k, 4.4% for AGIs $10k-25k, -0.8% for AGIs $25k-50k, 0.1% for AGIs $50k-75k)
Total itemized deductions: $14,583 (26% of AGI, reported on 28.6% of returns)
Here:
$14,583
State:
$17,474
Here:
25.9% of AGI
State:
21.0% of AGI
(% of AGI for various income ranges: 10.1% for AGIs $10k-25k, 9.8% for AGIs $25k-50k, 13.4% for AGIs $50k-75k, 14.3% for AGIs $75k-100k, 19.3% for AGIs over 100k)
Charity contributions deductions: $2,160 (4% of AGI, reported on 21.5% of returns)
Here:
$2,160
State:
$3,494
Here:
3.7% of AGI
State:
4.0% of AGI
(% of AGI for various income ranges: 0.8% for AGIs $10k-25k, 1.2% for AGIs $25k-50k, 1.7% for AGIs $50k-75k, 2.0% for AGIs $75k-100k, 1.5% for AGIs over 100k)
Total tax: $3,780 (reported on 68.4% of returns)
41046:
$3,780
State:
$6,162
(% of AGI for various income ranges: 4.2% for AGIs below $10k, 4.1% for AGIs $10k-25k, 6.0% for AGIs $25k-50k, 7.9% for AGIs $50k-75k, 9.8% for AGIs $75k-100k, 14.1% for AGIs over 100k)
Earned income credit: $1,686 (reported on 22.4% of returns)
Here:
$1,686
State:
$1,723
Percentage of individuals using paid preparers for their 2004 taxes: 69.7%
Here:
70%
State:
66%
(% for various income ranges: 61.7% for AGIs below $10k, 67.2% for AGIs $10k-25k, 77.3% for AGIs $25k-50k, 75.0% for AGIs $50k-75k, 63.9% for AGIs $75k-100k, 59.1% for AGIs over 100k)
Household received Food Stamps/SNAP in the past 12 months: 42 Household did not receive Food Stamps/SNAP in the past 12 months: 487
Women who had a birth in the past 12 months: 48 (19 now married, 30 unmarried) Women who did not have a birth in the past 12 months: 380 (245 now married, 136 unmarried)
Housing units in zip code 41046 with a mortgage: 243 (4 second mortgage, 4 both second mortgage and home equity loan) Median monthly owner costs for units with a mortgage: $1,265 Median monthly owner costs for units without a mortgage: $439
Residents with income below the poverty level in 2022:
This zip code:
9.4%
Whole state:
16.5%
Residents with income below 50% of the poverty level in 2022:
This zip code:
4.3%
Whole state:
9.0%
Median number of rooms in houses and condos:
Here:
6.7
State:
6.4
Median number of rooms in apartments:
Here:
6.2
State:
4.4
Notable locations in this zip code not listed on our city pages
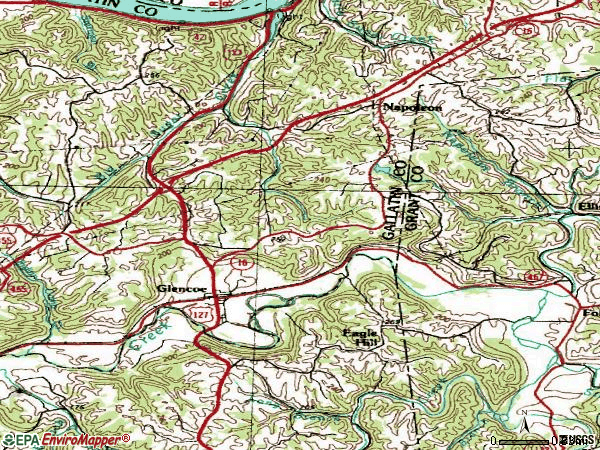
Streams, rivers, and creeks: Ten Mile Creek (A), Brush Creek (B), Lost Branch (C), Long Branch (D), Indian Camp Creek (E). Display/hide their locations on the map
Size of family households: 186 2-persons, 79 3-persons, 103 4-persons, 30 5-persons, 28 6-persons, 41 7-or-more-persons
Size of nonfamily households: 50 1-person, 4 2-persons
292 married couples with children.
63 single-parent households (3 men, 60 women).
98.0% of residents of 41046 zip code speak English at home.
1.7% of residents speak Spanish at home (54% very well, 29% well, 18% not well).
Foreign born population: 7 (0.4%) (100.0% of them are naturalized citizens)
This zip code:
0.4%
Whole state:
4.0%
86%Honduras
42%German
24%Irish
7%Swiss
7%American
6%Italian
4%English
2%European
Year of entry for the foreign-born population
02010 or later
52000 to 2009
01990 to 1999
0Before 1990
Facilities with environmental interests located in this zip code:
BERRY, OLIVERY PROPERTY (2010 HWY 16 in GLENCOE, KY)
National Pollutant Discharge Elimination System NON-MAJOR (Tracking pollutant discharge elimination systems) - permit Organizations: BERRY, OLIVER PROPERTY (CONTACT/OWNER)
Alternative names: BERRY, OLIVER PROPERTY
Housing units lacking complete plumbing facilities: 2.7% Housing units lacking complete kitchen facilities: 4.1%
73.0%Electricity
16.1%Bottled, tank, or LP gas
6.7%Utility gas
3.7%Wood
Population in 1990: 589. Population change in the 1990s: +653 (+110.9%).
Place of birth for U.S.-born residents:
This state: 1,202
Northeast: 23
Midwest: 440
South: 83
West: 35
57% of the 41046 zip code residents lived in the same house 5 years ago. Out of people who lived in different houses, 44% lived in this county. Out of people who lived in different counties, 50% lived in Kentucky.
79% of the 41046 zip code residents lived in the same house 1 year ago. Out of people who lived in different houses, 7% moved from this county. Out of people who lived in different houses, 91% moved from different county within same state. Out of people who lived in different houses, 2% moved from different state.
Private vs. public school enrollment:
Students in private schools in grades 1 to 8 (elementary and middle school): 47
Here:
29.5%
Kentucky:
17.2%
Students in private schools in grades 9 to 12 (high school):
Here:
0.0%
Kentucky:
15.2%
Students in private undergraduate colleges: 3
Here:
14.7%
Kentucky:
19.6%
Occupation by median earnings in the past 12 months ($)
89,540Management occupations
71,769Construction and extraction occupations
70,334Production occupations
61,989Installation, maintenance, and repair occupations
36,469Building and grounds cleaning and maintenance occupations
35,342Sales and related occupations
Top industries in this zip code by the number of employees in 2005:
Accommodation and Food Services: Full-Service Restaurants (20-49 employees: 1 establishment)
Professional, Scientific, and Technical Services: Offices of Certified Public Accountants (5-9: 1)
Other Services (except Public Administration): General Automotive Repair (5-9: 1)
Administrative and Support and Waste Management and Remediation Services: Solid Waste Collection (5-9: 1)
Construction: Electrical Contractors (1-4: 1)
Construction: All Other Specialty Trade Contractors (1-4: 1)
Other Services (except Public Administration): Religious Organizations (1-4: 1)
Fatal accident statistics in 2012:
Fatal accident count: 2
Vehicles involved in fatal accidents: 3
Fatal accidents caused by drunken drivers: 1
Fatalities: 2
Persons involved in fatal accidents: 5
Pedestrians involved in fatal accidents: 0
Fatal accident statistics in 2011:
Fatal accident count: 1
Vehicles involved in fatal accidents: 1
Fatal accidents caused by drunken drivers: 1
Fatalities: 1
Persons involved in fatal accidents: 1
Pedestrians involved in fatal accidents: 0
2002 - 2018 National Fire Incident Reporting System (NFIRS) incidents
Based on the data from the years 2002 - 2018 the average number of fire incidents per year is 13. The highest number of reported fires - 24 took place in 2009, and the least - 0 in 2005. The data has a decreasing trend.
When looking into fire subcategories, the most incidents belonged to: Structure Fires (36.8%), and Mobile Property/Vehicle Fires (31.1%).
Fire incident types reported to NFIRS in Zip Code 41046


 Nearest zip codes: 41052, 41086, 41095, 47038, 41035, 41092.


 Based on the data from the years 2002 - 2018 the average number of fire incidents per year is 13. The highest number of reported fires - 24 took place in 2009, and the least - 0 in 2005. The data has a decreasing trend.
 When looking into fire subcategories, the most incidents belonged to: Structure Fires (36.8%), and Mobile Property/Vehicle Fires (31.1%).