Estimated zip code population in 2022: 4,984 Zip code population in 2010: 4,704 Zip code population in 2000: 4,336
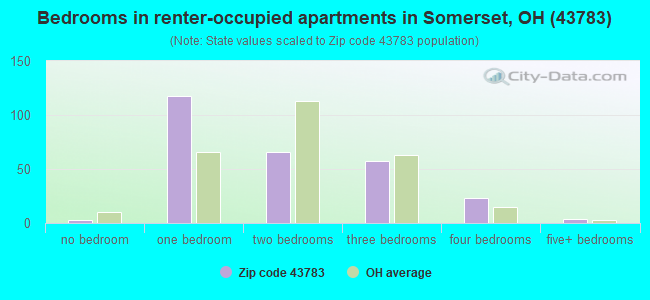
Houses and condos: 2,038 Renter-occupied apartments: 268
% of renters here:
14%
State:
33%
March 2022 cost of living index in zip code 43783: 83.1 (low, U.S. average is 100)
Land area: 60.2 sq. mi. Water area: 0.4 sq. mi.
Population density: 83 people per square mile
(very low).
OSM Map
General Map
Google Map
MSN Map
OSM Map
General Map
Google Map
MSN Map
OSM Map
General Map
Google Map
MSN Map
OSM Map
General Map
Google Map
MSN Map
Please wait while loading the map...
Real estate property taxes paid for housing units in 2022:
This zip code:
1.0% ($2,194)
Ohio:
1.3% ($2,639)
Median real estate property taxes paid for housing units with mortgages in 2022: $2,350 (1.0%) Median real estate property taxes paid for housing units with no mortgage in 2022: $1,892 (1.1%)
Business Search- 14 Million verified businesses
Males: 2,412
(48.4%)
Females: 2,571
(51.6%)
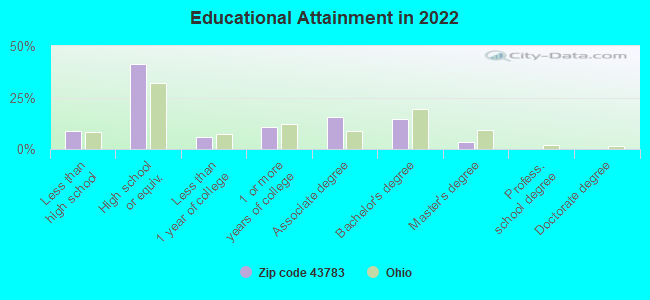
For population 25 years and over in 43783:
High school or higher: 89.6%
Bachelor's degree or higher: 17.6%
Graduate or professional degree: 3.5%
Unemployed: 2.9%
Mean travel time to work (commute): 35.9 minutes
For population 15 years and over in 43783:
Never married: 22.4%
Now married: 60.4%
Separated: 2.1%
Widowed: 7.5%
Divorced: 7.6%
Zip code 43783 compared to state average:
Black race population percentage significantly below state average.
Hispanic race population percentage significantly below state average.
Foreign-born population percentage significantly below state average.
Renting percentage significantly below state average.
Length of stay since moving in significantly above state average.
Number of college students below state average.
Percentage of population with a bachelor's degree or higher below state average.
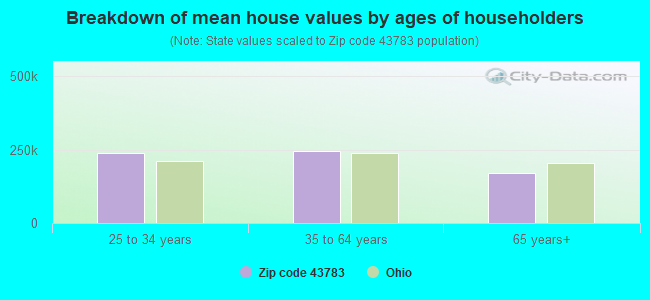
Estimated median house/condo value in 2022: $209,890
43783:
$209,890
Ohio:
$204,100
According to our research of Ohio and other state lists, there were 9 registered sex offenders living in 43783 zip code as of May 28, 2024. The ratio of all residents to sex offenders in zip code 43783 is 529 to 1. The ratio of registered sex offenders to all residents in this zip code is near the state average.
Median resident age:
This zip code:
37.3 years
Ohio median age:
39.9 years
Average household size:
This zip code:
2.6 people
Ohio:
2.4 people
Averages for the 2020 tax year for zip code 43783, filed in 2021:
Average Adjusted Gross Income (AGI) in 2020: $56,573 (Individual Income Tax Returns)
Here:
$56,573
State:
$67,288
Salary/wage: $52,157 (reported on 81.5% of returns)
Here:
$52,157
State:
$55,628
(% of AGI for various income ranges: 1108.8% for AGIs below $25k, 3498.9% for AGIs $25k-50k, 6603.6% for AGIs $50k-75k, 9616.7% for AGIs $75k-100k, 14761.0% for AGIs $100k-200k)
Taxable interest for individuals: $636 (reported on 25.2% of returns)
This zip code:
$636
Ohio:
$1,518
(% of AGI for various income ranges: 11.2% for AGIs below $25k, 14.8% for AGIs $25k-50k, 9.6% for AGIs $50k-75k, 16.7% for AGIs $75k-100k, 71.4% for AGIs $100k-200k)
Ordinary dividends: $3,130 (reported on 13.5% of returns)
Here:
$3,130
State:
$7,167
(% of AGI for various income ranges: 25.7% for AGIs below $25k, 35.0% for AGIs $25k-50k, 49.3% for AGIs $50k-75k, 50.0% for AGIs $75k-100k, 205.2% for AGIs $100k-200k)
Net capital gain/loss in AGI: +$6,392 (reported on 11.3% of returns)
Here:
+$6,392
State:
+$18,919
(% of AGI for various income ranges: 16.1% for AGIs below $25k, 18.2% for AGIs $25k-50k, 30.7% for AGIs $50k-75k, 137.2% for AGIs $75k-100k, 526.7% for AGIs $100k-200k)
Profit/loss from business: +$11,226 (reported on 14.0% of returns)
Here:
+$11,226
State:
+$13,744
(% of AGI for various income ranges: 123.9% for AGIs below $25k, 129.5% for AGIs $25k-50k, 129.3% for AGIs $50k-75k, 153.9% for AGIs $75k-100k, 792.4% for AGIs $100k-200k)
Taxable individual retirement arrangement distribution: $13,378 (reported on 8.1% of returns)
43783:
$13,378
Ohio:
$18,876
(% of AGI for various income ranges: 49.6% for AGIs below $25k, 135.7% for AGIs $25k-50k, 104.3% for AGIs $50k-75k, 301.7% for AGIs $75k-100k, 349.0% for AGIs $100k-200k)
Total itemized deductions: $23,471 (reported on 3.2% of returns)
Here:
$23,471
State:
$33,869
(% of AGI for various income ranges: 330.4% for AGIs $50k-75k, 341.9% for AGIs $100k-200k)
Charity contributions: $6,060 (reported on 2.3% of returns)
Here:
$6,060
State:
$14,577
(% of AGI for various income ranges: 46.4% for AGIs $50k-75k, 82.4% for AGIs $100k-200k)
Taxes paid: $6,471 (reported on 3.2% of returns)
43783:
$6,471
State:
$7,681
(% of AGI for various income ranges: 77.5% for AGIs $50k-75k, 112.4% for AGIs $100k-200k)
Earned income credit: $2,379 (reported on 13.1% of returns)
Here:
$2,379
State:
$2,304
(% of AGI for various income ranges: 87.3% for AGIs below $25k, 59.5% for AGIs $25k-50k)
Percentage of individuals using paid preparers for their 2020 taxes: 92.8%
Here:
93%
State:
94%
(% for various income ranges: 91.2% for AGIs below $25k, 92.9% for AGIs $25k-50k, 92.1% for AGIs $50k-75k, 96.0% for AGIs $75k-100k, 93.5% for AGIs $100k-200k, 100.0% for AGIs over 200k)
Averages for the 2012 tax year for zip code 43783, filed in 2013:
Average Adjusted Gross Income (AGI) in 2012: $44,328 (Individual Income Tax Returns)
Here:
$44,328
State:
$54,926
Salary/wage: $41,294 (reported on 82.1% of returns)
Here:
$41,294
State:
$45,869
(% of AGI for various income ranges: 68.9% for AGIs below $25k, 78.5% for AGIs $25k-50k, 81.4% for AGIs $50k-75k, 83.0% for AGIs $75k-100k, 67.7% for AGIs $100k-200k)
Taxable interest for individuals: $775 (reported on 31.4% of returns)
This zip code:
$775
Ohio:
$1,297
(% of AGI for various income ranges: 1.8% for AGIs below $25k, 0.8% for AGIs $25k-50k, 0.4% for AGIs $50k-75k, 0.2% for AGIs $75k-100k, 0.2% for AGIs $100k-200k)
Ordinary dividends: $2,667 (reported on 14.5% of returns)
Here:
$2,667
State:
$5,821
(% of AGI for various income ranges: 0.9% for AGIs below $25k, 0.5% for AGIs $25k-50k, 0.7% for AGIs $50k-75k, 0.3% for AGIs $75k-100k, 1.8% for AGIs $100k-200k)
Net capital gain/loss in AGI: +$2,750 (reported on 9.7% of returns)
Here:
+$2,750
State:
+$11,232
(% of AGI for various income ranges: 0.9% for AGIs $25k-50k, 0.8% for AGIs $50k-75k, 0.7% for AGIs $75k-100k, 0.3% for AGIs $100k-200k)
Profit/loss from business: +$8,716 (reported on 15.5% of returns)
Here:
+$8,716
State:
+$12,773
(% of AGI for various income ranges: 6.6% for AGIs below $25k, 3.4% for AGIs $25k-50k, 1.6% for AGIs $50k-75k, 2.0% for AGIs $75k-100k, 3.5% for AGIs $100k-200k)
Taxable individual retirement arrangement distribution: $11,581 (reported on 7.7% of returns)
43783:
$11,581
Ohio:
$14,511
(% of AGI for various income ranges: 3.3% for AGIs below $25k, 1.6% for AGIs $25k-50k, 1.7% for AGIs $50k-75k, 4.9% for AGIs $75k-100k)
Total itemized deductions: $15,802 (21% of AGI, reported on 25.6% of returns)
Here:
$15,802
State:
$21,278
Here:
20.7% of AGI
State:
18.8% of AGI
(% of AGI for various income ranges: 5.9% for AGIs below $25k, 6.6% for AGIs $25k-50k, 8.9% for AGIs $50k-75k, 12.0% for AGIs $75k-100k, 10.7% for AGIs $100k-200k)
Charity contributions: $2,600 (reported on 16.9% of returns)
Here:
$2,600
State:
$3,943
(% of AGI for various income ranges: 0.6% for AGIs below $25k, 0.6% for AGIs $25k-50k, 1.0% for AGIs $50k-75k, 1.0% for AGIs $75k-100k, 1.4% for AGIs $100k-200k)
Taxes paid: $5,643 (reported on 25.6% of returns)
43783:
$5,643
State:
$9,568
(% of AGI for various income ranges: 1.4% for AGIs below $25k, 1.9% for AGIs $25k-50k, 2.6% for AGIs $50k-75k, 4.2% for AGIs $75k-100k, 5.2% for AGIs $100k-200k)
Earned income credit: $2,224 (reported on 16.4% of returns)
Here:
$2,224
State:
$2,285
(% of AGI for various income ranges: 6.1% for AGIs below $25k, 1.0% for AGIs $25k-50k)
Percentage of individuals using paid preparers for their 2012 taxes: 53.6%
Here:
54%
State:
51%
(% for various income ranges: 47.4% for AGIs below $25k, 55.2% for AGIs $25k-50k, 58.3% for AGIs $50k-75k, 61.9% for AGIs $75k-100k, 56.2% for AGIs $100k-200k)
Averages for the 2004 tax year for zip code 43783, filed in 2005:
Average Adjusted Gross Income (AGI) in 2004: $35,645 (Individual Income Tax Returns)
Here:
$35,645
State:
$44,480
Salary/wage: $33,812 (reported on 85.4% of returns)
Here:
$33,812
State:
$39,198
(% of AGI for various income ranges: 74.8% for AGIs below $10k, 71.4% for AGIs $10k-25k, 83.5% for AGIs $25k-50k, 84.1% for AGIs $50k-75k, 84.4% for AGIs $75k-100k, 72.1% for AGIs over 100k)
Taxable interest for individuals: $1,029 (reported on 40.6% of returns)
This zip code:
$1,029
Ohio:
$1,532
(% of AGI for various income ranges: 4.4% for AGIs below $10k, 2.6% for AGIs $10k-25k, 1.0% for AGIs $25k-50k, 0.9% for AGIs $50k-75k, 0.6% for AGIs $75k-100k, 1.0% for AGIs over 100k)
Taxable dividends: $1,489 (reported on 16.4% of returns)
Here:
$1,489
State:
$3,496
(% of AGI for various income ranges: 1.0% for AGIs below $10k, 1.1% for AGIs $10k-25k, 0.5% for AGIs $25k-50k, 0.3% for AGIs $50k-75k, 0.6% for AGIs $75k-100k, 1.5% for AGIs over 100k)
Net capital gain/loss: +$4,476 (reported on 13.5% of returns)
Here:
+$4,476
State:
+$8,582
(% of AGI for various income ranges: -0.6% for AGIs below $10k, 1.3% for AGIs $10k-25k, 0.9% for AGIs $25k-50k, 1.3% for AGIs $50k-75k, 2.5% for AGIs $75k-100k, 4.7% for AGIs over 100k)
Profit/loss from business: +$9,518 (reported on 17.5% of returns)
Here:
+$9,518
State:
+$10,813
(% of AGI for various income ranges: 14.6% for AGIs below $10k, 5.4% for AGIs $10k-25k, 3.8% for AGIs $25k-50k, 4.4% for AGIs $50k-75k, 2.0% for AGIs $75k-100k, 9.1% for AGIs over 100k)
IRA payment deduction: $2,367 (reported on 2.4% of returns)
43783:
$2,367
Ohio:
$2,794
Total itemized deductions: $13,907 (23% of AGI, reported on 27.2% of returns)
Here:
$13,907
State:
$17,503
Here:
23.0% of AGI
State:
20.8% of AGI
(% of AGI for various income ranges: 7.9% for AGIs below $10k, 5.1% for AGIs $10k-25k, 9.1% for AGIs $25k-50k, 11.6% for AGIs $50k-75k, 14.3% for AGIs $75k-100k, 13.6% for AGIs over 100k)
Charity contributions deductions: $1,995 (3% of AGI, reported on 20.9% of returns)
Here:
$1,995
State:
$3,087
Here:
3.1% of AGI
State:
3.4% of AGI
(% of AGI for various income ranges: 0.5% for AGIs $10k-25k, 1.0% for AGIs $25k-50k, 1.3% for AGIs $50k-75k, 1.4% for AGIs $75k-100k, 2.1% for AGIs over 100k)
Total tax: $3,859 (reported on 76.2% of returns)
43783:
$3,859
State:
$6,781
(% of AGI for various income ranges: 2.9% for AGIs below $10k, 4.5% for AGIs $10k-25k, 6.9% for AGIs $25k-50k, 8.0% for AGIs $50k-75k, 10.0% for AGIs $75k-100k, 15.5% for AGIs over 100k)
Earned income credit: $1,693 (reported on 14.3% of returns)
Here:
$1,693
State:
$1,696
Percentage of individuals using paid preparers for their 2004 taxes: 53.0%
Here:
53%
State:
55%
(% for various income ranges: 43.8% for AGIs below $10k, 53.0% for AGIs $10k-25k, 57.5% for AGIs $25k-50k, 51.8% for AGIs $50k-75k, 55.1% for AGIs $75k-100k, 70.2% for AGIs over 100k)
Household received Food Stamps/SNAP in the past 12 months: 316 Household did not receive Food Stamps/SNAP in the past 12 months: 1,558
Women who had a birth in the past 12 months: 36 (24 now married, 12 unmarried) Women who did not have a birth in the past 12 months: 1,052 (583 now married, 468 unmarried)
Housing units in zip code 43783 with a mortgage: 895 (69 second mortgage, 55 both second mortgage and home equity loan) Houses without a mortgage: 41
Median monthly owner costs for units with a mortgage: $1,279 Median monthly owner costs for units without a mortgage: $489
Residents with income below the poverty level in 2022:
This zip code:
13.1%
Whole state:
13.4%
Residents with income below 50% of the poverty level in 2022:
This zip code:
8.6%
Whole state:
7.0%
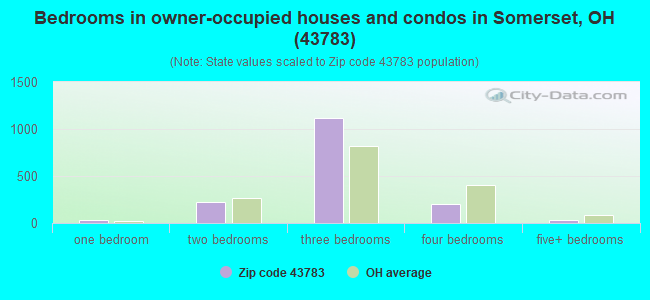
Median number of rooms in houses and condos:
Here:
6.1
State:
6.7
Median number of rooms in apartments:
Here:
4.2
State:
4.4
Notable locations in this zip code not listed on our city pages
Notable locations in zip code 43783: Perry Country Club (A), Somerset Emergency Medical Services (B), Perry Countys First Courthouse (C), Perry County Historical Society Museum (D), Somerset - Reading Township Fire Department (E). Display/hide their locations on the map
Churches in zip code 43783 include: Hopewell Baptist Church (A), Saint Josephs Priory (B), Saint Josephs Catholic Church (C), Wesley Chapel (D), Holy Trinity Catholic Church (E). Display/hide their locations on the map
Lakes and reservoirs: Lake Saint Joseph (A), Clouse Lake (B), Rush Creek Structure 3b Reservoir (C), Rush Creek Structure 3a Reservoir (D), Somerset Reservoir (E). Display/hide their locations on the map
Parks in zip code 43783 include: Clouse Lake Wildlife Area (1), General Phillip Sheridan Monument (2), Somerset Historic District (3). Display/hide their locations on the map
In group quarters: 71 (-1 institutionalized population)
Size of family households: 593 2-persons, 242 3-persons, 300 4-persons, 40 5-persons, 81 6-persons, 10 7-or-more-persons
Size of nonfamily households: 533 1-person, 35 2-persons, 27 4-persons
975 married couples with children.
143 single-parent households (117 men, 26 women).
99.0% of residents of 43783 zip code speak English at home.
0.8% of residents speak Spanish at home (31% very well, 69% not well).
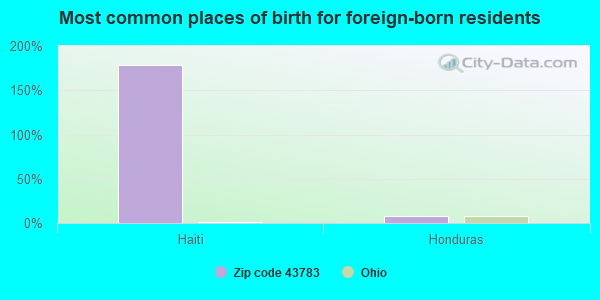
Foreign born population: 37 (0.7%) (100.0% of them are naturalized citizens)
This zip code:
0.7%
Whole state:
5.0%
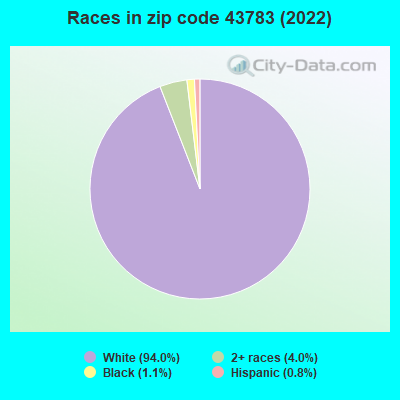
178%Haiti
8%Honduras
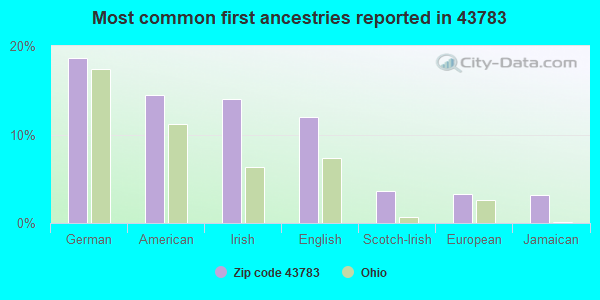
19%German
14%American
14%Irish
12%English
4%Scotch-Irish
3%European
3%Jamaican
Year of entry for the foreign-born population
02010 or later
02000 to 2009
01990 to 1999
45Before 1990
Housing units lacking complete plumbing facilities: 3.4% Housing units lacking complete kitchen facilities: 2.8%
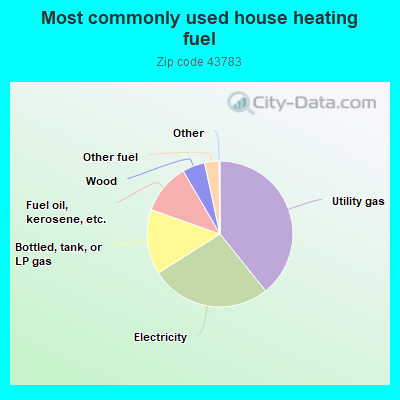
39.3%Utility gas
26.8%Electricity
14.4%Bottled, tank, or LP gas
11.2%Fuel oil, kerosene, etc.
5.0%Wood
3.2%Other fuel
Population in 1990: 2,541. Population change in the 1990s: +1,795 (+70.6%).
Place of birth for U.S.-born residents:
This state: 4,398
Northeast: 25
Midwest: 142
South: 321
West: 34
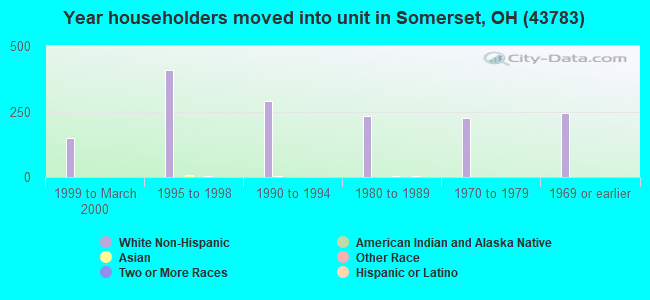
65% of the 43783 zip code residents lived in the same house 5 years ago. Out of people who lived in different houses, 56% lived in this county. Out of people who lived in different counties, 50% lived in Ohio.
88% of the 43783 zip code residents lived in the same house 1 year ago. Out of people who lived in different houses, 39% moved from this county. Out of people who lived in different houses, 49% moved from different county within same state. Out of people who lived in different houses, 8% moved from different state. Out of people who lived in different houses, 6% moved from abroad.
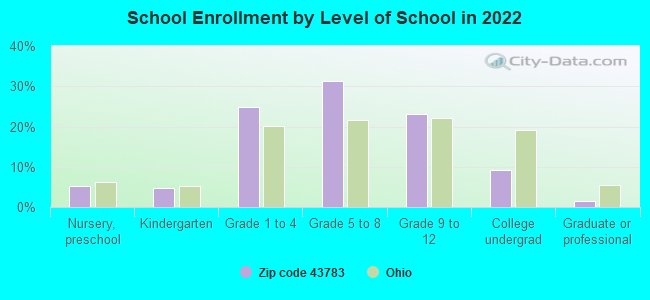
Private vs. public school enrollment:
Students in private schools in grades 1 to 8 (elementary and middle school): 154
Here:
31.2%
Ohio:
16.0%
Students in private schools in grades 9 to 12 (high school): 11
Here:
5.6%
Ohio:
13.1%
Students in private undergraduate colleges: 11
Here:
14.6%
Ohio:
22.3%
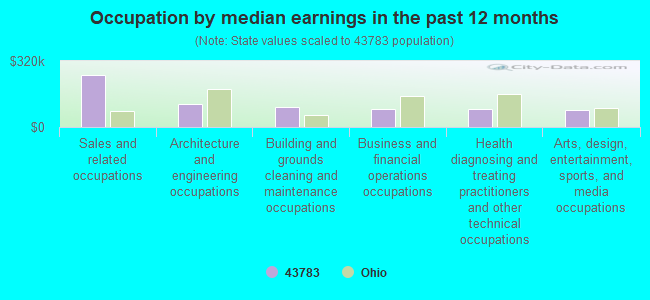
Occupation by median earnings in the past 12 months ($)
251,167Sales and related occupations
113,901Architecture and engineering occupations
97,446Building and grounds cleaning and maintenance occupations
89,608Business and financial operations occupations
86,159Health diagnosing and treating practitioners and other technical occupations
82,674Arts, design, entertainment, sports, and media occupations
Top industries in this zip code by the number of employees in 2005:
Finance and Insurance: Commercial Banking (20-49: 1, 5-9: 1)
Educational Services: Elementary and Secondary Schools (20-49: 1)
Accommodation and Food Services: Limited-Service Restaurants (10-19: 1, 5-9: 1)
Wholesale Trade: Metal Service Centers and Other Metal Merchant Wholesalers (10-19: 1, 1-4: 1)
Finance and Insurance: Insurance Agencies and Brokerages (10-19: 1, 1-4: 1)
Health Care and Social Assistance: Offices of Physicians (except Mental Health Specialists) (10-19: 1, 1-4: 1)
People in group quarters in 2010:
63 people in nursing facilities/skilled-nursing facilities
People in group quarters in 2000:
97 people in nursing homes
Fatal accident statistics in 2014:
Fatal accident count: 1
Vehicles involved in fatal accidents: 1
Fatal accidents caused by drunken drivers: 1
Fatalities: 1
Persons involved in fatal accidents: 1
Pedestrians involved in fatal accidents: 0
Fatal accident statistics in 2010:
Fatal accident count: 3
Vehicles involved in fatal accidents: 6
Fatal accidents caused by drunken drivers: 1
Fatalities: 4
Persons involved in fatal accidents: 9
Pedestrians involved in fatal accidents: 0
2002 - 2018 National Fire Incident Reporting System (NFIRS) incidents
According to the data from the years 2002 - 2018 the average number of fire incidents per year is 36. The highest number of reported fires - 66 took place in 2009, and the least - 22 in 2015. The data has a decreasing trend.
When looking into fire subcategories, the most reports belonged to: Structure Fires (51.7%), and Outside Fires (35.7%).
Fire incident types reported to NFIRS in Zip Code 43783

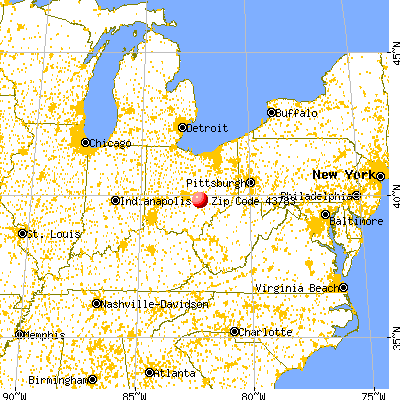


 Nearest zip codes: 43739, 43748, 43760, 43764, 43150, 43721.


 According to the data from the years 2002 - 2018 the average number of fire incidents per year is 36. The highest number of reported fires - 66 took place in 2009, and the least - 22 in 2015. The data has a decreasing trend.
 When looking into fire subcategories, the most reports belonged to: Structure Fires (51.7%), and Outside Fires (35.7%).