Estimated zip code population in 2022: 14
Zip code population in 2010: 64
Zip code population in 2000: 106
Houses and condos: 40
Renter-occupied apartments: 1
| % of renters here: | 11% |
| State: | 33% |
82.0
(low, U.S. average is 100)
Land area: 0.2
sq. mi.
Water area: 0.1
sq. mi.
| Population density: 56 people per square mile | | (very low). |
![Age and Sex of Residents in zip code 45112]()
- OSM Map
- General Map
- Google Map
- MSN Map
- OSM Map
- General Map
- Google Map
- MSN Map
- OSM Map
- General Map
- Google Map
- MSN Map
- OSM Map
- General Map
- Google Map
- MSN Map
Please wait while loading the map...
Real estate property taxes paid for housing units in 2022:
| This zip code: | 0.8% ($1,260) |
| Ohio: | 1.3% ($2,639) |
$1,390 (0.6%)
Business Search - 14 Million verified businesses
| Males: 6 |  (46.7%) (46.7%) |
| Females: 7 |  (53.3%) (53.3%) |
For population 25 years and over in 45112:
- High school or higher: 73.3%
- Bachelor's degree or higher: 27.6%
- Graduate or professional degree: 0.0%
- Mean travel time to work (commute): 508.4 minutes
For population 15 years and over in 45112:
- Never married: 0.0%
- Now married: 87.1%
- Separated: 0.0%
- Widowed: 6.5%
- Divorced: 6.4%
Zip code 45112 compared to state average:
- Unemployed percentage significantly below state average.
- Black race population percentage significantly below state average.
- Hispanic race population percentage significantly below state average.
- Median age significantly above state average.
- Foreign-born population percentage significantly above state average.
- Renting percentage significantly below state average.
- Length of stay since moving in significantly above state average.
- Number of rooms per house below state average.
- Number of college students significantly below state average.
Data:
100%
rural population.
Estimated median house/condo value in 2022: $167,021
| 45112: | $167,021 |
| Ohio: | $204,100 |
Median resident age:| This zip code: | 74.7 years |
| Ohio median age: | 39.9 years |
Average household size:| This zip code: | 1.6 people |
| Ohio: | 2.4 people |
Averages for the 2004 tax year for zip code 45112, filed in 2005:
Average Adjusted Gross Income (AGI) in 2004: $34,794 (Individual Income Tax Returns)
| Here: | $34,794 |
| State: | $44,480 |
Salary/wage: $25,958 (reported on 70.6% of returns)
| Here: | $25,958 |
| State: | $39,198 |
Total tax: $4,842 (reported on 55.9% of returns)
Percentage of individuals using paid preparers for their 2004 taxes: 55.9%
Estimated median household income in 2022: | This zip code: | $60,702 |
| Ohio: | $65,720 |
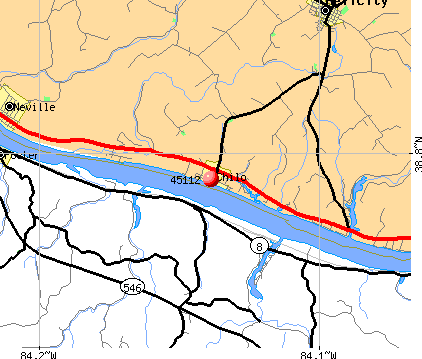
![Chilo, OH (45112) map]() Nearest zip codes: 45120
Nearest zip codes: 45120,
41043,
45156,
45153,
41004,
45106.
Chilo Zip Code Map
Percentage of family households:| This zip code: | 10.7% |
| Ohio: | 43.3% |
Percentage of households with unmarried partners:| This zip code: | 35.3% |
| Ohio: | 44.6% |
No gay or lesbian households reported
Household received Food Stamps/SNAP in the past 12 months: 0
Household did not receive Food Stamps/SNAP in the past 12 months: 9
Housing units in zip code 45112 with a mortgage: 1
Median number of rooms in houses and condos:

- Year house built (houses)
- 02020 or later
- 02010 to 2019
- 42000 to 2009
- 51990 to 1999
- 51980 to 1989
- 31970 to 1979
- 21960 to 1969
- 81950 to 1959
- 11940 to 1949
- 121939 or earlier
![Zip code 45112 satellite photo by USGS]()
Zip code 45112 household income distribution in 2022
![Zip code 45112 household income distribution in 2022]()
- 2$50,000 to $59,999
- 3$60,000 to $74,999
- 1$75,000 to $99,999
- 2$150,000 to $199,999
Estimate of home value of owner-occupied houses/condos in 2022 in zip code 45112
![Estimate of home value of owner-occupied houses/condos in 2022 in zip code 45112]()
- 2$30,000 to $34,999
- 1$125,000 to $149,999
- 1$150,000 to $174,999
- 1$200,000 to $249,999
- 2$250,000 to $299,999
Median price asked for vacant for-sale houses and condos in 2022: $342,318.
Estimated median house (or condo) value in 2022 for:
- White Non-Hispanic householders: $154,649
- Some other race householders: $680,457
Estimated median house or condo value in 2022: $167,021
| 45112: | $167,021 |
| Ohio: | $204,100 |
Mean price in 2022:
Detached houses: $174,364| Here: | $174,364 |
| State: | $254,366 |
Housing units in structures:
- One, detached: 34
- Mobile homes: 5
Means of transportation to work in zip code 45112
![Means of transportation to work in zip code 45112]()
- 24.6%1Drove a car alone
- 49.3%2Worked at home
Travel time to work (commute) in zip code 45112
![Travel time to work (commute) in zip code 45112]()
Percentage of zip code residents living and working in this county: 100.0%
Household type by relationship:
Households: 14
- Male householders: 4 (1 living alone), Female householders: 5 (2 living alone)
6 spouses (6 opposite-sex spouses), 0 unmarried partners, (0 opposite-sex unmarried partners), 0 children (0 natural, 0 adopted, 0 stepchildren), 0 grandchildren, 0 brothers or sisters, 0 parents, 0 foster children, 0 other relatives, 0 non-relatives
Size of family households: 6 2-persons
Size of nonfamily households: 3 1-person
107.1% of residents of 45112 zip code speak English at home.
Foreign born population: 2 (13.5%)
(0.0%
of them are naturalized citizens)
- Year of entry for the foreign-born population
- 02010 or later
- 02000 to 2009
- 01990 to 1999
- 1Before 1990
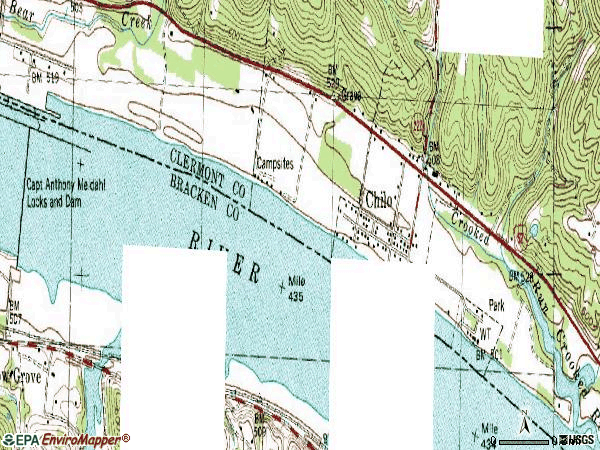
![Zip code 45112 topographic map]()
Housing units lacking complete plumbing facilities: 12.8%
Housing units lacking complete kitchen facilities: 10.1%

- 45.3%Electricity
- 34.0%Bottled, tank, or LP gas
- 22.6%Fuel oil, kerosene, etc.
Place of birth for U.S.-born residents:
67% of the 45112 zip code residents lived in the same house 5 years ago.
Out of people who lived in different houses, 69% lived in this county.
100% of the 45112 zip code residents lived in the same house 1 year ago.
Top industries in this zip code by the number of employees in 2005:
- Accommodation and Food Services: Snack and Nonalcoholic Beverage Bars (1-4 employees: 1 establishment)
- Accommodation and Food Services: Full-Service Restaurants (1-4: 1)
Home Mortgage Disclosure Act Aggregated Statistics For Year 2009
(Based on 2 partial tracts)
|
| C) Refinancings
|
|---|
| Number | Average Value |
|---|
| LOANS ORIGINATED | 2 | $150,005 |
| APPLICATIONS APPROVED, NOT ACCEPTED | 0 | $0 |
| APPLICATIONS DENIED | 1 | $168,820 |
| APPLICATIONS WITHDRAWN | 0 | $0 |
| FILES CLOSED FOR INCOMPLETENESS | 0 | $0 |
Aggregated Statistics For Year 2008
(Based on 2 partial tracts)
|
| B) Conventional
Home Purchase Loans | C) Refinancings
|
|---|
| Number | Average Value | Number | Average Value |
|---|
| LOANS ORIGINATED | 1 | $45,270 | 1 | $171,180 |
| APPLICATIONS APPROVED, NOT ACCEPTED | 0 | $0 | 0 | $0 |
| APPLICATIONS DENIED | 0 | $0 | 1 | $121,540 |
| APPLICATIONS WITHDRAWN | 0 | $0 | 1 | $60,950 |
| FILES CLOSED FOR INCOMPLETENESS | 0 | $0 | 0 | $0 |
Aggregated Statistics For Year 2007
(Based on 2 partial tracts)
|
| B) Conventional
Home Purchase Loans | C) Refinancings
| G) Loans On Manufactured
Home Dwelling (A B C & D) |
|---|
| Number | Average Value | Number | Average Value | Number | Average Value |
|---|
| LOANS ORIGINATED | 1 | $87,770 | 2 | $88,830 | 1 | $46,760 |
| APPLICATIONS APPROVED, NOT ACCEPTED | 0 | $0 | 0 | $0 | 0 | $0 |
| APPLICATIONS DENIED | 0 | $0 | 2 | $99,180 | 1 | $40,700 |
| APPLICATIONS WITHDRAWN | 0 | $0 | 0 | $0 | 0 | $0 |
| FILES CLOSED FOR INCOMPLETENESS | 0 | $0 | 0 | $0 | 0 | $0 |
Aggregated Statistics For Year 2006
(Based on 2 partial tracts)
|
| B) Conventional
Home Purchase Loans | C) Refinancings
| G) Loans On Manufactured
Home Dwelling (A B C & D) |
|---|
| Number | Average Value | Number | Average Value | Number | Average Value |
|---|
| LOANS ORIGINATED | 1 | $110,120 | 1 | $169,270 | 1 | $37,040 |
| APPLICATIONS APPROVED, NOT ACCEPTED | 0 | $0 | 0 | $0 | 0 | $0 |
| APPLICATIONS DENIED | 1 | $65,320 | 2 | $107,090 | 1 | $48,620 |
| APPLICATIONS WITHDRAWN | 0 | $0 | 1 | $89,370 | 0 | $0 |
| FILES CLOSED FOR INCOMPLETENESS | 0 | $0 | 0 | $0 | 0 | $0 |
Aggregated Statistics For Year 2005
(Based on 2 partial tracts)
|
| B) Conventional
Home Purchase Loans | C) Refinancings
| G) Loans On Manufactured
Home Dwelling (A B C & D) |
|---|
| Number | Average Value | Number | Average Value | Number | Average Value |
|---|
| LOANS ORIGINATED | 1 | $128,660 | 2 | $124,865 | 1 | $47,650 |
| APPLICATIONS APPROVED, NOT ACCEPTED | 0 | $0 | 1 | $79,240 | 0 | $0 |
| APPLICATIONS DENIED | 1 | $53,680 | 3 | $105,720 | 1 | $63,020 |
| APPLICATIONS WITHDRAWN | 0 | $0 | 1 | $138,470 | 0 | $0 |
| FILES CLOSED FOR INCOMPLETENESS | 0 | $0 | 0 | $0 | 0 | $0 |
Aggregated Statistics For Year 2004
(Based on 2 partial tracts)
|
| B) Conventional
Home Purchase Loans | C) Refinancings
| G) Loans On Manufactured
Home Dwelling (A B C & D) |
|---|
| Number | Average Value | Number | Average Value | Number | Average Value |
|---|
| LOANS ORIGINATED | 1 | $103,340 | 3 | $88,140 | 0 | $0 |
| APPLICATIONS APPROVED, NOT ACCEPTED | 0 | $0 | 1 | $89,080 | 0 | $0 |
| APPLICATIONS DENIED | 1 | $45,700 | 3 | $96,787 | 1 | $42,070 |
| APPLICATIONS WITHDRAWN | 0 | $0 | 1 | $135,560 | 0 | $0 |
| FILES CLOSED FOR INCOMPLETENESS | 0 | $0 | 0 | $0 | 0 | $0 |
Aggregated Statistics For Year 2003
(Based on 2 partial tracts)
|
| B) Conventional
Home Purchase Loans | C) Refinancings
| D) Home Improvement Loans
|
|---|
| Number | Average Value | Number | Average Value | Number | Average Value |
|---|
| LOANS ORIGINATED | 1 | $124,250 | 5 | $105,304 | 1 | $14,290 |
| APPLICATIONS APPROVED, NOT ACCEPTED | 0 | $0 | 1 | $64,300 | 0 | $0 |
| APPLICATIONS DENIED | 1 | $40,280 | 3 | $92,460 | 0 | $0 |
| APPLICATIONS WITHDRAWN | 0 | $0 | 1 | $151,600 | 0 | $0 |
| FILES CLOSED FOR INCOMPLETENESS | 0 | $0 | 0 | $0 | 0 | $0 |
Aggregated Statistics For Year 2002
(Based on 2 partial tracts)
|
| B) Conventional
Home Purchase Loans | C) Refinancings
| D) Home Improvement Loans
|
|---|
| Number | Average Value | Number | Average Value | Number | Average Value |
|---|
| LOANS ORIGINATED | 1 | $146,990 | 5 | $89,276 | 1 | $12,820 |
| APPLICATIONS APPROVED, NOT ACCEPTED | 0 | $0 | 1 | $95,720 | 0 | $0 |
| APPLICATIONS DENIED | 1 | $29,480 | 2 | $94,340 | 0 | $0 |
| APPLICATIONS WITHDRAWN | 0 | $0 | 1 | $91,800 | 0 | $0 |
| FILES CLOSED FOR INCOMPLETENESS | 0 | $0 | 0 | $0 | 0 | $0 |
Aggregated Statistics For Year 2001
(Based on 2 partial tracts)
|
| B) Conventional
Home Purchase Loans | C) Refinancings
| D) Home Improvement Loans
|
|---|
| Number | Average Value | Number | Average Value | Number | Average Value |
|---|
| LOANS ORIGINATED | 1 | $123,910 | 4 | $80,398 | 0 | $0 |
| APPLICATIONS APPROVED, NOT ACCEPTED | 0 | $0 | 1 | $87,030 | 0 | $0 |
| APPLICATIONS DENIED | 1 | $48,910 | 2 | $85,015 | 1 | $7,430 |
| APPLICATIONS WITHDRAWN | 0 | $0 | 1 | $102,310 | 0 | $0 |
| FILES CLOSED FOR INCOMPLETENESS | 0 | $0 | 0 | $0 | 0 | $0 |
Aggregated Statistics For Year 2000
(Based on 2 partial tracts)
|
| B) Conventional
Home Purchase Loans | C) Refinancings
| D) Home Improvement Loans
|
|---|
| Number | Average Value | Number | Average Value | Number | Average Value |
|---|
| LOANS ORIGINATED | 2 | $68,375 | 2 | $58,660 | 0 | $0 |
| APPLICATIONS APPROVED, NOT ACCEPTED | 1 | $35,660 | 1 | $34,780 | 0 | $0 |
| APPLICATIONS DENIED | 2 | $47,305 | 2 | $56,600 | 1 | $6,730 |
| APPLICATIONS WITHDRAWN | 0 | $0 | 1 | $46,640 | 0 | $0 |
| FILES CLOSED FOR INCOMPLETENESS | 0 | $0 | 0 | $0 | 0 | $0 |
Aggregated Statistics For Year 1999
(Based on 1 partial tract)
|
| B) Conventional
Home Purchase Loans | C) Refinancings
|
|---|
| Number | Average Value | Number | Average Value |
|---|
| LOANS ORIGINATED | 1 | $58,010 | 1 | $107,020 |
| APPLICATIONS APPROVED, NOT ACCEPTED | 0 | $0 | 1 | $38,610 |
| APPLICATIONS DENIED | 1 | $51,500 | 1 | $55,300 |
| APPLICATIONS WITHDRAWN | 0 | $0 | 1 | $34,750 |
| FILES CLOSED FOR INCOMPLETENESS | 0 | $0 | 0 | $0 |


 Nearest zip codes: 45120, 41043, 45156, 45153, 41004, 45106.