Estimated zip code population in 2022: 2,358 Zip code population in 2010: 1,665 Zip code population in 2000: 2,056
Houses and condos: 975 Renter-occupied apartments: 108
% of renters here:
13%
State:
33%
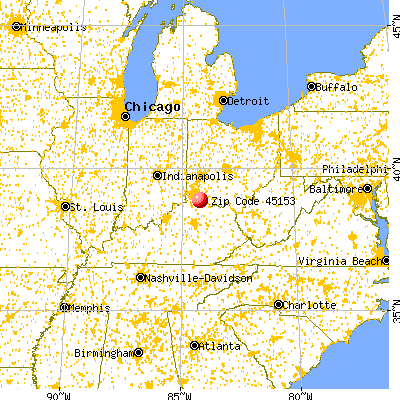
March 2022 cost of living index in zip code 45153: 85.5 (less than average, U.S. average is 100)
Land area: 27.9 sq. mi. Water area: 0.3 sq. mi.
Population density: 85 people per square mile
(very low).
OSM Map
General Map
Google Map
MSN Map
OSM Map
General Map
Google Map
MSN Map
OSM Map
General Map
Google Map
MSN Map
OSM Map
General Map
Google Map
MSN Map
Please wait while loading the map...
Real estate property taxes paid for housing units in 2022:
This zip code:
0.8% ($1,613)
Ohio:
1.3% ($2,639)
Median real estate property taxes paid for housing units with mortgages in 2022: $1,601 (0.6%) Median real estate property taxes paid for housing units with no mortgage in 2022: $1,635 (1.0%)
Business Search- 14 Million verified businesses
Males: 1,259
(53.4%)
Females: 1,099
(46.6%)
For population 25 years and over in 45153:
High school or higher: 81.7%
Bachelor's degree or higher: 23.6%
Graduate or professional degree: 10.8%
Unemployed: 9.1%
Mean travel time to work (commute): 41.7 minutes
For population 15 years and over in 45153:
Never married: 31.9%
Now married: 51.6%
Separated: 4.2%
Widowed: 3.5%
Divorced: 8.8%
Zip code 45153 compared to state average:
Unemployed percentage above state average.
Black race population percentage significantly below state average.
Hispanic race population percentage significantly below state average.
Median age significantly above state average.
Foreign-born population percentage significantly below state average.
Renting percentage significantly below state average.
Length of stay since moving in significantly above state average.
Averages for the 2020 tax year for zip code 45153, filed in 2021:
Average Adjusted Gross Income (AGI) in 2020: $58,584 (Individual Income Tax Returns)
Here:
$58,584
State:
$67,288
Salary/wage: $52,216 (reported on 83.1% of returns)
Here:
$52,216
State:
$55,628
(% of AGI for various income ranges: 1032.9% for AGIs below $25k, 3420.6% for AGIs $25k-50k, 6536.0% for AGIs $50k-75k, 8737.1% for AGIs $75k-100k, 15562.9% for AGIs $100k-200k)
Taxable interest for individuals: $647 (reported on 22.9% of returns)
This zip code:
$647
Ohio:
$1,518
(% of AGI for various income ranges: 7.6% for AGIs below $25k, 4.1% for AGIs $25k-50k, 38.0% for AGIs $50k-75k, 8.6% for AGIs $75k-100k, 80.0% for AGIs $100k-200k)
Ordinary dividends: $2,991 (reported on 13.3% of returns)
Here:
$2,991
State:
$7,167
(% of AGI for various income ranges: 7.6% for AGIs below $25k, 100.0% for AGIs $50k-75k, 15.7% for AGIs $75k-100k, 288.6% for AGIs $100k-200k)
Net capital gain/loss in AGI: +$7,822 (reported on 10.8% of returns)
Here:
+$7,822
State:
+$18,919
(% of AGI for various income ranges: 46.0% for AGIs $50k-75k, 940.0% for AGIs $100k-200k)
Profit/loss from business: +$7,522 (reported on 10.8% of returns)
Here:
+$7,522
State:
+$13,744
(% of AGI for various income ranges: 123.8% for AGIs below $25k, 203.5% for AGIs $25k-50k, 101.4% for AGIs $75k-100k)
Taxable individual retirement arrangement distribution: $14,362 (reported on 9.6% of returns)
45153:
$14,362
Ohio:
$18,876
(% of AGI for various income ranges: 163.8% for AGIs below $25k, 313.0% for AGIs $50k-75k, 702.9% for AGIs $100k-200k)
Total itemized deductions: $21,433 (reported on 3.6% of returns)
Here:
$21,433
State:
$33,869
(% of AGI for various income ranges: 643.0% for AGIs $50k-75k)
Taxes paid: $5,567 (reported on 3.6% of returns)
45153:
$5,567
State:
$7,681
(% of AGI for various income ranges: 238.6% for AGIs $75k-100k)
Earned income credit: $2,315 (reported on 15.7% of returns)
Here:
$2,315
State:
$2,304
(% of AGI for various income ranges: 97.6% for AGIs below $25k, 56.5% for AGIs $25k-50k)
Percentage of individuals using paid preparers for their 2020 taxes: 94.0%
Here:
94%
State:
94%
(% for various income ranges: 92.6% for AGIs below $25k, 95.2% for AGIs $25k-50k, 92.3% for AGIs $50k-75k, 100.0% for AGIs $75k-100k, 90.9% for AGIs $100k-200k, 100.0% for AGIs over 200k)
Averages for the 2012 tax year for zip code 45153, filed in 2013:
Average Adjusted Gross Income (AGI) in 2012: $47,641 (Individual Income Tax Returns)
Here:
$47,641
State:
$54,926
Salary/wage: $40,983 (reported on 84.2% of returns)
Here:
$40,983
State:
$45,869
(% of AGI for various income ranges: 69.7% for AGIs below $25k, 77.9% for AGIs $25k-50k, 76.6% for AGIs $50k-75k, 79.5% for AGIs $75k-100k, 63.4% for AGIs $100k-200k)
Taxable interest for individuals: $405 (reported on 25.0% of returns)
This zip code:
$405
Ohio:
$1,297
(% of AGI for various income ranges: 0.2% for AGIs below $25k, 0.3% for AGIs $25k-50k, 0.1% for AGIs $50k-75k, 0.2% for AGIs $75k-100k, 0.2% for AGIs $100k-200k)
Ordinary dividends: $2,158 (reported on 15.8% of returns)
Here:
$2,158
State:
$5,821
(% of AGI for various income ranges: 0.6% for AGIs $25k-50k, 0.6% for AGIs $50k-75k, 1.5% for AGIs $100k-200k)
Net capital gain/loss in AGI: +$2,044 (reported on 11.8% of returns)
Here:
+$2,044
State:
+$11,232
(% of AGI for various income ranges: 0.2% for AGIs below $25k, 0.1% for AGIs $50k-75k, 1.4% for AGIs $100k-200k)
Profit/loss from business: +$12,438 (reported on 17.1% of returns)
Here:
+$12,438
State:
+$12,773
(% of AGI for various income ranges: 10.6% for AGIs below $25k, 5.4% for AGIs $25k-50k, 11.7% for AGIs $75k-100k)
Taxable individual retirement arrangement distribution: $15,657 (reported on 9.2% of returns)
45153:
$15,657
Ohio:
$14,511
(% of AGI for various income ranges: 6.5% for AGIs $25k-50k, 8.9% for AGIs $75k-100k)
Total itemized deductions: $16,639 (20% of AGI, reported on 23.7% of returns)
Here:
$16,639
State:
$21,278
Here:
19.5% of AGI
State:
18.8% of AGI
(% of AGI for various income ranges: 8.6% for AGIs $25k-50k, 7.0% for AGIs $50k-75k, 8.9% for AGIs $75k-100k, 11.1% for AGIs $100k-200k)
Charity contributions: $2,815 (reported on 17.1% of returns)
Here:
$2,815
State:
$3,943
(% of AGI for various income ranges: 1.5% for AGIs $25k-50k, 0.7% for AGIs $75k-100k, 1.8% for AGIs $100k-200k)
Taxes paid: $5,644 (reported on 23.7% of returns)
45153:
$5,644
State:
$9,568
(% of AGI for various income ranges: 1.9% for AGIs $25k-50k, 2.1% for AGIs $50k-75k, 3.1% for AGIs $75k-100k, 4.5% for AGIs $100k-200k)
Earned income credit: $2,187 (reported on 19.7% of returns)
Here:
$2,187
State:
$2,285
(% of AGI for various income ranges: 6.6% for AGIs below $25k, 1.1% for AGIs $25k-50k)
Percentage of individuals using paid preparers for their 2012 taxes: 53.9%
Here:
54%
State:
51%
(% for various income ranges: 50.0% for AGIs below $25k, 52.6% for AGIs $25k-50k, 54.5% for AGIs $50k-75k, 62.5% for AGIs $75k-100k, 62.5% for AGIs $100k-200k)
Averages for the 2004 tax year for zip code 45153, filed in 2005:
Average Adjusted Gross Income (AGI) in 2004: $39,120 (Individual Income Tax Returns)
Here:
$39,120
State:
$44,480
Salary/wage: $35,795 (reported on 87.5% of returns)
Here:
$35,795
State:
$39,198
(% of AGI for various income ranges: 93.3% for AGIs below $10k, 71.6% for AGIs $10k-25k, 79.9% for AGIs $25k-50k, 82.6% for AGIs $50k-75k, 89.6% for AGIs $75k-100k, 72.6% for AGIs over 100k)
Taxable interest for individuals: $760 (reported on 36.5% of returns)
This zip code:
$760
Ohio:
$1,532
(% of AGI for various income ranges: 2.5% for AGIs below $10k, 1.1% for AGIs $10k-25k, 0.7% for AGIs $25k-50k, 0.8% for AGIs $50k-75k, 0.3% for AGIs $75k-100k, 0.5% for AGIs over 100k)
Taxable dividends: $1,867 (reported on 18.5% of returns)
Here:
$1,867
State:
$3,496
(% of AGI for various income ranges: 1.3% for AGIs below $10k, 1.2% for AGIs $10k-25k, 0.7% for AGIs $25k-50k, 0.8% for AGIs $50k-75k, 0.1% for AGIs $75k-100k, 1.8% for AGIs over 100k)
Net capital gain/loss: +$5,222 (reported on 11.1% of returns)
Here:
+$5,222
State:
+$8,582
(% of AGI for various income ranges: -0.4% for AGIs $10k-25k, 0.3% for AGIs $25k-50k, -0.1% for AGIs $50k-75k, 7.9% for AGIs over 100k)
Profit/loss from business: +$7,906 (reported on 14.4% of returns)
Here:
+$7,906
State:
+$10,813
(% of AGI for various income ranges: -0.5% for AGIs below $10k, 8.8% for AGIs $10k-25k, 2.3% for AGIs $25k-50k, 4.2% for AGIs $50k-75k, 1.3% for AGIs $75k-100k)
Total itemized deductions: $15,045 (22% of AGI, reported on 29.9% of returns)
Here:
$15,045
State:
$17,503
Here:
22.3% of AGI
State:
20.8% of AGI
(% of AGI for various income ranges: 7.8% for AGIs $10k-25k, 8.8% for AGIs $25k-50k, 12.0% for AGIs $50k-75k, 14.1% for AGIs $75k-100k, 15.8% for AGIs over 100k)
Charity contributions deductions: $2,419 (3% of AGI, reported on 21.2% of returns)
Here:
$2,419
State:
$3,087
Here:
3.3% of AGI
State:
3.4% of AGI
(% of AGI for various income ranges: 3.6% for AGIs below $10k, 0.9% for AGIs $25k-50k, 1.2% for AGIs $50k-75k, 1.1% for AGIs $75k-100k, 2.7% for AGIs over 100k)
Total tax: $4,709 (reported on 75.4% of returns)
45153:
$4,709
State:
$6,781
(% of AGI for various income ranges: 1.3% for AGIs below $10k, 4.6% for AGIs $10k-25k, 6.9% for AGIs $25k-50k, 9.4% for AGIs $50k-75k, 10.3% for AGIs $75k-100k, 14.0% for AGIs over 100k)
Earned income credit: $1,760 (reported on 15.4% of returns)
Here:
$1,760
State:
$1,696
Percentage of individuals using paid preparers for their 2004 taxes: 57.7%
Here:
58%
State:
55%
(% for various income ranges: 47.6% for AGIs below $10k, 61.3% for AGIs $10k-25k, 58.5% for AGIs $25k-50k, 64.8% for AGIs $50k-75k, 43.6% for AGIs $75k-100k, 65.2% for AGIs over 100k)
Household received Food Stamps/SNAP in the past 12 months: 77 Household did not receive Food Stamps/SNAP in the past 12 months: 759
Women who had a birth in the past 12 months: 6 (7 now married, 0 unmarried) Women who did not have a birth in the past 12 months: 467 (186 now married, 281 unmarried)
Housing units in zip code 45153 with a mortgage: 408 (44 second mortgage, 45 both second mortgage and home equity loan) Houses without a mortgage: 1
Median monthly owner costs for units with a mortgage: $1,184 Median monthly owner costs for units without a mortgage: $462
Residents with income below the poverty level in 2022:
This zip code:
13.3%
Whole state:
13.4%
Residents with income below 50% of the poverty level in 2022:
This zip code:
5.0%
Whole state:
7.0%
Median number of rooms in houses and condos:
Here:
6.4
State:
6.7
Median number of rooms in apartments:
Here:
5.6
State:
4.4
Notable locations in this zip code not listed on our city pages
Notable locations in zip code 45153: William H Zimmer Nuclear Power Station (A), Washington Township Fire and Rescue Station 66 (B), Washington Township Fire and Rescue Station 67 (C). Display/hide their locations on the map
Cemeteries: McKendree Cemetery (1), Moscow Cemetery (2), New Calvary Cemetery (3), Old Calvary Cemetery (4), Point Isabel Cemetery (5), Wood Cemetery (6). Display/hide their locations on the map
Streams, rivers, and creeks: Opossum Run (A), Ray Run (B), Little Indian Creek (C), North Fork Indian Creek (D), Colclaser Run (E), Maple Creek (F), Vinegar Run (G), Sugar Creek (H), Stony Fork (I). Display/hide their locations on the map
Size of family households: 177 2-persons, 187 3-persons, 126 4-persons, 44 5-persons, 21 6-persons
Size of nonfamily households: 214 1-person, 36 2-persons, 27 7-or-more-persons
170 married couples with children.
43 single-parent households (43 women).
98.2% of residents of 45153 zip code speak English at home.
0.9% of residents speak other Indo-European language at home (100% very well).
0.9% of residents speak Asian or Pacific Island language at home (100% very well).
Foreign born population: 22 (1.0%) (100.0% of them are naturalized citizens)
This zip code:
1.0%
Whole state:
5.0%
86%Malaysia
39%German
15%American
10%European
9%Irish
9%English
5%French
4%Dutch
Year of entry for the foreign-born population
02010 or later
212000 to 2009
01990 to 1999
0Before 1990
Housing units lacking complete plumbing facilities: 1.3% Housing units lacking complete kitchen facilities: 1.0%
42.7%Electricity
18.8%Bottled, tank, or LP gas
15.9%Fuel oil, kerosene, etc.
12.7%Other fuel
7.6%Wood
2.7%Coal or coke
Population in 1990: 1,957. Population change in the 1990s: +99 (+5.1%).
Place of birth for U.S.-born residents:
This state: 1,744
Northeast: 35
Midwest: 125
South: 418
70% of the 45153 zip code residents lived in the same house 5 years ago. Out of people who lived in different houses, 66% lived in this county. Out of people who lived in different counties, 50% lived in Ohio.
95% of the 45153 zip code residents lived in the same house 1 year ago. Out of people who lived in different houses, 100% moved from this county.
Private vs. public school enrollment:
Students in private schools in grades 1 to 8 (elementary and middle school): 40
Here:
34.8%
Ohio:
16.0%
Students in private schools in grades 9 to 12 (high school):
Here:
0.0%
Ohio:
13.1%
Students in private undergraduate colleges:
Here:
0.0%
Ohio:
22.3%
Occupation by median earnings in the past 12 months ($)
81,548Installation, maintenance, and repair occupations
79,917Transportation occupations
70,156Construction and extraction occupations
64,231Production occupations
57,095Computer and mathematical occupations
53,562Management occupations
Companies with federal contracts located in this zip code:
ANACONDA POWER PACK, INC (101 SANTA MARIA WOODS DR in MOSCOW, OH; small business)
$7,372 with Army for Compressors and Vacuum Pumps. Taking place in NM. Signed on 2003-09-17. Completion date: 2003-10-16.
Top industries in this zip code by the number of employees in 2005:
Utilities: Electric Power Distribution (100-249 employees: 1 establishment, 50-99 employees: 1 establishment)
Educational Services: Educational Support Services (5-9: 1)
Construction: Other Building Finishing Contractors (5-9: 1)
Other Services (except Public Administration): Pet Care (except Veterinary) Services (5-9: 1)
Construction: Water and Sewer Line and Related Structures Construction (5-9: 1)
Other Services (except Public Administration): Automotive Body, Paint, and Interior Repair and Maintenance (5-9: 1)
Construction: Roofing Contractors (5-9: 1)
Construction: Framing Contractors (1-4: 1)
Administrative and Support and Waste Management and Remediation Services: Landscaping Services (1-4: 1)
Fatal accident statistics in 2014:
Fatal accident count: 1
Vehicles involved in fatal accidents: 1
Fatal accidents caused by drunken drivers: 1
Fatalities: 1
Persons involved in fatal accidents: 1
Pedestrians involved in fatal accidents: 0
Home Mortgage Disclosure Act Aggregated Statistics For Year 2009 (Based on 4 partial tracts)
A) FHA, FSA/RHS & VA Home Purchase Loans
B) Conventional Home Purchase Loans
C) Refinancings
D) Home Improvement Loans
F) Non-occupant Loans on < 5 Family Dwellings (A B C & D)
G) Loans On Manufactured Home Dwelling (A B C & D)
Number
Average Value
Number
Average Value
Number
Average Value
Number
Average Value
Number
Average Value
Number
Average Value
LOANS ORIGINATED
13
$131,908
15
$97,214
129
$161,429
9
$88,944
6
$73,308
17
$78,691
APPLICATIONS APPROVED, NOT ACCEPTED
2
$82,130
2
$60,295
15
$152,059
1
$118,950
0
$0
4
$81,755
APPLICATIONS DENIED
3
$128,847
3
$85,817
61
$155,919
7
$25,609
1
$96,350
6
$82,677
APPLICATIONS WITHDRAWN
2
$131,085
1
$198,150
20
$132,478
2
$27,450
0
$0
4
$48,238
FILES CLOSED FOR INCOMPLETENESS
0
$0
0
$0
6
$124,763
0
$0
0
$0
0
$0
Aggregated Statistics For Year 2008 (Based on 4 partial tracts)
A) FHA, FSA/RHS & VA Home Purchase Loans
B) Conventional Home Purchase Loans
C) Refinancings
D) Home Improvement Loans
F) Non-occupant Loans on < 5 Family Dwellings (A B C & D)
G) Loans On Manufactured Home Dwelling (A B C & D)
Number
Average Value
Number
Average Value
Number
Average Value
Number
Average Value
Number
Average Value
Number
Average Value
LOANS ORIGINATED
14
$92,683
27
$110,203
74
$136,262
11
$31,794
10
$88,838
20
$57,224
APPLICATIONS APPROVED, NOT ACCEPTED
0
$0
4
$40,478
11
$160,229
2
$16,825
0
$0
4
$48,555
APPLICATIONS DENIED
5
$105,568
17
$78,306
54
$129,567
7
$58,324
3
$133,477
18
$66,373
APPLICATIONS WITHDRAWN
2
$115,920
6
$134,252
29
$134,788
2
$75,215
1
$72,370
4
$91,545
FILES CLOSED FOR INCOMPLETENESS
1
$38,600
1
$122,190
2
$189,305
1
$114,810
0
$0
1
$101,550
Aggregated Statistics For Year 2007 (Based on 4 partial tracts)
A) FHA, FSA/RHS & VA Home Purchase Loans
B) Conventional Home Purchase Loans
C) Refinancings
D) Home Improvement Loans
F) Non-occupant Loans on < 5 Family Dwellings (A B C & D)
G) Loans On Manufactured Home Dwelling (A B C & D)
Number
Average Value
Number
Average Value
Number
Average Value
Number
Average Value
Number
Average Value
Number
Average Value
LOANS ORIGINATED
10
$103,682
44
$141,027
83
$129,081
12
$51,481
9
$75,304
23
$78,189
APPLICATIONS APPROVED, NOT ACCEPTED
1
$47,550
7
$150,301
17
$110,685
5
$23,790
1
$113,030
3
$82,473
APPLICATIONS DENIED
4
$96,195
24
$114,100
95
$111,595
18
$53,663
6
$73,017
22
$78,595
APPLICATIONS WITHDRAWN
1
$75,810
8
$109,266
17
$141,664
2
$73,745
1
$279,960
2
$66,510
FILES CLOSED FOR INCOMPLETENESS
1
$95,560
2
$180,865
9
$210,533
0
$0
0
$0
1
$20,680
Aggregated Statistics For Year 2006 (Based on 4 partial tracts)
A) FHA, FSA/RHS & VA Home Purchase Loans
B) Conventional Home Purchase Loans
C) Refinancings
D) Home Improvement Loans
F) Non-occupant Loans on < 5 Family Dwellings (A B C & D)
G) Loans On Manufactured Home Dwelling (A B C & D)
Number
Average Value
Number
Average Value
Number
Average Value
Number
Average Value
Number
Average Value
Number
Average Value
LOANS ORIGINATED
10
$135,494
50
$113,932
86
$129,532
20
$58,970
8
$90,916
24
$68,816
APPLICATIONS APPROVED, NOT ACCEPTED
1
$74,430
7
$77,196
23
$123,519
1
$33,770
1
$47,550
6
$96,840
APPLICATIONS DENIED
2
$96,890
25
$104,100
99
$109,124
19
$44,942
8
$82,680
33
$67,165
APPLICATIONS WITHDRAWN
1
$120,610
12
$92,884
36
$128,376
3
$41,380
5
$70,736
6
$66,862
FILES CLOSED FOR INCOMPLETENESS
0
$0
5
$160,308
8
$126,890
0
$0
3
$183,787
2
$54,790
Aggregated Statistics For Year 2005 (Based on 4 partial tracts)
A) FHA, FSA/RHS & VA Home Purchase Loans
B) Conventional Home Purchase Loans
C) Refinancings
D) Home Improvement Loans
E) Loans on Dwellings For 5+ Families
F) Non-occupant Loans on < 5 Family Dwellings (A B C & D)
G) Loans On Manufactured Home Dwelling (A B C & D)
Number
Average Value
Number
Average Value
Number
Average Value
Number
Average Value
Number
Average Value
Number
Average Value
Number
Average Value
LOANS ORIGINATED
13
$109,912
60
$125,072
114
$120,704
25
$22,713
0
$0
10
$63,806
28
$73,246
APPLICATIONS APPROVED, NOT ACCEPTED
1
$86,150
8
$116,334
35
$105,346
2
$88,445
0
$0
2
$71,330
5
$68,448
APPLICATIONS DENIED
2
$116,375
24
$97,609
134
$114,537
14
$40,406
0
$0
9
$50,104
37
$72,539
APPLICATIONS WITHDRAWN
0
$0
18
$95,630
50
$141,601
5
$155,230
0
$0
4
$86,635
6
$69,390
FILES CLOSED FOR INCOMPLETENESS
2
$96,505
6
$126,233
7
$156,034
1
$37,910
1
$73,060
0
$0
2
$124,055
Aggregated Statistics For Year 2004 (Based on 4 partial tracts)
A) FHA, FSA/RHS & VA Home Purchase Loans
B) Conventional Home Purchase Loans
C) Refinancings
D) Home Improvement Loans
F) Non-occupant Loans on < 5 Family Dwellings (A B C & D)
G) Loans On Manufactured Home Dwelling (A B C & D)
Number
Average Value
Number
Average Value
Number
Average Value
Number
Average Value
Number
Average Value
Number
Average Value
LOANS ORIGINATED
8
$94,589
57
$108,135
140
$114,660
23
$47,997
16
$64,078
23
$67,870
APPLICATIONS APPROVED, NOT ACCEPTED
0
$0
6
$82,617
38
$113,241
2
$37,075
3
$107,057
6
$59,170
APPLICATIONS DENIED
1
$147,490
24
$79,135
136
$115,659
23
$37,143
6
$63,350
26
$73,168
APPLICATIONS WITHDRAWN
0
$0
7
$107,499
59
$113,461
6
$66,792
5
$92,540
3
$86,303
FILES CLOSED FOR INCOMPLETENESS
1
$45,490
3
$78,313
14
$100,915
1
$118,970
1
$74,250
1
$113,100
Aggregated Statistics For Year 2003 (Based on 4 partial tracts)
A) FHA, FSA/RHS & VA Home Purchase Loans
B) Conventional Home Purchase Loans
C) Refinancings
D) Home Improvement Loans
F) Non-occupant Loans on < 5 Family Dwellings (A B C & D)
Number
Average Value
Number
Average Value
Number
Average Value
Number
Average Value
Number
Average Value
LOANS ORIGINATED
13
$99,080
66
$123,227
283
$113,346
24
$29,561
14
$68,125
APPLICATIONS APPROVED, NOT ACCEPTED
1
$74,430
11
$76,102
39
$108,104
2
$44,110
1
$67,960
APPLICATIONS DENIED
3
$107,327
27
$72,568
124
$111,651
15
$28,123
6
$84,445
APPLICATIONS WITHDRAWN
1
$90,970
12
$95,685
59
$125,971
2
$70,375
2
$118,945
FILES CLOSED FOR INCOMPLETENESS
0
$0
6
$74,535
14
$102,436
2
$57,925
1
$84,840
Aggregated Statistics For Year 2002 (Based on 2 partial tracts)
A) FHA, FSA/RHS & VA Home Purchase Loans
B) Conventional Home Purchase Loans
C) Refinancings
D) Home Improvement Loans
F) Non-occupant Loans on < 5 Family Dwellings (A B C & D)
Number
Average Value
Number
Average Value
Number
Average Value
Number
Average Value
Number
Average Value
LOANS ORIGINATED
9
$100,547
48
$117,250
177
$96,562
28
$17,525
17
$77,312
APPLICATIONS APPROVED, NOT ACCEPTED
1
$117,850
8
$105,016
40
$91,629
2
$27,225
3
$77,650
APPLICATIONS DENIED
3
$85,000
20
$56,446
83
$87,038
14
$16,984
1
$108,890
APPLICATIONS WITHDRAWN
1
$123,370
3
$63,867
37
$94,998
3
$32,853
1
$99,930
FILES CLOSED FOR INCOMPLETENESS
1
$92,350
1
$110,960
14
$117,311
0
$0
1
$74,430
Aggregated Statistics For Year 2001 (Based on 2 partial tracts)
A) FHA, FSA/RHS & VA Home Purchase Loans
B) Conventional Home Purchase Loans
C) Refinancings
D) Home Improvement Loans
F) Non-occupant Loans on < 5 Family Dwellings (A B C & D)
Number
Average Value
Number
Average Value
Number
Average Value
Number
Average Value
Number
Average Value
LOANS ORIGINATED
9
$101,466
55
$86,263
136
$90,539
19
$20,785
14
$89,596
APPLICATIONS APPROVED, NOT ACCEPTED
0
$0
11
$73,995
35
$95,208
7
$12,701
1
$48,930
APPLICATIONS DENIED
1
$126,120
34
$55,075
85
$76,590
19
$14,981
5
$64,096
APPLICATIONS WITHDRAWN
1
$126,810
7
$95,799
42
$93,272
1
$20,680
2
$68,230
FILES CLOSED FOR INCOMPLETENESS
0
$0
1
$166,100
12
$74,032
2
$13,785
1
$59,960
Aggregated Statistics For Year 2000 (Based on 2 partial tracts)
A) FHA, FSA/RHS & VA Home Purchase Loans
B) Conventional Home Purchase Loans
C) Refinancings
D) Home Improvement Loans
F) Non-occupant Loans on < 5 Family Dwellings (A B C & D)
Number
Average Value
Number
Average Value
Number
Average Value
Number
Average Value
Number
Average Value
LOANS ORIGINATED
8
$83,308
66
$79,331
61
$73,643
19
$19,842
13
$84,772
APPLICATIONS APPROVED, NOT ACCEPTED
1
$66,850
23
$59,361
22
$60,524
7
$14,867
2
$109,585
APPLICATIONS DENIED
1
$690
68
$53,271
61
$71,055
23
$11,207
3
$51,460
APPLICATIONS WITHDRAWN
3
$87,757
7
$75,419
27
$66,138
2
$31,015
0
$0
FILES CLOSED FOR INCOMPLETENESS
1
$36,530
1
$76,500
7
$65,474
1
$2,070
0
$0
Aggregated Statistics For Year 1999 (Based on 2 partial tracts)
A) FHA, FSA/RHS & VA Home Purchase Loans
B) Conventional Home Purchase Loans
C) Refinancings
D) Home Improvement Loans
F) Non-occupant Loans on < 5 Family Dwellings (A B C & D)
Detailed PMIC statistics for the following Tracts:0417.02
, 0420.00
2002 - 2018 National Fire Incident Reporting System (NFIRS) incidents
Based on the data from the years 2002 - 2018 the average number of fires per year is 17. The highest number of fire incidents - 29 took place in 2004, and the least - 8 in 2015. The data has a declining trend.
When looking into fire subcategories, the most reports belonged to: Structure Fires (48.3%), and Outside Fires (33.9%).
Fire incident types reported to NFIRS in Zip Code 45153


 Nearest zip codes: 45156, 45112, 45157, 45120, 41043, 41007.


 Based on the data from the years 2002 - 2018 the average number of fires per year is 17. The highest number of fire incidents - 29 took place in 2004, and the least - 8 in 2015. The data has a declining trend.
 When looking into fire subcategories, the most reports belonged to: Structure Fires (48.3%), and Outside Fires (33.9%).