Estimated zip code population in 2022: 51,617 Zip code population in 2010: 42,234 Zip code population in 2000: 34,727
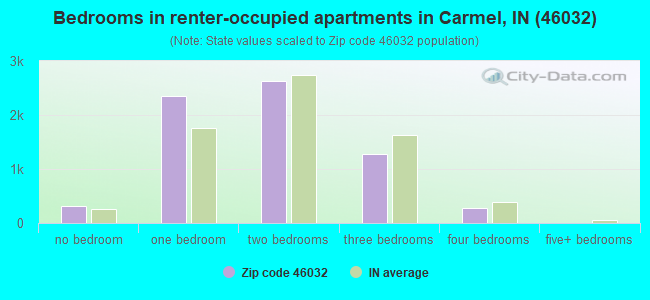
Houses and condos: 22,282 Renter-occupied apartments: 6,799
% of renters here:
32%
State:
29%
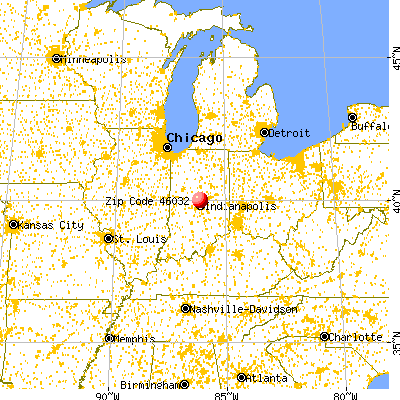
March 2022 cost of living index in zip code 46032: 90.2 (less than average, U.S. average is 100)
Land area: 25.8 sq. mi. Water area: 0.4 sq. mi.
Population density: 2,000 people per square mile
(low).
OSM Map
General Map
Google Map
MSN Map
OSM Map
General Map
Google Map
MSN Map
OSM Map
General Map
Google Map
MSN Map
OSM Map
General Map
Google Map
MSN Map
Please wait while loading the map...
Real estate property taxes paid for housing units in 2022:
This zip code:
0.7% ($3,687)
Indiana:
0.7% ($1,467)
Median real estate property taxes paid for housing units with mortgages in 2022: $3,658 (0.7%) Median real estate property taxes paid for housing units with no mortgage in 2022: $3,854 (0.8%)
Estimated median house/condo value in 2022: $493,332
46032:
$493,332
Indiana:
$208,700
Median resident age:
This zip code:
40.0 years
Indiana median age:
38.2 years
Average household size:
This zip code:
2.4 people
Indiana:
2.4 people
Averages for the 2020 tax year for zip code 46032, filed in 2021:
Average Adjusted Gross Income (AGI) in 2020: $183,588 (Individual Income Tax Returns)
Here:
$183,588
State:
$64,978
Salary/wage: $129,062 (reported on 82.4% of returns)
Here:
$129,062
State:
$55,245
(% of AGI for various income ranges: 1158.9% for AGIs below $25k, 3781.6% for AGIs $25k-50k, 6590.2% for AGIs $50k-75k, 9826.1% for AGIs $75k-100k, 19391.1% for AGIs $100k-200k, 115333.1% for AGIs over 200k)
Taxable interest for individuals: $3,899 (reported on 46.3% of returns)
This zip code:
$3,899
Indiana:
$1,351
(% of AGI for various income ranges: 28.1% for AGIs below $25k, 38.4% for AGIs $25k-50k, 56.1% for AGIs $50k-75k, 109.9% for AGIs $75k-100k, 187.5% for AGIs $100k-200k, 2396.4% for AGIs over 200k)
Ordinary dividends: $14,284 (reported on 42.2% of returns)
Here:
$14,284
State:
$5,827
(% of AGI for various income ranges: 74.8% for AGIs below $25k, 120.4% for AGIs $25k-50k, 213.5% for AGIs $50k-75k, 523.1% for AGIs $75k-100k, 760.9% for AGIs $100k-200k, 7623.3% for AGIs over 200k)
Net capital gain/loss in AGI: +$51,458 (reported on 39.7% of returns)
Here:
+$51,458
State:
+$17,730
(% of AGI for various income ranges: 71.7% for AGIs below $25k, 101.0% for AGIs $25k-50k, 172.2% for AGIs $50k-75k, 409.2% for AGIs $75k-100k, 921.3% for AGIs $100k-200k, 32045.1% for AGIs over 200k)
Profit/loss from business: +$26,573 (reported on 18.0% of returns)
Here:
+$26,573
State:
+$12,144
(% of AGI for various income ranges: 114.8% for AGIs below $25k, 200.9% for AGIs $25k-50k, 261.4% for AGIs $50k-75k, 435.9% for AGIs $75k-100k, 765.8% for AGIs $100k-200k, 5221.8% for AGIs over 200k)
Taxable individual retirement arrangement distribution: $30,808 (reported on 12.7% of returns)
46032:
$30,808
Indiana:
$18,302
(% of AGI for various income ranges: 77.2% for AGIs below $25k, 155.0% for AGIs $25k-50k, 346.2% for AGIs $50k-75k, 647.7% for AGIs $75k-100k, 1135.2% for AGIs $100k-200k, 2910.0% for AGIs over 200k)
Self-employed (Keogh) retirement plans: $33,026 (reported on 2.3% of returns)
46032:
$33,026
Indiana:
$27,160
(% of AGI for various income ranges: 22.7% for AGIs $50k-75k, 67.9% for AGIs $100k-200k, 1117.7% for AGIs over 200k)
Total itemized deductions: $48,201 (reported on 18.1% of returns)
Here:
$48,201
State:
$35,601
(% of AGI for various income ranges: 101.9% for AGIs below $25k, 175.8% for AGIs $25k-50k, 404.2% for AGIs $50k-75k, 676.6% for AGIs $75k-100k, 1279.0% for AGIs $100k-200k, 10612.9% for AGIs over 200k)
Charity contributions: $25,087 (reported on 15.7% of returns)
Here:
$25,087
State:
$15,596
(% of AGI for various income ranges: 8.2% for AGIs below $25k, 21.7% for AGIs $25k-50k, 57.4% for AGIs $50k-75k, 128.6% for AGIs $75k-100k, 338.5% for AGIs $100k-200k, 5815.7% for AGIs over 200k)
Taxes paid: $8,817 (reported on 18.0% of returns)
46032:
$8,817
State:
$7,542
(% of AGI for various income ranges: 14.7% for AGIs below $25k, 27.0% for AGIs $25k-50k, 71.3% for AGIs $50k-75k, 156.6% for AGIs $75k-100k, 360.2% for AGIs $100k-200k, 1683.3% for AGIs over 200k)
Earned income credit: $1,841 (reported on 5.3% of returns)
Here:
$1,841
State:
$2,298
(% of AGI for various income ranges: 42.1% for AGIs below $25k, 33.7% for AGIs $25k-50k)
Percentage of individuals using paid preparers for their 2020 taxes: 93.3%
Here:
93%
State:
94%
(% for various income ranges: 91.3% for AGIs below $25k, 93.6% for AGIs $25k-50k, 93.7% for AGIs $50k-75k, 93.0% for AGIs $75k-100k, 93.2% for AGIs $100k-200k, 95.0% for AGIs over 200k)
Averages for the 2012 tax year for zip code 46032, filed in 2013:
Average Adjusted Gross Income (AGI) in 2012: $145,937 (Individual Income Tax Returns)
Here:
$145,937
State:
$52,932
Salary/wage: $106,116 (reported on 85.4% of returns)
Here:
$106,116
State:
$45,173
(% of AGI for various income ranges: 74.2% for AGIs below $25k, 79.4% for AGIs $25k-50k, 75.7% for AGIs $50k-75k, 76.8% for AGIs $75k-100k, 80.1% for AGIs $100k-200k, 53.0% for AGIs over 200k)
Taxable interest for individuals: $2,877 (reported on 48.3% of returns)
This zip code:
$2,877
Indiana:
$1,311
(% of AGI for various income ranges: 1.9% for AGIs below $25k, 0.9% for AGIs $25k-50k, 0.8% for AGIs $50k-75k, 0.9% for AGIs $75k-100k, 0.7% for AGIs $100k-200k, 1.0% for AGIs over 200k)
Ordinary dividends: $11,876 (reported on 39.8% of returns)
Here:
$11,876
State:
$4,690
(% of AGI for various income ranges: 4.9% for AGIs below $25k, 2.3% for AGIs $25k-50k, 2.6% for AGIs $50k-75k, 2.3% for AGIs $75k-100k, 2.2% for AGIs $100k-200k, 3.7% for AGIs over 200k)
Net capital gain/loss in AGI: +$43,342 (reported on 34.7% of returns)
Here:
+$43,342
State:
+$10,406
(% of AGI for various income ranges: 0.3% for AGIs below $25k, 0.6% for AGIs $25k-50k, 0.9% for AGIs $50k-75k, 1.2% for AGIs $75k-100k, 1.5% for AGIs $100k-200k, 15.3% for AGIs over 200k)
Profit/loss from business: +$25,532 (reported on 16.9% of returns)
Here:
+$25,532
State:
+$11,105
(% of AGI for various income ranges: 7.6% for AGIs below $25k, 4.1% for AGIs $25k-50k, 3.7% for AGIs $50k-75k, 3.1% for AGIs $75k-100k, 3.0% for AGIs $100k-200k, 2.7% for AGIs over 200k)
Taxable individual retirement arrangement distribution: $26,794 (reported on 13.0% of returns)
46032:
$26,794
Indiana:
$13,841
(% of AGI for various income ranges: 4.9% for AGIs below $25k, 3.4% for AGIs $25k-50k, 4.0% for AGIs $50k-75k, 3.7% for AGIs $75k-100k, 3.4% for AGIs $100k-200k, 1.7% for AGIs over 200k)
Self-employment retirement plans: $26,815 (reported on 2.2% of returns)
46032:
$26,815
Indiana:
$21,482
(% of AGI for various income ranges: 0.2% for AGIs $50k-75k, 0.2% for AGIs $100k-200k, 0.5% for AGIs over 200k)
Total itemized deductions: $37,036 (15% of AGI, reported on 50.3% of returns)
Here:
$37,036
State:
$20,913
Here:
14.5% of AGI
State:
18.2% of AGI
(% of AGI for various income ranges: 15.4% for AGIs below $25k, 11.6% for AGIs $25k-50k, 13.8% for AGIs $50k-75k, 15.3% for AGIs $75k-100k, 15.1% for AGIs $100k-200k, 11.8% for AGIs over 200k)
Charity contributions: $8,475 (reported on 44.9% of returns)
Here:
$8,475
State:
$4,697
(% of AGI for various income ranges: 1.1% for AGIs below $25k, 1.3% for AGIs $25k-50k, 1.8% for AGIs $50k-75k, 2.2% for AGIs $75k-100k, 2.4% for AGIs $100k-200k, 2.9% for AGIs over 200k)
Taxes paid: $16,551 (reported on 50.1% of returns)
46032:
$16,551
State:
$7,456
(% of AGI for various income ranges: 2.7% for AGIs below $25k, 2.5% for AGIs $25k-50k, 3.8% for AGIs $50k-75k, 4.8% for AGIs $75k-100k, 5.9% for AGIs $100k-200k, 6.1% for AGIs over 200k)
Earned income credit: $1,818 (reported on 6.5% of returns)
Here:
$1,818
State:
$2,265
(% of AGI for various income ranges: 3.0% for AGIs below $25k, 0.6% for AGIs $25k-50k)
Percentage of individuals using paid preparers for their 2012 taxes: 48.3%
Here:
48%
State:
53%
(% for various income ranges: 41.2% for AGIs below $25k, 41.3% for AGIs $25k-50k, 46.7% for AGIs $50k-75k, 47.1% for AGIs $75k-100k, 48.1% for AGIs $100k-200k, 71.7% for AGIs over 200k)
Averages for the 2004 tax year for zip code 46032, filed in 2005:
Average Adjusted Gross Income (AGI) in 2004: $110,549 (Individual Income Tax Returns)
Here:
$110,549
State:
$44,790
Salary/wage: $85,009 (reported on 84.5% of returns)
Here:
$85,009
State:
$39,615
(% of AGI for various income ranges: 72.1% for AGIs $10k-25k, 79.7% for AGIs $25k-50k, 79.2% for AGIs $50k-75k, 83.8% for AGIs $75k-100k, 59.5% for AGIs over 100k)
Taxable interest for individuals: $3,648 (reported on 61.4% of returns)
This zip code:
$3,648
Indiana:
$1,535
(% of AGI for various income ranges: 3.7% for AGIs $10k-25k, 2.2% for AGIs $25k-50k, 1.9% for AGIs $50k-75k, 1.3% for AGIs $75k-100k, 1.9% for AGIs over 100k)
Taxable dividends: $8,477 (reported on 45.2% of returns)
Here:
$8,477
State:
$2,998
(% of AGI for various income ranges: 3.6% for AGIs $10k-25k, 2.5% for AGIs $25k-50k, 2.1% for AGIs $50k-75k, 1.9% for AGIs $75k-100k, 3.7% for AGIs over 100k)
Net capital gain/loss: +$30,655 (reported on 39.4% of returns)
Here:
+$30,655
State:
+$8,619
(% of AGI for various income ranges: 1.4% for AGIs $10k-25k, 0.8% for AGIs $25k-50k, 1.2% for AGIs $50k-75k, 1.0% for AGIs $75k-100k, 13.6% for AGIs over 100k)
Profit/loss from business: +$25,636 (reported on 16.3% of returns)
Here:
+$25,636
State:
+$10,071
(% of AGI for various income ranges: 6.2% for AGIs $10k-25k, 4.5% for AGIs $25k-50k, 3.7% for AGIs $50k-75k, 4.0% for AGIs $75k-100k, 3.6% for AGIs over 100k)
IRA payment deduction: $3,347 (reported on 3.2% of returns)
46032:
$3,347
Indiana:
$2,840
(% of AGI for various income ranges: 0.3% for AGIs $10k-25k, 0.3% for AGIs $25k-50k, 0.2% for AGIs $50k-75k, 0.2% for AGIs $75k-100k, 0.1% for AGIs over 100k)
Self-employed pension: $22,317 (reported on 2.6% of returns)
Here:
$22,317
Indiana:
$15,305
(% of AGI for various income ranges: 0.2% for AGIs $25k-50k, 0.2% for AGIs $50k-75k, 0.2% for AGIs $75k-100k, 0.6% for AGIs over 100k)
Total itemized deductions: $29,369 (16% of AGI, reported on 52.8% of returns)
Here:
$29,369
State:
$17,065
Here:
15.6% of AGI
State:
19.5% of AGI
(% of AGI for various income ranges: 18.8% for AGIs $10k-25k, 14.4% for AGIs $25k-50k, 18.7% for AGIs $50k-75k, 18.5% for AGIs $75k-100k, 12.8% for AGIs over 100k)
Charity contributions deductions: $6,573 (3% of AGI, reported on 48.5% of returns)
Here:
$6,573
State:
$3,550
Here:
3.3% of AGI
State:
3.8% of AGI
(% of AGI for various income ranges: 1.6% for AGIs $10k-25k, 1.7% for AGIs $25k-50k, 2.2% for AGIs $50k-75k, 2.7% for AGIs $75k-100k, 3.1% for AGIs over 100k)
Total tax: $25,539 (reported on 81.5% of returns)
46032:
$25,539
State:
$6,914
(% of AGI for various income ranges: 5.0% for AGIs $10k-25k, 8.1% for AGIs $25k-50k, 9.5% for AGIs $50k-75k, 10.2% for AGIs $75k-100k, 21.4% for AGIs over 100k)
Earned income credit: $1,411 (reported on 4.3% of returns)
Here:
$1,411
State:
$1,685
Percentage of individuals using paid preparers for their 2004 taxes: 50.9%
Here:
51%
State:
59%
(% for various income ranges: 45.6% for AGIs below $10k, 49.3% for AGIs $10k-25k, 46.4% for AGIs $25k-50k, 49.5% for AGIs $50k-75k, 47.5% for AGIs $75k-100k, 59.9% for AGIs over 100k)
Likely homosexual households (counted as self-reported same-sex unmarried-partner households)
Lesbian couples: 0.2% of all households
Gay men: 0.0% of all households
Household received Food Stamps/SNAP in the past 12 months: 332 Household did not receive Food Stamps/SNAP in the past 12 months: 20,574
Women who had a birth in the past 12 months: 619 (670 now married, 0 unmarried) Women who did not have a birth in the past 12 months: 12,044 (5,877 now married, 6,178 unmarried)
Housing units in zip code 46032 with a mortgage: 9,774 (1,256 second mortgage, 56 home equity loan, 1,132 both second mortgage and home equity loan) Houses without a mortgage: 247
Median monthly owner costs for units with a mortgage: $2,234 Median monthly owner costs for units without a mortgage: $756
Residents with income below the poverty level in 2022:
This zip code:
4.2%
Whole state:
12.6%
Residents with income below 50% of the poverty level in 2022:
This zip code:
1.2%
Whole state:
6.3%
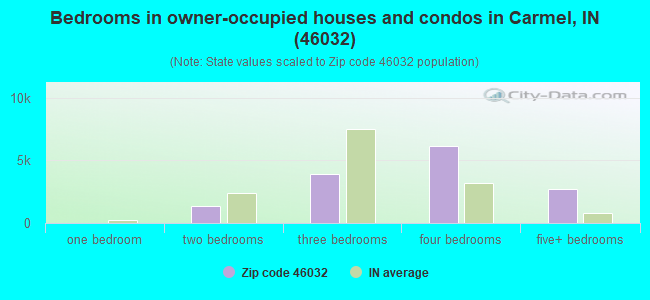
Median number of rooms in houses and condos:
Here:
8.5
State:
6.6
Median number of rooms in apartments:
Here:
3.9
State:
4.3
Notable locations in this zip code not listed on our city pages
Notable locations in zip code 46032: Mohawk Hills Golf Course (A), Woodland Country Club (B), Carmel Executive Office Park (C), Meridian Technology Center (D), Fidelity Plaza Business Park (E), Crooked Stick Golf Course (F), Twin Lakes Golf Course (G), Mayflower Business Park (H), Carmel City Hall (I), Carmel Fire Department Station 41 Headquarters (J), Fire Station 42 (K), Carmel Fire Department Station 46 (L), Carmel Performing Arts Center (M), Carmel Public Library (N), Carmel Fire Department (O), Carmel Fire Department Station 42 (P). Display/hide their locations on the map
Shopping Centers: Marsh Plaza Shopping Center (1), Merchant Square Shopping Center (2), Carmel Walk Shopping Center (3), The Center Shopping Center (4), Carmel Plaza Shopping Center (5), Mohawk Place Shopping Center (6), Greyhound Plaza Shopping Center (7), Meridian Village Plaza Shopping Center (8), Carmel Shopping Center (9). Display/hide their locations on the map
Churches in zip code 46032 include: Bethlehem Lutheran Church (A), Carmel Apostolic Church (B), Carmel Assembly of God Church (C), Carmel Friends Church (D), Fellowship In Christ Church (E), King of Glory Lutheran Church (F), New Hope Korean Baptist Church (G), New Life Community Church (H), Church of Jesus Christ of Latter Day Saints (I). Display/hide their locations on the map
Streams, rivers, and creeks: Will Creek (A), Little Cool Creek (B), Hiway Run (C), Henley Creek (D), Elliot Creek (E), Clay Creek (F), Center Creek (G), Witt Creek (H), Ams Run (I). Display/hide their locations on the map
Parks in zip code 46032 include: Carmel Ice Skadium (1), Carmel/Clay Community Soccer Complex (2), Meadow Lawn Park (3). Display/hide their locations on the map
10,389 married couples with children.
1,966 single-parent households (128 men, 1,838 women).
85.2% of residents of 46032 zip code speak English at home.
2.8% of residents speak Spanish at home (64% very well, 19% well, 13% not well, 5% not at all).
6.7% of residents speak other Indo-European language at home (78% very well, 15% well, 6% not well, 1% not at all).
4.0% of residents speak Asian or Pacific Island language at home (64% very well, 24% well, 11% not well, 1% not at all).
1.6% of residents speak other language at home (77% very well, 15% well, 3% not well, 6% not at all).
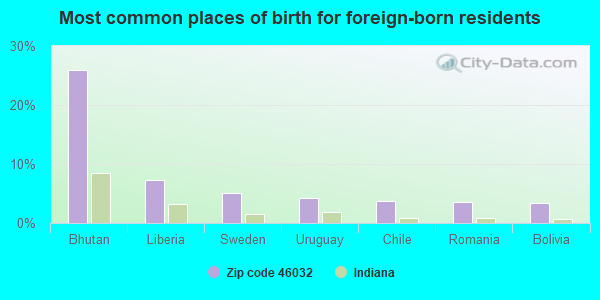
Foreign born population: 7,200 (13.9%) (60.3% of them are naturalized citizens)
Major facilities with environmental interests located in this zip code:
SEPRO CORP (11550 NORTH MERIDIAN STREET, STE. 200 in CARMEL,, IN)
FORMAL ENFORCEMENT ACTION (Integrated Compliance Information System) - ICIS-05-2006-0007, ENFORCEMENT/COMPLIANCE ACTIVITY COMPLIANCE ACTIVITY (Tracking inspections of insecticide, fungicide, and rodenticide, and toxic substances) STATE MASTER (New Jersey environmental info) - NJEMS-002309, PESTICIDES - MANUFACTURE, NJEMS-003612, Business SIC classification: PESTICIDES AND AGRICULTURAL CHEMICALS Organizations: STEWART Alternative names: SE PRO CORPORATION
CARMEL HIGH SCHOOL (520 E MAIN ST in CARMEL, IN)
STATE MASTER (Indiana facility tracking) - CRTK-8622, EPCRA, LUST-199503550, LEAKING STORAGE TANK, UST-9270, UNDERGROUND STORAGE TANK PROGRAM (National Center for Education Statistics) - STATE ID-2505 Conditionally Exempt Small Quantity Generators, less than 100 kg/month of hazardous waste (Resource Conservation and Recovery Act (tracking hazardous waste)) - notification Organizations: CARMEL CLAY SCHOOLS (CONTACT/OWNER)
REEDER AND KLINE MACHINE CO INC (340 FIRST AVE S W in CARMEL, IN)
STATE MASTER (Indiana facility tracking) - UST-22300, UNDERGROUND STORAGE TANK PROGRAM National Pollutant Discharge Elimination System NON-MAJOR (Tracking pollutant discharge elimination systems) - permit (Resource Conservation and Recovery Act (tracking hazardous waste)) Business SIC classification: AIRCRAFT ENGINES AND ENGINE PARTS Organizations: CERTIFIED OPERATOR (CONTACT/OPERATOR)
, REEDER & KLINE MACHINE CO INC (CONTACT/OWNER)
AMOCO SERVICE STATION 20270 (110 S RANGELINE RD in CARMEL, IN)
STATE MASTER (Indiana facility tracking) - CRTK-4349, EPCRA, LUST-198911072, LEAKING STORAGE TANK, UST-1122, UNDERGROUND STORAGE TANK PROGRAM National Pollutant Discharge Elimination System NON-MAJOR (Tracking pollutant discharge elimination systems) - permit (Resource Conservation and Recovery Act (tracking hazardous waste)) Business SIC classification: GASOLINE SERVICE STATIONS Organizations: GARY PRANGE (CONTACT/OPERATOR)
, AMOCO OIL CO (CONTACT/OWNER)
, BP PRODUCTS NORTH AMERICA INC (CONTACT/OWNER)
Alternative names: AMOCO OIL CO 20270, AMOCO OIL COMPANY, ST. #20270, AMOCO STATION #20270
CARMEL JUNIOR HIGH SCHOOL (300 S GUILFORD in CARMEL, IN)
(Geographic Names Information System) STATE MASTER (Indiana facility tracking) - CRTK-8623, EPCRA, UST-9272, UNDERGROUND STORAGE TANK PROGRAM (National Center for Education Statistics) - STATE ID-2511 Organizations: CARMEL CLAY SCHOOLS (SCHOOL DISTRICT)
COLLEGE WOOD ELEMENTARY SCHOOL (400 S GUILFORD RD in CARMEL, IN)
(Geographic Names Information System) STATE MASTER (Indiana facility tracking) - CRTK-8628, EPCRA (National Center for Education Statistics) - STATE ID-2510 Organizations: CARMEL CLAY SCHOOLS (SCHOOL DISTRICT)
CLAY JUNIOR HIGH SCHOOL (5150 W 126TH ST in CARMEL, IN)
STATE MASTER (Indiana facility tracking) - CRTK-8624, EPCRA (National Center for Education Statistics) - STATE ID-2506 Organizations: CARMEL CLAY SCHOOLS (SCHOOL DISTRICT)
CARMEL ELEMENTARY SCHOOL (101 4TH AVE SE in CARMEL, IN)
STATE MASTER (Indiana facility tracking) - CRTK-8626, EPCRA (National Center for Education Statistics) - STATE ID-2509 Organizations: CARMEL CLAY SCHOOLS (SCHOOL DISTRICT)
RESORT CONDIMINIUMS INTERNATIONAL (9998 N MICHIGAN RD in CARMEL, IN)
AIR MINOR (AIRS/AFS) STATE MASTER (Indiana facility tracking) - UST-5551, UNDERGROUND STORAGE TANK PROGRAM, ACES-CP-05700029, AIR PROGRAM, ACES-CP-2091, ACES-OP-05700029, CRTK-4214, EPCRA, LUST-199307142, LEAKING STORAGE TANK, LUST-199609067, LUST-199708167, (Resource Conservation and Recovery Act (tracking hazardous waste)) Business SIC classification: NONCLASSIFIABLE ESTABLISHMENTS Organizations: MAYFLOWER TRANSIT INC (CONTACT/OWNER)
Alternative names: MAYFLOWER TRANSIT INC
PARTY TIME RENTAL, INC. (1212 RANGE LINE RD in CARMEL, IN)
STATE MASTER (Indiana facility tracking) - UST-741, UNDERGROUND STORAGE TANK PROGRAM, CRTK-4242, EPCRA, LUST-199212516, LEAKING STORAGE TANK (Resource Conservation and Recovery Act (tracking hazardous waste)) Organizations: WADDELL R F (CONTACT/OWNER)
Alternative names: STANDARD LOCKNUT AND LOCKWASHER
GRADLE JOHN PROPERTY (904 THIRD AVE S W in CARMEL, IN)
STATE MASTER (Indiana facility tracking) - CRTK-569, EPCRA (Resource Conservation and Recovery Act (tracking hazardous waste)) Organizations: ROTATION PRODUCTS CORP (CONTACT/OWNER)
Alternative names: ROTATION PRODUCTS CORP
BUTLER TOYOTA BODY SHOP INC (931 N RANGELINE RD in CARMEL, IN)
STATE MASTER (Indiana facility tracking) - CRTK-976, EPCRA Conditionally Exempt Small Quantity Generators, less than 100 kg/month of hazardous waste (Resource Conservation and Recovery Act (tracking hazardous waste)) - notification Organizations: BUTLER ROBERT G (CONTACT/OWNER)
CINERGY PSI CARMEL OFFICE (1441 S GUILFORD RD in CARMEL, IN)
STATE MASTER (Indiana facility tracking) - UST-10374, UNDERGROUND STORAGE TANK PROGRAM, CRTK-1297, EPCRA, LUST-198909095, LEAKING STORAGE TANK, SPILL-198909095, RELEASE ASSESSMENT Conditionally Exempt Small Quantity Generators, less than 100 kg/month of hazardous waste (Resource Conservation and Recovery Act (tracking hazardous waste)) - notification Organizations: PSI ENERGY (CONTACT/OWNER)
Alternative names: PSI ENERGY CARMEL OFFICE
Housing units lacking complete plumbing facilities: 0.3% Housing units lacking complete kitchen facilities: 1.4%
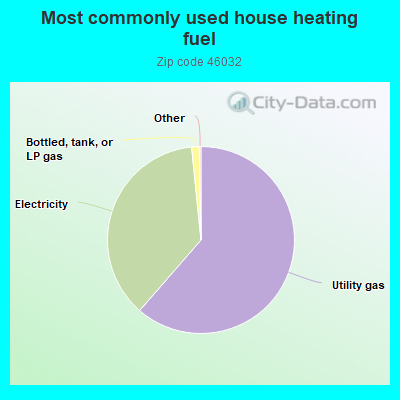
61.4%Utility gas
37.0%Electricity
1.3%Bottled, tank, or LP gas
Population in 1990: 40,090.
Place of birth for U.S.-born residents:
This state: 25,966
Northeast: 3,023
Midwest: 8,642
South: 4,398
West: 2,350
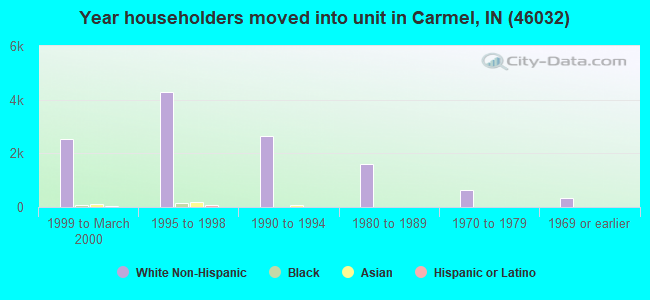
46% of the 46032 zip code residents lived in the same house 5 years ago. Out of people who lived in different houses, 29% lived in this county. Out of people who lived in different counties, 50% lived in Indiana.
86% of the 46032 zip code residents lived in the same house 1 year ago. Out of people who lived in different houses, 38% moved from this county. Out of people who lived in different houses, 34% moved from different county within same state. Out of people who lived in different houses, 22% moved from different state. Out of people who lived in different houses, 6% moved from abroad.
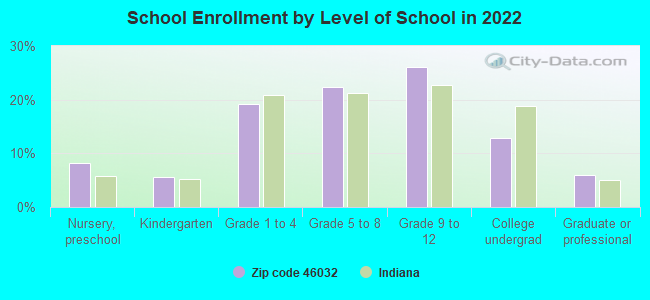
Private vs. public school enrollment:
Students in private schools in grades 1 to 8 (elementary and middle school): 1,382
Here:
24.9%
Indiana:
14.9%
Students in private schools in grades 9 to 12 (high school): 876
Here:
25.2%
Indiana:
11.4%
Students in private undergraduate colleges: 482
Here:
28.2%
Indiana:
22.3%
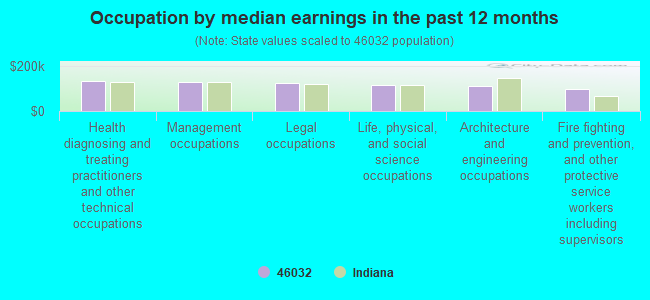
Occupation by median earnings in the past 12 months ($)
132,253Health diagnosing and treating practitioners and other technical occupations
130,016Management occupations
124,966Legal occupations
117,516Life, physical, and social science occupations
112,927Architecture and engineering occupations
99,841Fire fighting and prevention, and other protective service workers including supervisors
Companies with biggest federal contracts located in this zip code (CARMEL, IN):
RYAN CONSULTING GROUP (361 RIDGE POINT DR; small business) : $2,518,343 in 10 contractsfrom 2004 to 2006
Contracts for ADP Data Entry Services, Programming Services, ADP Systems Development Services by U.S. Customs Service, Defense Finance and Accounting Service Signed by year:2000: $0; 2001: $0; 2002: $0; 2003: $0; 2004: $950,202; 2005: $1,481,880; 2006: $86,261.
Biggest contracts:
$865,118 with U.S. Customs Service for ADP Data Entry Services. Signed on 2005-09-30. Completion date: 2006-09-29.
$620,202 with Defense Finance and Accounting Service for Programming Services. Signed on 2004-10-01. Completion date: 2005-09-30.
$620,202, same as above.Signed on 2004-10-01. Completion date: 2005-09-30.
$422,244, same as above.Signed on 2005-12-05. Completion date: 2006-02-28.
MODULAR DEVICES, INC (503 W CARMEL DR; small business) : $1,747,500 in 15 contractsfrom 2000 to 2006
Contracts for Medical and Surgical Instruments, Equipment, and Supplies, X-Ray Equipment and Supplies: Medical, Dental, Veterinary, Lease or Rental of Equipment -- Medical, Dental, and Veterinary Equipment and Supplies, Lease or Rental of Equipment -- Miscellaneous, and moreby Department of Veterans Affairs, Army Signed by year:2000: $133,000; 2001: $0; 2002: $0; 2003: $84,000; 2004: $423,000; 2005: $661,000; 2006: $446,500.
Biggest contracts:
$332,500 with Department of Veterans Affairs for Medical and Surgical Instruments, Equipment, and Supplies. Taking place in CA. Signed on 2006-01-17. Completion date: 2006-11-24.
$230,000 with Army for Medical and Surgical Instruments, Equipment, and Supplies. Taking place in HI. Signed on 2005-09-26. Completion date: 2006-05-31.
$210,000 with Department of Veterans Affairs for X-Ray Equipment and Supplies: Medical, Dental, Veterinary. Taking place in CA. Signed on 2004-09-27. Effective on 2004-09-29. Completion date: 2005-02-28.
$176,000 with Department of Veterans Affairs for Lease or Rental of Equipment -- Medical, Dental, and Veterinary Equipment and Supplies. Taking place in OK. Signed on 2004-10-01. Completion date: 2005-09-30.
SOFTWARE ENGINEERING PROFESSIO (11611 N MERIDIAN ST , SUI; small business) : $463,539 in 4 contractsfrom 2000 to 2005
$291,685 with Navy for Maintenance, Repair and Rebuilding of Equipment -- Miscellaneous. Signed on 2000-09-25. Completion date: 2001-08-03.
$97,130, same as above.Signed on 2001-08-29. Completion date: 2001-11-30.
$40,224 with Navy for Data Analyses (other than scientific). Signed on 2004-08-26. Completion date: 2004-10-13.
$34,500 with Navy for Program Evaluation Services. Signed on 2005-02-28. Completion date: 2005-04-21.
SEPRO CORPORATION (11550 N MERIDIAN STREET,; small business) : $393,200 in 4 contractsin 2001
$385,700 with U.S. Army Corps of Engineers - civil program financing only for Chemicals. Signed on 2001-03-05. Completion date: 2001-04-30.
$8,450 with U.S. Army Corps of Engineers - civil program financing only for Other Professional Services. Signed on 2001-05-09. Completion date: 2001-05-18.
-$300, same as above.Signed on 2001-09-25. Completion date: 2001-05-18.
-$650, same as above.Signed on 2001-05-14. Completion date: 2001-05-18.
CAE-NAT COM, INC (1033 3RD AVE SW; small business)
$100,000 with Missile Defense Agency for Defense Missile and Space Systems -- Basic Research (R&D). Signed on 2006-05-18. Completion date: 2006-11-18.
WRS, LTD (510 WEST CARMEL DRIVE; small business)
$55,000 with Army for Office Information System Equipment. Signed on 2001-09-06. Completion date: 2001-10-06.
REEDER & KLINE MACHINE CO INC (340 1ST AVE SW; small business)
$48,415 with Air Force for Bearings, Antifriction, Unmounted. Taking place in OH. Signed on 2002-09-10. Completion date: 2002-12-17.
DUNCAN VIDEO INC (702 ADAMS STREET; small business) : $33,590 in 2 contractsin 2004
$27,678 with Navy for Photographic Equipment and Accessories. Signed on 2004-08-18. Completion date: 2004-08-30.
$5,912 with Army for Photographic Equipment and Accessories. Signed on 2004-02-25. Completion date: 2004-03-26.
SEGWAY OF INDIANA LLC (625 3RD AVE SW; small business)
$10,000 with Navy for Surface Use Explosive Ordnance Disposal Tools and Equipment. Signed on 2005-08-26. Completion date: 2005-08-31.
KELTNER & ASSOCIATES, INC (520 W CARMEL DR; small business)
$9,936 with Army for Miscellaneous Items. Signed on 2004-05-18. Completion date: 2004-06-20.
Top industries in this zip code by the number of employees in 2005:
Administrative and Support and Waste Management and Remediation Services: All Other Travel Arrangement and Reservation Services (500-999: 1, 10-19: 1, 5-9: 2)
Health Care and Social Assistance: General Medical and Surgical Hospitals (500-999: 1)
Utilities: Electric Bulk Power Transmission and Control (500-999: 1)
People in group quarters in 2010:
438 people in nursing facilities/skilled-nursing facilities
10 people in residential treatment centers for juveniles (non-correctional)
6 people in other noninstitutional facilities
People in group quarters in 2000:
420 people in nursing homes
31 people in mental (psychiatric) hospitals or wards
Fatal accident statistics in 2012:
Fatal accident count: 1
Vehicles involved in fatal accidents: 2
Fatal accidents caused by drunken drivers: 0
Fatalities: 2
Persons involved in fatal accidents: 2
Pedestrians involved in fatal accidents: 0
Fatal accident statistics in 2011:
Fatal accident count: 1
Vehicles involved in fatal accidents: 2
Fatal accidents caused by drunken drivers: 0
Fatalities: 1
Persons involved in fatal accidents: 2
Pedestrians involved in fatal accidents: 0
Home Mortgage Disclosure Act Aggregated Statistics For Year 2009 (Based on 1 full and 10 partial tracts)
A) FHA, FSA/RHS & VA Home Purchase Loans
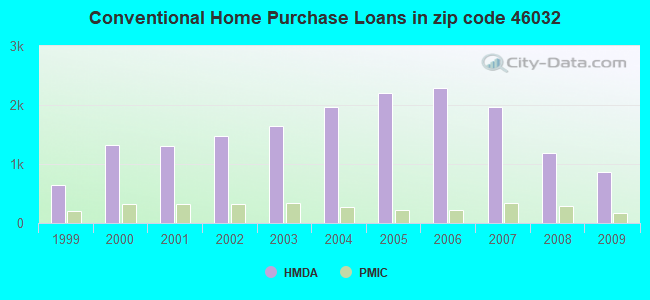
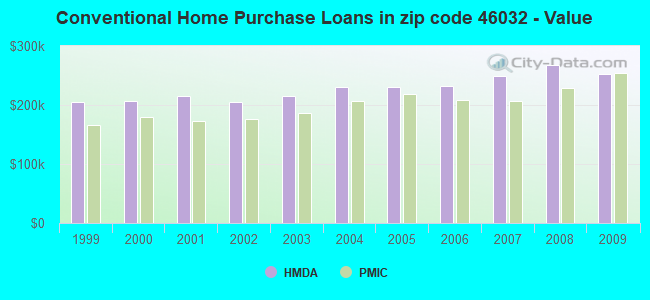
B) Conventional Home Purchase Loans
C) Refinancings
D) Home Improvement Loans
E) Loans on Dwellings For 5+ Families
F) Non-occupant Loans on < 5 Family Dwellings (A B C & D)
G) Loans On Manufactured Home Dwelling (A B C & D)
Number
Average Value
Number
Average Value
Number
Average Value
Number
Average Value
Number
Average Value
Number
Average Value
Number
Average Value
LOANS ORIGINATED
307
$180,697
870
$252,225
3,760
$248,693
46
$123,326
6
$2,411,987
86
$166,610
5
$231,748
APPLICATIONS APPROVED, NOT ACCEPTED
8
$161,056
83
$300,653
243
$257,482
17
$74,849
0
$0
4
$235,020
0
$0
APPLICATIONS DENIED
33
$150,092
99
$275,527
707
$278,541
34
$76,181
0
$0
35
$148,374
3
$42,850
APPLICATIONS WITHDRAWN
33
$159,129
86
$283,096
542
$249,117
16
$181,298
0
$0
24
$178,626
0
$0
FILES CLOSED FOR INCOMPLETENESS
5
$166,580
11
$365,859
106
$283,121
4
$48,388
0
$0
6
$202,357
0
$0
Aggregated Statistics For Year 2008 (Based on 1 full and 10 partial tracts)
A) FHA, FSA/RHS & VA Home Purchase Loans
B) Conventional Home Purchase Loans
C) Refinancings
D) Home Improvement Loans
E) Loans on Dwellings For 5+ Families
F) Non-occupant Loans on < 5 Family Dwellings (A B C & D)
G) Loans On Manufactured Home Dwelling (A B C & D)
Number
Average Value
Number
Average Value
Number
Average Value
Number
Average Value
Number
Average Value
Number
Average Value
Number
Average Value
LOANS ORIGINATED
160
$167,685
1,188
$268,309
1,411
$258,590
104
$168,215
2
$6,820,000
118
$170,483
5
$37,422
APPLICATIONS APPROVED, NOT ACCEPTED
14
$165,035
104
$293,503
162
$242,943
23
$98,133
0
$0
7
$196,509
2
$44,340
APPLICATIONS DENIED
32
$160,246
140
$346,413
427
$259,235
75
$93,763
0
$0
33
$220,248
5
$50,684
APPLICATIONS WITHDRAWN
22
$174,650
129
$325,999
259
$273,360
14
$191,020
0
$0
7
$171,533
0
$0
FILES CLOSED FOR INCOMPLETENESS
3
$186,470
29
$319,060
61
$230,501
4
$137,000
0
$0
6
$144,705
0
$0
Aggregated Statistics For Year 2007 (Based on 1 full and 10 partial tracts)
A) FHA, FSA/RHS & VA Home Purchase Loans
B) Conventional Home Purchase Loans
C) Refinancings
D) Home Improvement Loans
E) Loans on Dwellings For 5+ Families
F) Non-occupant Loans on < 5 Family Dwellings (A B C & D)
G) Loans On Manufactured Home Dwelling (A B C & D)
Number
Average Value
Number
Average Value
Number
Average Value
Number
Average Value
Number
Average Value
Number
Average Value
Number
Average Value
LOANS ORIGINATED
38
$158,811
1,963
$248,693
1,164
$238,944
167
$83,992
6
$6,065,930
179
$179,190
6
$58,758
APPLICATIONS APPROVED, NOT ACCEPTED
5
$233,522
183
$238,738
191
$221,254
34
$64,489
0
$0
17
$196,609
2
$20,980
APPLICATIONS DENIED
16
$151,689
197
$297,168
561
$239,756
102
$101,790
1
$11,811,780
55
$135,615
5
$38,004
APPLICATIONS WITHDRAWN
5
$157,058
197
$224,790
211
$245,405
17
$101,088
0
$0
22
$195,583
1
$30,620
FILES CLOSED FOR INCOMPLETENESS
2
$74,600
40
$209,564
96
$279,569
10
$245,347
0
$0
7
$208,596
0
$0
Aggregated Statistics For Year 2006 (Based on 1 full and 10 partial tracts)
A) FHA, FSA/RHS & VA Home Purchase Loans
B) Conventional Home Purchase Loans
C) Refinancings
D) Home Improvement Loans
E) Loans on Dwellings For 5+ Families
F) Non-occupant Loans on < 5 Family Dwellings (A B C & D)
G) Loans On Manufactured Home Dwelling (A B C & D)
Number
Average Value
Number
Average Value
Number
Average Value
Number
Average Value
Number
Average Value
Number
Average Value
Number
Average Value
LOANS ORIGINATED
57
$149,167
2,293
$232,535
1,080
$228,987
180
$100,907
3
$19,802,247
292
$156,474
2
$41,280
APPLICATIONS APPROVED, NOT ACCEPTED
1
$111,360
212
$268,972
203
$203,031
32
$48,157
0
$0
26
$119,809
5
$44,162
APPLICATIONS DENIED
10
$167,538
315
$296,079
553
$204,357
74
$127,418
0
$0
103
$201,572
2
$37,480
APPLICATIONS WITHDRAWN
5
$159,128
263
$267,081
337
$231,751
22
$94,673
0
$0
60
$195,082
0
$0
FILES CLOSED FOR INCOMPLETENESS
5
$174,302
64
$214,443
122
$243,255
3
$106,590
0
$0
11
$139,869
0
$0
Aggregated Statistics For Year 2005 (Based on 1 full and 10 partial tracts)
A) FHA, FSA/RHS & VA Home Purchase Loans
B) Conventional Home Purchase Loans
C) Refinancings
D) Home Improvement Loans
E) Loans on Dwellings For 5+ Families
F) Non-occupant Loans on < 5 Family Dwellings (A B C & D)
G) Loans On Manufactured Home Dwelling (A B C & D)
Number
Average Value
Number
Average Value
Number
Average Value
Number
Average Value
Number
Average Value
Number
Average Value
Number
Average Value
LOANS ORIGINATED
63
$145,679
2,208
$230,183
1,640
$238,565
174
$84,934
3
$7,270,160
254
$147,005
3
$78,760
APPLICATIONS APPROVED, NOT ACCEPTED
5
$139,158
216
$250,197
174
$166,050
26
$80,284
0
$0
28
$187,941
3
$39,140
APPLICATIONS DENIED
12
$149,672
313
$211,600
560
$207,553
97
$74,599
0
$0
93
$184,948
4
$24,398
APPLICATIONS WITHDRAWN
5
$150,726
257
$223,967
346
$221,683
45
$165,887
0
$0
45
$176,465
2
$218,465
FILES CLOSED FOR INCOMPLETENESS
0
$0
56
$206,277
203
$229,929
7
$34,200
0
$0
9
$108,200
1
$452,120
Aggregated Statistics For Year 2004 (Based on 1 full and 10 partial tracts)
A) FHA, FSA/RHS & VA Home Purchase Loans
B) Conventional Home Purchase Loans
C) Refinancings
D) Home Improvement Loans
F) Non-occupant Loans on < 5 Family Dwellings (A B C & D)
G) Loans On Manufactured Home Dwelling (A B C & D)
Number
Average Value
Number
Average Value
Number
Average Value
Number
Average Value
Number
Average Value
Number
Average Value
LOANS ORIGINATED
71
$129,863
1,963
$231,277
1,886
$220,606
129
$72,321
178
$146,643
0
$0
APPLICATIONS APPROVED, NOT ACCEPTED
5
$119,932
165
$239,963
221
$213,770
30
$94,932
25
$156,545
2
$38,895
APPLICATIONS DENIED
15
$134,805
197
$207,665
542
$194,519
103
$51,160
37
$154,228
6
$45,185
APPLICATIONS WITHDRAWN
7
$121,166
182
$194,319
295
$173,650
32
$93,688
18
$174,873
0
$0
FILES CLOSED FOR INCOMPLETENESS
3
$117,970
57
$220,510
141
$206,243
6
$26,688
12
$131,455
0
$0
Aggregated Statistics For Year 2003 (Based on 1 full and 10 partial tracts)
A) FHA, FSA/RHS & VA Home Purchase Loans
B) Conventional Home Purchase Loans
C) Refinancings
D) Home Improvement Loans
E) Loans on Dwellings For 5+ Families
F) Non-occupant Loans on < 5 Family Dwellings (A B C & D)
Number
Average Value
Number
Average Value
Number
Average Value
Number
Average Value
Number
Average Value
Number
Average Value
LOANS ORIGINATED
153
$132,388
1,641
$214,654
5,511
$208,515
87
$35,298
1
$3,556,190
258
$125,417
APPLICATIONS APPROVED, NOT ACCEPTED
18
$128,035
152
$230,750
463
$204,047
21
$15,642
0
$0
29
$153,138
APPLICATIONS DENIED
16
$120,550
100
$230,667
660
$187,604
63
$40,231
0
$0
38
$132,876
APPLICATIONS WITHDRAWN
8
$116,174
147
$240,235
492
$191,876
7
$24,510
0
$0
27
$200,823
FILES CLOSED FOR INCOMPLETENESS
3
$175,503
45
$280,191
130
$226,048
6
$53,085
0
$0
8
$100,544
Aggregated Statistics For Year 2002 (Based on 1 full and 10 partial tracts)
A) FHA, FSA/RHS & VA Home Purchase Loans
B) Conventional Home Purchase Loans
C) Refinancings
D) Home Improvement Loans
E) Loans on Dwellings For 5+ Families
F) Non-occupant Loans on < 5 Family Dwellings (A B C & D)
Number
Average Value
Number
Average Value
Number
Average Value
Number
Average Value
Number
Average Value
Number
Average Value
LOANS ORIGINATED
180
$127,982
1,467
$204,950
4,101
$211,107
78
$46,753
2
$484,675
179
$124,085
APPLICATIONS APPROVED, NOT ACCEPTED
10
$125,931
104
$170,287
383
$186,152
34
$42,357
0
$0
16
$169,456
APPLICATIONS DENIED
14
$123,506
82
$189,318
474
$180,922
50
$24,861
0
$0
19
$147,561
APPLICATIONS WITHDRAWN
8
$123,570
89
$240,378
310
$208,768
6
$23,193
0
$0
19
$178,791
FILES CLOSED FOR INCOMPLETENESS
6
$92,505
29
$195,243
186
$182,334
6
$53,090
0
$0
6
$92,523
Aggregated Statistics For Year 2001 (Based on 1 full and 10 partial tracts)
A) FHA, FSA/RHS & VA Home Purchase Loans
B) Conventional Home Purchase Loans
C) Refinancings
D) Home Improvement Loans
F) Non-occupant Loans on < 5 Family Dwellings (A B C & D)
Number
Average Value
Number
Average Value
Number
Average Value
Number
Average Value
Number
Average Value
LOANS ORIGINATED
238
$127,298
1,298
$215,458
2,763
$190,645
158
$72,387
106
$176,310
APPLICATIONS APPROVED, NOT ACCEPTED
15
$138,205
113
$203,292
255
$134,612
65
$22,317
16
$137,938
APPLICATIONS DENIED
13
$124,345
89
$226,854
449
$159,373
61
$21,849
22
$79,148
APPLICATIONS WITHDRAWN
10
$160,607
80
$275,316
265
$158,707
12
$99,366
10
$118,976
FILES CLOSED FOR INCOMPLETENESS
4
$109,390
25
$192,075
135
$196,533
7
$33,779
5
$92,030
Aggregated Statistics For Year 2000 (Based on 1 full and 10 partial tracts)
A) FHA, FSA/RHS & VA Home Purchase Loans
B) Conventional Home Purchase Loans
C) Refinancings
D) Home Improvement Loans
F) Non-occupant Loans on < 5 Family Dwellings (A B C & D)
Number
Average Value
Number
Average Value
Number
Average Value
Number
Average Value
Number
Average Value
LOANS ORIGINATED
120
$118,410
1,322
$207,454
561
$184,115
196
$30,575
70
$165,230
APPLICATIONS APPROVED, NOT ACCEPTED
12
$116,579
99
$189,036
105
$95,479
58
$25,220
4
$169,110
APPLICATIONS DENIED
8
$90,636
104
$138,882
248
$128,477
88
$30,525
15
$121,126
APPLICATIONS WITHDRAWN
4
$135,925
101
$214,805
105
$110,951
26
$102,911
16
$110,025
FILES CLOSED FOR INCOMPLETENESS
2
$99,025
15
$121,607
48
$180,601
3
$25,960
2
$90,235
Aggregated Statistics For Year 1999 (Based on 1 full and 4 partial tracts)
A) FHA, FSA/RHS & VA Home Purchase Loans
B) Conventional Home Purchase Loans
C) Refinancings
D) Home Improvement Loans
F) Non-occupant Loans on < 5 Family Dwellings (A B C & D)
2002 - 2018 National Fire Incident Reporting System (NFIRS) incidents
Based on the data from the years 2002 - 2018 the average number of fires per year is 55. The highest number of fires - 120 took place in 2012, and the least - 6 in 2015. The data has a rising trend.
When looking into fire subcategories, the most reports belonged to: Outside Fires (50.3%), and Structure Fires (30.2%).
Fire incident types reported to NFIRS in Zip Code 46032


 Nearest zip codes: 46290, 46280, 46260, 46074, 46240, 46268.


 Based on the data from the years 2002 - 2018 the average number of fires per year is 55. The highest number of fires - 120 took place in 2012, and the least - 6 in 2015. The data has a rising trend.
 When looking into fire subcategories, the most reports belonged to: Outside Fires (50.3%), and Structure Fires (30.2%).