Estimated zip code population in 2022: 1,167 Zip code population in 2010: 1,078 Zip code population in 2000: 1,152
Houses and condos: 496 Renter-occupied apartments: 80
% of renters here:
18%
State:
29%
March 2022 cost of living index in zip code 47921: 85.5 (less than average, U.S. average is 100)
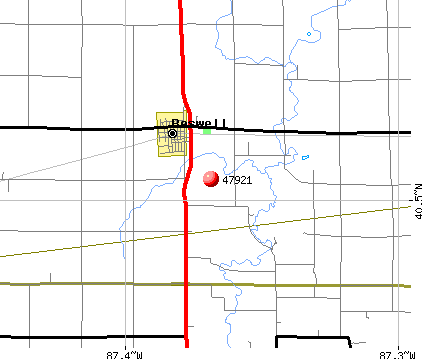
Land area: 41.0 sq. mi. Water area: 0.0 sq. mi.
Population density: 28 people per square mile
(very low).
OSM Map
General Map
Google Map
MSN Map
OSM Map
General Map
Google Map
MSN Map
OSM Map
General Map
Google Map
MSN Map
OSM Map
General Map
Google Map
MSN Map
Please wait while loading the map...
Real estate property taxes paid for housing units in 2022:
This zip code:
0.5% ($929)
Indiana:
0.7% ($1,467)
Median real estate property taxes paid for housing units with mortgages in 2022: $1,099 (0.4%) Median real estate property taxes paid for housing units with no mortgage in 2022: $501 (0.6%)
Business Search- 14 Million verified businesses
Males: 670
(57.4%)
Females: 497
(42.6%)
For population 25 years and over in 47921:
High school or higher: 87.8%
Bachelor's degree or higher: 19.5%
Graduate or professional degree: 4.5%
Unemployed: 1.0%
Mean travel time to work (commute): 31.0 minutes
For population 15 years and over in 47921:
Never married: 28.8%
Now married: 48.7%
Separated: 1.1%
Widowed: 4.1%
Divorced: 17.3%
Zip code 47921 compared to state average:
Unemployed percentage significantly below state average.
Black race population percentage significantly below state average.
Hispanic race population percentage above state average.
Renting percentage below state average.
Length of stay since moving in significantly above state average.
House age above state average.
Percentage of population with a bachelor's degree or higher below state average.
Estimated median house/condo value in 2022: $188,239
47921:
$188,239
Indiana:
$208,700
Median resident age:
This zip code:
36.3 years
Indiana median age:
38.2 years
Average household size:
This zip code:
2.6 people
Indiana:
2.4 people
Averages for the 2020 tax year for zip code 47921, filed in 2021:
Average Adjusted Gross Income (AGI) in 2020: $50,729 (Individual Income Tax Returns)
Here:
$50,729
State:
$64,978
Salary/wage: $44,795 (reported on 79.6% of returns)
Here:
$44,795
State:
$55,245
(% of AGI for various income ranges: 1246.2% for AGIs below $25k, 4082.5% for AGIs $25k-50k, 8148.0% for AGIs $50k-75k, 8786.7% for AGIs $75k-100k, 24320.0% for AGIs $100k-200k)
Taxable interest for individuals: $282 (reported on 22.4% of returns)
This zip code:
$282
Indiana:
$1,351
(% of AGI for various income ranges: 5.0% for AGIs below $25k, 7.5% for AGIs $25k-50k, 14.0% for AGIs $50k-75k, 55.0% for AGIs $100k-200k)
Ordinary dividends: $3,350 (reported on 8.2% of returns)
Here:
$3,350
State:
$5,827
(% of AGI for various income ranges: 22.5% for AGIs below $25k, 386.7% for AGIs $75k-100k)
Net capital gain/loss in AGI: +$2,675 (reported on 8.2% of returns)
Here:
+$2,675
State:
+$17,730
(% of AGI for various income ranges: 356.7% for AGIs $75k-100k)
Profit/loss from business: +$6,750 (reported on 12.2% of returns)
Here:
+$6,750
State:
+$12,144
(% of AGI for various income ranges: 405.0% for AGIs below $25k, 162.0% for AGIs $50k-75k)
Taxable individual retirement arrangement distribution: $11,100 (reported on 8.2% of returns)
47921:
$11,100
Indiana:
$18,302
(% of AGI for various income ranges: 370.0% for AGIs $25k-50k)
Earned income credit: $2,625 (reported on 16.3% of returns)
Here:
$2,625
State:
$2,298
(% of AGI for various income ranges: 158.8% for AGIs below $25k, 69.2% for AGIs $25k-50k)
Percentage of individuals using paid preparers for their 2020 taxes: 93.9%
Here:
94%
State:
94%
(% for various income ranges: 85.7% for AGIs below $25k, 93.8% for AGIs $25k-50k, 100.0% for AGIs $50k-75k, 100.0% for AGIs $75k-100k, 100.0% for AGIs $100k-200k)
Averages for the 2012 tax year for zip code 47921, filed in 2013:
Average Adjusted Gross Income (AGI) in 2012: $44,960 (Individual Income Tax Returns)
Here:
$44,960
State:
$52,932
Salary/wage: $34,033 (reported on 87.5% of returns)
Here:
$34,033
State:
$45,173
(% of AGI for various income ranges: 77.8% for AGIs below $25k, 84.7% for AGIs $25k-50k, 79.6% for AGIs $50k-75k, 73.6% for AGIs $75k-100k, 35.8% for AGIs $100k-200k)
Taxable interest for individuals: $423 (reported on 27.1% of returns)
This zip code:
$423
Indiana:
$1,311
(% of AGI for various income ranges: 0.5% for AGIs below $25k, 0.5% for AGIs $25k-50k, 0.3% for AGIs $50k-75k, 0.1% for AGIs $100k-200k)
Ordinary dividends: $1,567 (reported on 12.5% of returns)
Here:
$1,567
State:
$4,690
Net capital gain/loss in AGI: +$100 (reported on 6.2% of returns)
Here:
+$100
State:
+$10,406
Profit/loss from business: +$3,800 (reported on 14.6% of returns)
Here:
+$3,800
State:
+$11,105
Taxable individual retirement arrangement distribution: $5,020 (reported on 10.4% of returns)
47921:
$5,020
Indiana:
$13,841
Total itemized deductions: $17,929 (20% of AGI, reported on 14.6% of returns)
Here:
$17,929
State:
$20,913
Here:
20.2% of AGI
State:
18.2% of AGI
(% of AGI for various income ranges: 10.1% for AGIs $25k-50k, 7.9% for AGIs $50k-75k, 6.5% for AGIs $100k-200k)
Charity contributions: $2,680 (reported on 10.4% of returns)
Here:
$2,680
State:
$4,697
Taxes paid: $6,229 (reported on 14.6% of returns)
47921:
$6,229
State:
$7,456
(% of AGI for various income ranges: 1.6% for AGIs $25k-50k, 2.9% for AGIs $50k-75k, 3.6% for AGIs $100k-200k)
Earned income credit: $2,400 (reported on 22.9% of returns)
Here:
$2,400
State:
$2,265
(% of AGI for various income ranges: 8.6% for AGIs below $25k, 1.1% for AGIs $25k-50k)
Percentage of individuals using paid preparers for their 2012 taxes: 62.5%
Here:
62%
State:
53%
(% for various income ranges: 55.0% for AGIs below $25k, 64.3% for AGIs $25k-50k, 66.7% for AGIs $50k-75k, 75.0% for AGIs $75k-100k, 75.0% for AGIs $100k-200k)
Averages for the 2004 tax year for zip code 47921, filed in 2005:
Average Adjusted Gross Income (AGI) in 2004: $31,667 (Individual Income Tax Returns)
Here:
$31,667
State:
$44,790
Salary/wage: $30,584 (reported on 83.0% of returns)
Here:
$30,584
State:
$39,615
(% of AGI for various income ranges: 80.2% for AGIs below $10k, 74.5% for AGIs $10k-25k, 83.5% for AGIs $25k-50k, 83.0% for AGIs $50k-75k, 88.3% for AGIs $75k-100k, 60.7% for AGIs over 100k)
Taxable interest for individuals: $924 (reported on 40.4% of returns)
This zip code:
$924
Indiana:
$1,535
(% of AGI for various income ranges: 2.3% for AGIs below $10k, 3.9% for AGIs $10k-25k, 1.1% for AGIs $25k-50k, 0.2% for AGIs $50k-75k, 0.3% for AGIs $75k-100k, 0.8% for AGIs over 100k)
Taxable dividends: $667 (reported on 14.4% of returns)
Here:
$667
State:
$2,998
(% of AGI for various income ranges: 0.3% for AGIs below $10k, 0.7% for AGIs $10k-25k, 0.3% for AGIs $25k-50k, 0.1% for AGIs $50k-75k, 0.5% for AGIs $75k-100k)
Net capital gain/loss: +$2,756 (reported on 8.6% of returns)
Here:
+$2,756
State:
+$8,619
Profit/loss from business: +$4,256 (reported on 14.9% of returns)
Here:
+$4,256
State:
+$10,071
(% of AGI for various income ranges: 12.3% for AGIs below $10k, 5.6% for AGIs $10k-25k, 2.0% for AGIs $25k-50k, 0.4% for AGIs $50k-75k)
Total itemized deductions: $12,839 (24% of AGI, reported on 16.7% of returns)
Here:
$12,839
State:
$17,065
Here:
23.9% of AGI
State:
19.5% of AGI
(% of AGI for various income ranges: 7.6% for AGIs $10k-25k, 6.1% for AGIs $25k-50k, 6.6% for AGIs $50k-75k, 14.7% for AGIs $75k-100k)
Charity contributions deductions: $1,492 (3% of AGI, reported on 12.1% of returns)
Here:
$1,492
State:
$3,550
Here:
3.2% of AGI
State:
3.8% of AGI
(% of AGI for various income ranges: 1.6% for AGIs $10k-25k, 0.3% for AGIs $25k-50k, 0.5% for AGIs $50k-75k, 0.7% for AGIs $75k-100k)
Total tax: $3,684 (reported on 69.7% of returns)
47921:
$3,684
State:
$6,914
(% of AGI for various income ranges: 2.8% for AGIs below $10k, 3.7% for AGIs $10k-25k, 5.7% for AGIs $25k-50k, 9.5% for AGIs $50k-75k, 11.4% for AGIs $75k-100k, 15.6% for AGIs over 100k)
Earned income credit: $1,786 (reported on 19.7% of returns)
Here:
$1,786
State:
$1,685
Percentage of individuals using paid preparers for their 2004 taxes: 64.8%
Here:
65%
State:
59%
(% for various income ranges: 54.0% for AGIs below $10k, 73.6% for AGIs $10k-25k, 66.7% for AGIs $25k-50k, 63.9% for AGIs $50k-75k, 92.9% for AGIs $75k-100k)
Likely homosexual households (counted as self-reported same-sex unmarried-partner households)
Lesbian couples: 1.3% of all households
Gay men: 0.0% of all households
Household received Food Stamps/SNAP in the past 12 months: 60 Household did not receive Food Stamps/SNAP in the past 12 months: 385
Women who had a birth in the past 12 months: 27 (19 now married, 8 unmarried) Women who did not have a birth in the past 12 months: 220 (102 now married, 118 unmarried)
Housing units in zip code 47921 with a mortgage: 270 (98 second mortgage, 101 both second mortgage and home equity loan) Houses without a mortgage: 6
Median monthly owner costs for units with a mortgage: $1,488 Median monthly owner costs for units without a mortgage: $397
Residents with income below the poverty level in 2022:
This zip code:
20.8%
Whole state:
12.6%
Residents with income below 50% of the poverty level in 2022:
This zip code:
13.2%
Whole state:
6.3%
Median number of rooms in houses and condos:
Here:
6.9
State:
6.6
Median number of rooms in apartments:
Here:
4.8
State:
4.3
Notable locations in this zip code not listed on our city pages
Size of family households: 113 2-persons, 58 3-persons, 41 4-persons, 26 5-persons, 11 6-persons, 16 7-or-more-persons
Size of nonfamily households: 165 1-person, 9 2-persons, 1 3-persons
183 married couples with children.
105 single-parent households (21 men, 84 women).
83.6% of residents of 47921 zip code speak English at home.
12.7% of residents speak Spanish at home (54% very well, 25% well, 15% not well, 7% not at all).
2.6% of residents speak Asian or Pacific Island language at home (64% very well, 21% well, 14% not well).
Foreign born population: 79 (6.8%) (17.1% of them are naturalized citizens)
This zip code:
6.8%
Whole state:
6.1%
56%Honduras
19%Guatemala
16%El Salvador
4%Mexico
2%Belgium
1%Malaysia
1%Thailand
24%American
14%English
7%Irish
5%German
4%Polish
2%Norwegian
2%Scotch-Irish
Year of entry for the foreign-born population
502010 or later
322000 to 2009
171990 to 1999
6Before 1990
Facilities with environmental interests located in this zip code:
BOSWELL ELEMENTARY SCHOOL (414 W MAIN ST in BOSWELL, IN)
(Geographic Names Information System) STATE MASTER (Indiana facility tracking) - LUST-199308539, LEAKING STORAGE TANK, UST-11098, UNDERGROUND STORAGE TANK PROGRAM (National Center for Education Statistics) - STATE ID-0433 Organizations: BENTON COMMUNITY SCHOOL CORP (SCHOOL DISTRICT)
BOSWELL MUNICIPAL STP (SR 41 S & SPIES ST in BOSWELL, IN)
STATE MASTER (Indiana facility tracking) - CRTK-6646, EPCRA National Pollutant Discharge Elimination System NON-MAJOR (Tracking pollutant discharge elimination systems) - permit Business SIC classification: SEWERAGE SYSTEMS Organizations: JAMES H WITT CERT OPER (CONTACT/OPERATOR)
, BOSWELL TOWN COUNCIL (CONTACT/OWNER)
Alternative names: BOSWELL MUNICIPAL WWTP
Housing units lacking complete plumbing facilities: 0.8% Housing units lacking complete kitchen facilities: 5.9%
50.3%Utility gas
37.6%Bottled, tank, or LP gas
10.2%Electricity
2.3%Wood
Population in 1990: 1,118. Population change in the 1990s: +34 (+3.0%).
Place of birth for U.S.-born residents:
This state: 732
Northeast: 10
Midwest: 233
South: 57
West: 32
61% of the 47921 zip code residents lived in the same house 5 years ago. Out of people who lived in different houses, 44% lived in this county. Out of people who lived in different counties, 50% lived in Indiana.
87% of the 47921 zip code residents lived in the same house 1 year ago. Out of people who lived in different houses, 21% moved from this county. Out of people who lived in different houses, 57% moved from different county within same state. Out of people who lived in different houses, 7% moved from different state. Out of people who lived in different houses, 15% moved from abroad.
Private vs. public school enrollment:
Students in private schools in grades 1 to 8 (elementary and middle school): 3
Here:
3.5%
Indiana:
14.9%
Students in private schools in grades 9 to 12 (high school): 13
Here:
10.7%
Indiana:
11.4%
Students in private undergraduate colleges: 15
Here:
44.2%
Indiana:
22.3%
Occupation by median earnings in the past 12 months ($)
191,404Production occupations
79,615Architecture and engineering occupations
58,734Management occupations
51,893Transportation occupations
47,727Construction and extraction occupations
46,086Installation, maintenance, and repair occupations
Top industries in this zip code by the number of employees in 2005:
Finance and Insurance: Commercial Banking (20-49 employees: 1 establishment)
Accommodation and Food Services: Limited-Service Restaurants (10-19: 1)
Administrative and Support and Waste Management and Remediation Services: All Other Support Services (5-9: 1)
Fatal accident statistics in 2013:
Fatal accident count: 1
Vehicles involved in fatal accidents: 2
Fatal accidents caused by drunken drivers: 0
Fatalities: 1
Persons involved in fatal accidents: 4
Pedestrians involved in fatal accidents: 0
Fatal accident statistics in 2012:
Fatal accident count: 1
Vehicles involved in fatal accidents: 1
Fatal accidents caused by drunken drivers: 0
Fatalities: 1
Persons involved in fatal accidents: 1
Pedestrians involved in fatal accidents: 0
2002 - 2018 National Fire Incident Reporting System (NFIRS) incidents
Based on the data from the years 2002 - 2018 the average number of fires per year is 10. The highest number of reported fire incidents - 19 took place in 2007, and the least - 0 in 2016. The data has a decreasing trend.
When looking into fire subcategories, the most incidents belonged to: Outside Fires (44.1%), and Structure Fires (31.8%).
Fire incident types reported to NFIRS in Zip Code 47921

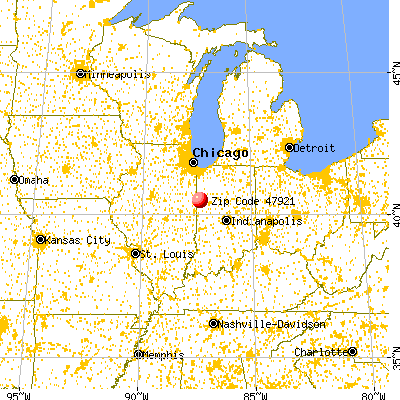


 Nearest zip codes: 47917, 47975, 47944, 47971, 47993, 47991.


 Based on the data from the years 2002 - 2018 the average number of fires per year is 10. The highest number of reported fire incidents - 19 took place in 2007, and the least - 0 in 2016. The data has a decreasing trend.
 When looking into fire subcategories, the most incidents belonged to: Outside Fires (44.1%), and Structure Fires (31.8%).