Estimated zip code population in 2022: 3,463 Zip code population in 2010: 3,623 Zip code population in 2000: 3,846
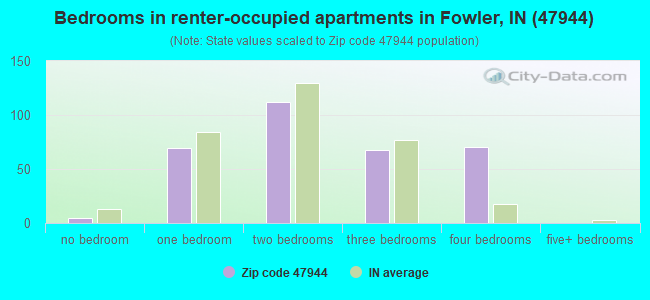
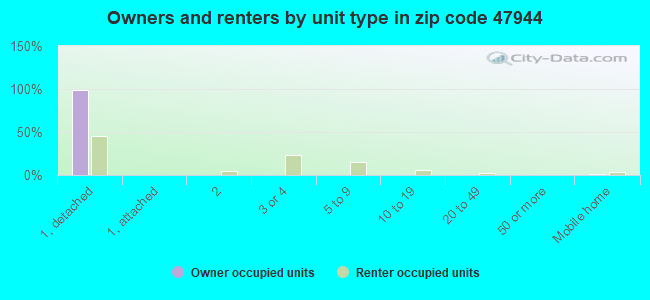
Houses and condos: 1,599 Renter-occupied apartments: 321
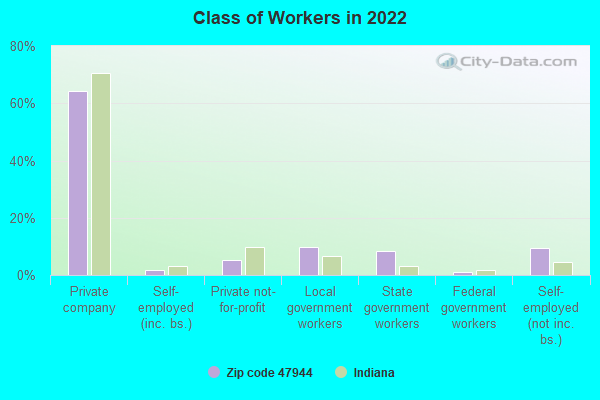
% of renters here:
22%
State:
29%
March 2022 cost of living index in zip code 47944: 85.2 (less than average, U.S. average is 100)
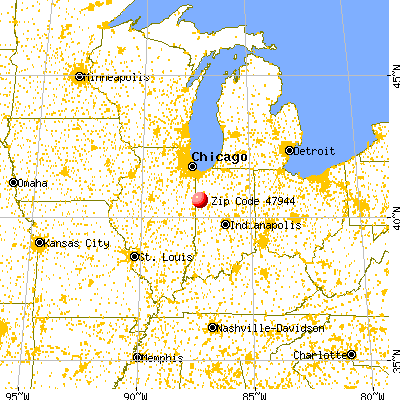
Land area: 185.7 sq. mi. Water area: 0.1 sq. mi.
Population density: 19 people per square mile
(very low).
OSM Map
General Map
Google Map
MSN Map
OSM Map
General Map
Google Map
MSN Map
OSM Map
General Map
Google Map
MSN Map
OSM Map
General Map
Google Map
MSN Map
Please wait while loading the map...
Real estate property taxes paid for housing units in 2022:
This zip code:
0.7% ($957)
Indiana:
0.7% ($1,467)
Median real estate property taxes paid for housing units with mortgages in 2022: $968 (0.7%) Median real estate property taxes paid for housing units with no mortgage in 2022: $962 (0.7%)
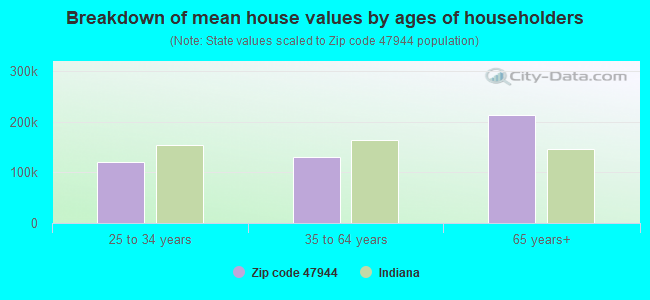
Estimated median house/condo value in 2022: $138,906
47944:
$138,906
Indiana:
$208,700
Median resident age:
This zip code:
41.5 years
Indiana median age:
38.2 years
Average household size:
This zip code:
2.4 people
Indiana:
2.4 people
Averages for the 2020 tax year for zip code 47944, filed in 2021:
Average Adjusted Gross Income (AGI) in 2020: $55,763 (Individual Income Tax Returns)
Here:
$55,763
State:
$64,978
Salary/wage: $44,616 (reported on 81.9% of returns)
Here:
$44,616
State:
$55,245
(% of AGI for various income ranges: 1090.5% for AGIs below $25k, 3920.3% for AGIs $25k-50k, 7162.7% for AGIs $50k-75k, 9938.3% for AGIs $75k-100k, 15670.0% for AGIs $100k-200k)
Taxable interest for individuals: $1,151 (reported on 31.0% of returns)
This zip code:
$1,151
Indiana:
$1,351
(% of AGI for various income ranges: 13.4% for AGIs below $25k, 28.6% for AGIs $25k-50k, 42.7% for AGIs $50k-75k, 46.7% for AGIs $75k-100k, 140.9% for AGIs $100k-200k)
Ordinary dividends: $3,847 (reported on 17.5% of returns)
Here:
$3,847
State:
$5,827
(% of AGI for various income ranges: 21.1% for AGIs below $25k, 44.0% for AGIs $25k-50k, 73.3% for AGIs $50k-75k, 79.2% for AGIs $75k-100k, 411.8% for AGIs $100k-200k)
Net capital gain/loss in AGI: +$8,208 (reported on 14.0% of returns)
Here:
+$8,208
State:
+$17,730
(% of AGI for various income ranges: 11.8% for AGIs below $25k, 53.1% for AGIs $25k-50k, 92.0% for AGIs $50k-75k, 95.8% for AGIs $75k-100k, 606.4% for AGIs $100k-200k)
Profit/loss from business: +$8,130 (reported on 13.5% of returns)
Here:
+$8,130
State:
+$12,144
(% of AGI for various income ranges: 87.4% for AGIs below $25k, 61.7% for AGIs $25k-50k, 96.7% for AGIs $50k-75k, 276.7% for AGIs $75k-100k, 768.2% for AGIs $100k-200k)
Taxable individual retirement arrangement distribution: $11,776 (reported on 9.9% of returns)
47944:
$11,776
Indiana:
$18,302
(% of AGI for various income ranges: 40.5% for AGIs below $25k, 95.4% for AGIs $25k-50k, 222.0% for AGIs $50k-75k, 425.8% for AGIs $75k-100k, 609.1% for AGIs $100k-200k)
Total itemized deductions: $38,280 (reported on 2.9% of returns)
Here:
$38,280
State:
$35,601
(% of AGI for various income ranges: 203.7% for AGIs $25k-50k, 1091.8% for AGIs $100k-200k)
Charity contributions: $11,300 (reported on 2.3% of returns)
Here:
$11,300
State:
$15,596
(% of AGI for various income ranges: 410.9% for AGIs $100k-200k)
Taxes paid: $7,380 (reported on 2.9% of returns)
47944:
$7,380
State:
$7,542
(% of AGI for various income ranges: 24.6% for AGIs $25k-50k, 257.3% for AGIs $100k-200k)
Earned income credit: $2,096 (reported on 16.4% of returns)
Here:
$2,096
State:
$2,298
(% of AGI for various income ranges: 87.9% for AGIs below $25k, 72.3% for AGIs $25k-50k)
Percentage of individuals using paid preparers for their 2020 taxes: 96.5%
Here:
96%
State:
94%
(% for various income ranges: 94.9% for AGIs below $25k, 97.8% for AGIs $25k-50k, 95.7% for AGIs $50k-75k, 100.0% for AGIs $75k-100k, 95.0% for AGIs $100k-200k, 100.0% for AGIs over 200k)
Averages for the 2012 tax year for zip code 47944, filed in 2013:
Average Adjusted Gross Income (AGI) in 2012: $51,236 (Individual Income Tax Returns)
Here:
$51,236
State:
$52,932
Salary/wage: $36,647 (reported on 80.7% of returns)
Here:
$36,647
State:
$45,173
(% of AGI for various income ranges: 77.5% for AGIs below $25k, 76.9% for AGIs $25k-50k, 72.1% for AGIs $50k-75k, 69.3% for AGIs $75k-100k, 50.0% for AGIs $100k-200k, 17.5% for AGIs over 200k)
Taxable interest for individuals: $1,202 (reported on 34.9% of returns)
This zip code:
$1,202
Indiana:
$1,311
(% of AGI for various income ranges: 1.1% for AGIs below $25k, 0.9% for AGIs $25k-50k, 0.5% for AGIs $50k-75k, 0.6% for AGIs $75k-100k, 0.9% for AGIs $100k-200k, 1.0% for AGIs over 200k)
Ordinary dividends: $7,162 (reported on 20.5% of returns)
Here:
$7,162
State:
$4,690
(% of AGI for various income ranges: 0.7% for AGIs below $25k, 0.7% for AGIs $25k-50k, 1.3% for AGIs $50k-75k, 0.8% for AGIs $75k-100k, 0.6% for AGIs $100k-200k, 12.0% for AGIs over 200k)
Net capital gain/loss in AGI: +$6,562 (reported on 12.7% of returns)
Here:
+$6,562
State:
+$10,406
(% of AGI for various income ranges: 0.3% for AGIs $75k-100k, 1.4% for AGIs $100k-200k, 6.8% for AGIs over 200k)
Profit/loss from business: +$7,578 (reported on 13.9% of returns)
Here:
+$7,578
State:
+$11,105
(% of AGI for various income ranges: 4.7% for AGIs below $25k, 3.5% for AGIs $25k-50k, 1.7% for AGIs $50k-75k, 1.9% for AGIs $75k-100k, 2.0% for AGIs $100k-200k)
Taxable individual retirement arrangement distribution: $8,529 (reported on 10.2% of returns)
47944:
$8,529
Indiana:
$13,841
(% of AGI for various income ranges: 3.0% for AGIs below $25k, 1.4% for AGIs $25k-50k, 2.0% for AGIs $50k-75k, 1.2% for AGIs $75k-100k, 2.9% for AGIs $100k-200k)
Total itemized deductions: $21,388 (18% of AGI, reported on 19.3% of returns)
Here:
$21,388
State:
$20,913
Here:
18.4% of AGI
State:
18.2% of AGI
(% of AGI for various income ranges: 5.1% for AGIs below $25k, 6.1% for AGIs $25k-50k, 8.2% for AGIs $50k-75k, 8.0% for AGIs $75k-100k, 10.6% for AGIs $100k-200k, 7.9% for AGIs over 200k)
Charity contributions: $4,756 (reported on 16.3% of returns)
Here:
$4,756
State:
$4,697
(% of AGI for various income ranges: 1.0% for AGIs $25k-50k, 1.1% for AGIs $50k-75k, 1.4% for AGIs $75k-100k, 2.8% for AGIs $100k-200k, 1.6% for AGIs over 200k)
Taxes paid: $7,947 (reported on 19.3% of returns)
47944:
$7,947
State:
$7,456
(% of AGI for various income ranges: 0.6% for AGIs below $25k, 1.2% for AGIs $25k-50k, 1.9% for AGIs $50k-75k, 2.7% for AGIs $75k-100k, 4.3% for AGIs $100k-200k, 5.3% for AGIs over 200k)
Earned income credit: $2,093 (reported on 17.5% of returns)
Here:
$2,093
State:
$2,265
(% of AGI for various income ranges: 5.7% for AGIs below $25k, 1.3% for AGIs $25k-50k)
Percentage of individuals using paid preparers for their 2012 taxes: 63.3%
Here:
63%
State:
53%
(% for various income ranges: 55.9% for AGIs below $25k, 61.5% for AGIs $25k-50k, 70.8% for AGIs $50k-75k, 68.8% for AGIs $75k-100k, 73.3% for AGIs $100k-200k, 100.0% for AGIs over 200k)
Averages for the 2004 tax year for zip code 47944, filed in 2005:
Average Adjusted Gross Income (AGI) in 2004: $38,627 (Individual Income Tax Returns)
Here:
$38,627
State:
$44,790
Salary/wage: $31,889 (reported on 82.3% of returns)
Here:
$31,889
State:
$39,615
(% of AGI for various income ranges: 115.2% for AGIs below $10k, 67.3% for AGIs $10k-25k, 75.0% for AGIs $25k-50k, 76.3% for AGIs $50k-75k, 78.7% for AGIs $75k-100k, 40.3% for AGIs over 100k)
Taxable interest for individuals: $1,812 (reported on 48.4% of returns)
This zip code:
$1,812
Indiana:
$1,535
(% of AGI for various income ranges: 9.0% for AGIs below $10k, 4.2% for AGIs $10k-25k, 1.7% for AGIs $25k-50k, 1.6% for AGIs $50k-75k, 1.0% for AGIs $75k-100k, 3.0% for AGIs over 100k)
Taxable dividends: $2,230 (reported on 26.0% of returns)
Here:
$2,230
State:
$2,998
(% of AGI for various income ranges: 4.1% for AGIs below $10k, 0.9% for AGIs $10k-25k, 1.2% for AGIs $25k-50k, 0.7% for AGIs $50k-75k, 0.5% for AGIs $75k-100k, 3.4% for AGIs over 100k)
Net capital gain/loss: +$8,837 (reported on 17.3% of returns)
Here:
+$8,837
State:
+$8,619
(% of AGI for various income ranges: -1.1% for AGIs below $10k, 1.1% for AGIs $10k-25k, 1.1% for AGIs $25k-50k, 2.2% for AGIs $50k-75k, 1.6% for AGIs $75k-100k, 12.2% for AGIs over 100k)
Profit/loss from business: +$5,707 (reported on 15.9% of returns)
Here:
+$5,707
State:
+$10,071
(% of AGI for various income ranges: 4.5% for AGIs below $10k, 5.3% for AGIs $10k-25k, 2.2% for AGIs $25k-50k, 1.4% for AGIs $50k-75k, 2.7% for AGIs $75k-100k, 1.7% for AGIs over 100k)
Profit/loss from farming: +$10,717 (reported on 8.1% of returns)
Here:
+$10,717
State:
-$2,212
(% of AGI for various income ranges: 3.2% for AGIs $10k-25k, 2.9% for AGIs $25k-50k, 3.6% for AGIs $50k-75k, 2.2% for AGIs $75k-100k)
IRA payment deduction: $3,071 (reported on 4.1% of returns)
47944:
$3,071
Indiana:
$2,840
(% of AGI for various income ranges: 0.4% for AGIs $10k-25k, 0.4% for AGIs $25k-50k, 0.4% for AGIs $50k-75k, 0.5% for AGIs $75k-100k)
Total itemized deductions: $14,845 (20% of AGI, reported on 22.0% of returns)
Here:
$14,845
State:
$17,065
Here:
20.4% of AGI
State:
19.5% of AGI
(% of AGI for various income ranges: 7.5% for AGIs below $10k, 8.7% for AGIs $10k-25k, 8.6% for AGIs $25k-50k, 8.7% for AGIs $50k-75k, 8.5% for AGIs $75k-100k, 7.9% for AGIs over 100k)
Charity contributions deductions: $2,852 (4% of AGI, reported on 18.3% of returns)
Here:
$2,852
State:
$3,550
Here:
3.7% of AGI
State:
3.8% of AGI
(% of AGI for various income ranges: 0.9% for AGIs $10k-25k, 1.2% for AGIs $25k-50k, 1.4% for AGIs $50k-75k, 1.8% for AGIs $75k-100k, 1.5% for AGIs over 100k)
Total tax: $5,370 (reported on 73.0% of returns)
47944:
$5,370
State:
$6,914
(% of AGI for various income ranges: 2.7% for AGIs below $10k, 4.5% for AGIs $10k-25k, 7.1% for AGIs $25k-50k, 8.5% for AGIs $50k-75k, 11.0% for AGIs $75k-100k, 17.8% for AGIs over 100k)
Earned income credit: $1,742 (reported on 14.6% of returns)
Here:
$1,742
State:
$1,685
Percentage of individuals using paid preparers for their 2004 taxes: 67.5%
Here:
67%
State:
59%
(% for various income ranges: 61.7% for AGIs below $10k, 69.4% for AGIs $10k-25k, 68.8% for AGIs $25k-50k, 70.0% for AGIs $50k-75k, 63.6% for AGIs $75k-100k, 76.8% for AGIs over 100k)
Household received Food Stamps/SNAP in the past 12 months: 124 Household did not receive Food Stamps/SNAP in the past 12 months: 1,315
Women who had a birth in the past 12 months: 48 (28 now married, 18 unmarried) Women who did not have a birth in the past 12 months: 594 (253 now married, 340 unmarried)
Housing units in zip code 47944 with a mortgage: 641 (93 second mortgage, 90 both second mortgage and home equity loan) Houses without a mortgage: 24
Median monthly owner costs for units with a mortgage: $1,034 Median monthly owner costs for units without a mortgage: $476
Residents with income below the poverty level in 2022:
This zip code:
13.8%
Whole state:
12.6%
Residents with income below 50% of the poverty level in 2022:
This zip code:
6.4%
Whole state:
6.3%
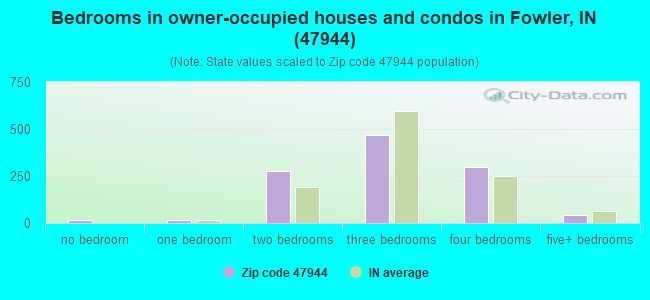
Median number of rooms in houses and condos:
Here:
7.0
State:
6.6
Median number of rooms in apartments:
Here:
4.5
State:
4.3
Notable locations in this zip code not listed on our city pages
In group quarters: 70 (-1 institutionalized population)
Size of family households: 475 2-persons, 78 3-persons, 118 4-persons, 125 5-persons, 67 6-persons, 3 7-or-more-persons
Size of nonfamily households: 512 1-person, 61 2-persons
540 married couples with children.
224 single-parent households (96 men, 128 women).
97.3% of residents of 47944 zip code speak English at home.
1.9% of residents speak Spanish at home (100% very well).
0.2% of residents speak other Indo-European language at home (50% very well, 50% well).
0.2% of residents speak other language at home (100% very well).
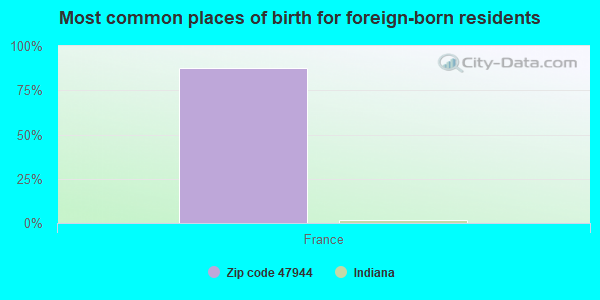
Foreign born population: 8 (0.2%) (0.0% of them are naturalized citizens)
:
0.2%
Whole state:
6.1%
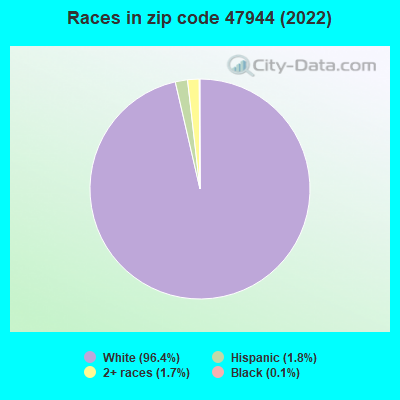
88%France
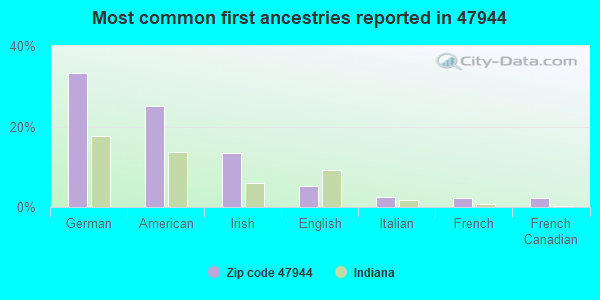
33%German
25%American
13%Irish
5%English
2%Italian
2%French
2%French Canadian
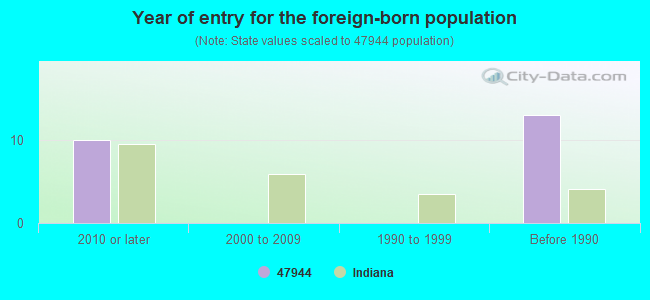
Year of entry for the foreign-born population
102010 or later
02000 to 2009
01990 to 1999
13Before 1990
Facilities with environmental interests located in this zip code:
SENESAC INC (211 S ADEWAY RD in FOWLER, IN)
STATE MASTER (Indiana facility tracking) - CRTK-6039, EPCRA, LUST-198712064, LEAKING STORAGE TANK, UST-20064, UNDERGROUND STORAGE TANK PROGRAM (Resource Conservation and Recovery Act (tracking hazardous waste))
CARGILL (7052 W SR 18 in FOWLER, IN)
STATE MASTER (Indiana facility tracking) - ACES-OP-00700004, AIR PROGRAM (Resource Conservation and Recovery Act (tracking hazardous waste)) Organizations: CARGILL INC (CONTACT/OWNER)
POWELL SYSTEMS INCORPORATED (83 S. MERIDIAN RD. in FOWLER, IN)
STATE MASTER (Indiana facility tracking) - CRTK-19474, EPCRA, UST-17590, UNDERGROUND STORAGE TANK PROGRAM Conditionally Exempt Small Quantity Generators, less than 100 kg/month of hazardous waste (Resource Conservation and Recovery Act (tracking hazardous waste)) - notification TRI REPORTER (Tracking of toxic chemicals releasing facilities) Business SIC classification: FABRICATED METAL PRODUCTS Business NAICS classification: OTHER METAL CONTAINER MANUFACTURING. Organizations: POWELL SYS INC FOWLER DIV (CONTACT/OPERATOR)
, POWELL WILLIAM R (CONTACT/OWNER)
Alternative names: POWELL SYSTEMS INC FOWLER DIV
DEMETER INC (250 E CR 400 N in FOWLER, IN)
AIR MAJOR (AIRS/AFS) STATE MASTER (Indiana facility tracking) - ACES-OP-00700008, AIR PROGRAM, CRTK-5689, EPCRA CRITERIA AND HAZARDOUS AIR POLLUTANT INVENTORY (Inventory of air pollution sources) Business SIC classification: GRAIN AND FIELD BEANS Alternative names: LOCHIEL ELEV DIV/DEMETER RR 1
DEMETER INC (7483 W 300 S in FOWLER, IN)
AIR MAJOR (AIRS/AFS) STATE MASTER (Indiana facility tracking) - ACES-OP-00700003, AIR PROGRAM, ACES-OP-00700009, CRTK-5690, EPCRA Business SIC classification: GRAIN AND FIELD BEANS
AG TECH CONSULTING (S ADEWAYE RD RR BOX 264 in FOWLER, IN)
STATE MASTER (Indiana facility tracking) COMPLIANCE ACTIVITY (Tracking inspections of insecticide, fungicide, and rodenticide, and toxic substances)
DEMETER INCORPORATED SWANINGTON DIVISION (INDIANA & WEST STS in FOWLER, IN)
AIR SYNTHETIC MINOR (AIRS/AFS) STATE MASTER (Indiana facility tracking) Business SIC classification: GRAIN AND FIELD BEANS
SACRED HEART SCHOOL 03 (N WASHINGTON ST in FOWLER, IN)
STATE MASTER (Indiana facility tracking) COMPLIANCE ACTIVITY (Tracking inspections of insecticide, fungicide, and rodenticide, and toxic substances)
Housing units lacking complete plumbing facilities: 1.5% Housing units lacking complete kitchen facilities: 2.0%
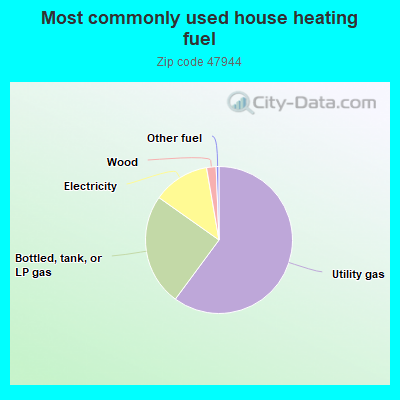
59.7%Utility gas
24.5%Bottled, tank, or LP gas
12.4%Electricity
2.1%Wood
0.6%Other fuel
Population in 1990: 3,762. Population change in the 1990s: +84 (+2.2%).
Place of birth for U.S.-born residents:
This state: 2,790
Northeast: 32
Midwest: 280
South: 216
West: 97
59% of the 47944 zip code residents lived in the same house 5 years ago. Out of people who lived in different houses, 47% lived in this county. Out of people who lived in different counties, 50% lived in Indiana.
89% of the 47944 zip code residents lived in the same house 1 year ago. Out of people who lived in different houses, 32% moved from this county. Out of people who lived in different houses, 39% moved from different county within same state. Out of people who lived in different houses, 29% moved from different state.
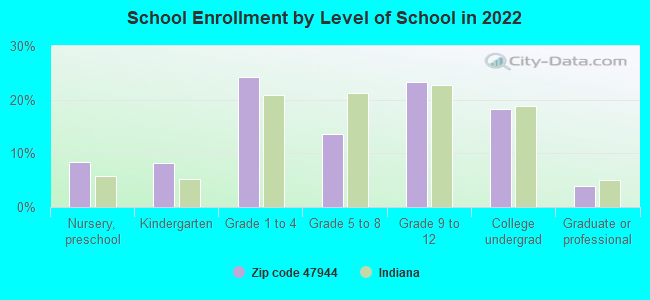
Private vs. public school enrollment:
Students in private schools in grades 1 to 8 (elementary and middle school): 65
Here:
21.0%
Indiana:
14.9%
Students in private schools in grades 9 to 12 (high school): 12
Here:
6.3%
Indiana:
11.4%
Students in private undergraduate colleges: 47
Here:
30.9%
Indiana:
22.3%
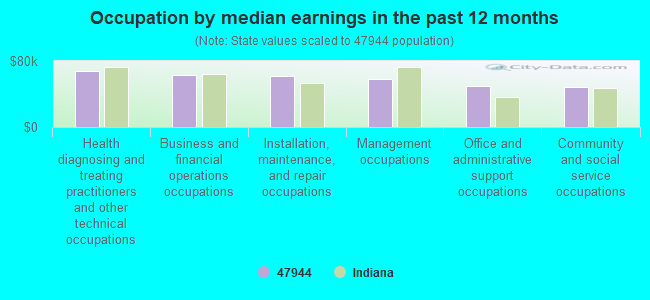
Occupation by median earnings in the past 12 months ($)
67,360Health diagnosing and treating practitioners and other technical occupations
62,564Business and financial operations occupations
61,515Installation, maintenance, and repair occupations
58,783Management occupations
49,225Office and administrative support occupations
48,065Community and social service occupations
Top industries in this zip code by the number of employees in 2005:
Health Care and Social Assistance: Nursing Care Facilities (50-99 employees: 1 establishment)
Other Services (except Public Administration): Religious Organizations (20-49: 1, 5-9: 2, 1-4: 2)
56 people in nursing facilities/skilled-nursing facilities
21 people in local jails and other municipal confinement facilities
People in group quarters in 2000:
63 people in nursing homes
47 people in local jails and other confinement facilities (including police lockups)
Fatal accident statistics in 2011:
Fatal accident count: 1
Vehicles involved in fatal accidents: 2
Fatal accidents caused by drunken drivers: 0
Fatalities: 2
Persons involved in fatal accidents: 2
Pedestrians involved in fatal accidents: 0
Fatal accident statistics in 2010:
Fatal accident count: 2
Vehicles involved in fatal accidents: 3
Fatal accidents caused by drunken drivers: 0
Fatalities: 2
Persons involved in fatal accidents: 3
Pedestrians involved in fatal accidents: 0
2002 - 2018 National Fire Incident Reporting System (NFIRS) incidents
Based on the data from the years 2002 - 2018 the average number of fires per year is 14. The highest number of reported fire incidents - 33 took place in 2007, and the least - 0 in 2016. The data has a growing trend.
When looking into fire subcategories, the most reports belonged to: Outside Fires (48.5%), and Structure Fires (31.5%).
Fire incident types reported to NFIRS in Zip Code 47944


+$10,717
-$2,212
(% of AGI for various income ranges: 3.2% for AGIs $10k-25k, 2.9% for AGIs $25k-50k, 3.6% for AGIs $50k-75k, 2.2% for AGIs $75k-100k) Nearest zip codes: 47971, 47942, 47921, 47948, 47975, 47917.


 Based on the data from the years 2002 - 2018 the average number of fires per year is 14. The highest number of reported fire incidents - 33 took place in 2007, and the least - 0 in 2016. The data has a growing trend.
 When looking into fire subcategories, the most reports belonged to: Outside Fires (48.5%), and Structure Fires (31.5%).