Estimated zip code population in 2022: 3,425 Zip code population in 2010: 3,254 Zip code population in 2000: 3,430
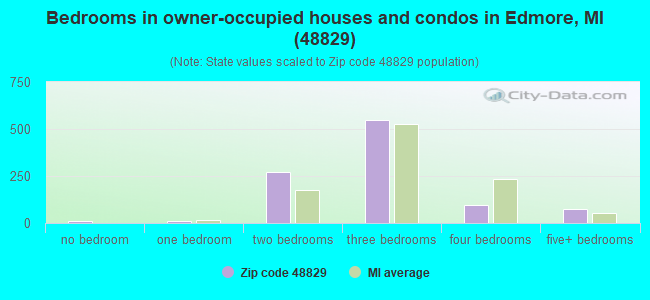
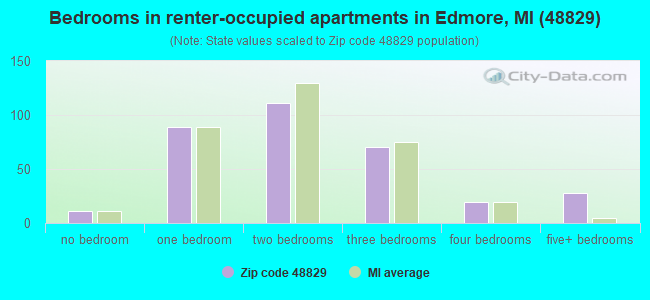
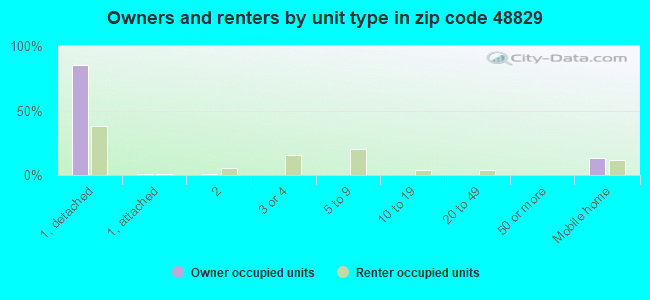
Houses and condos: 1,395 Renter-occupied apartments: 325
% of renters here:
24%
State:
27%
March 2022 cost of living index in zip code 48829: 80.4 (low, U.S. average is 100)
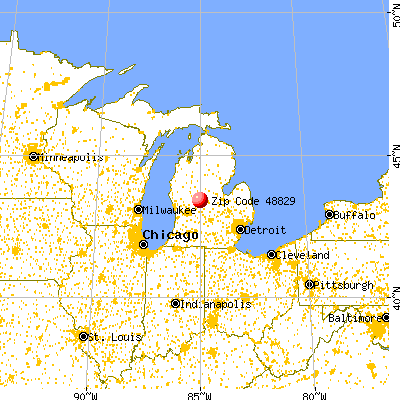
Land area: 65.5 sq. mi. Water area: 0.2 sq. mi.
Population density: 52 people per square mile
(very low).
OSM Map
General Map
Google Map
MSN Map
OSM Map
General Map
Google Map
MSN Map
OSM Map
General Map
Google Map
MSN Map
OSM Map
General Map
Google Map
MSN Map
Please wait while loading the map...
Real estate property taxes paid for housing units in 2022:
This zip code:
1.2% ($1,598)
Michigan:
1.2% ($2,746)
Median real estate property taxes paid for housing units with mortgages in 2022: $1,663 (1.4%) Median real estate property taxes paid for housing units with no mortgage in 2022: $1,502 (0.9%)
Business Search- 14 Million verified businesses
Males: 1,826
(53.3%)
Females: 1,599
(46.7%)
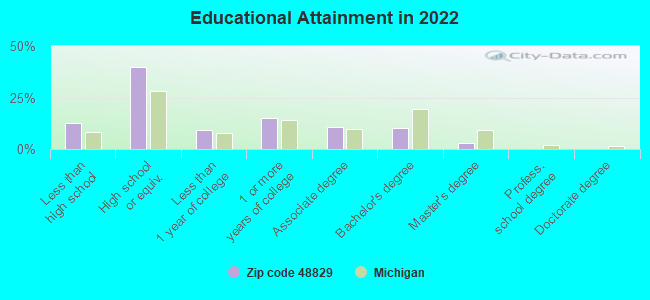
For population 25 years and over in 48829:
High school or higher: 86.5%
Bachelor's degree or higher: 13.1%
Graduate or professional degree: 2.9%
Unemployed: 4.4%
Mean travel time to work (commute): 21.4 minutes
For population 15 years and over in 48829:
Never married: 28.7%
Now married: 51.6%
Separated: 0.2%
Widowed: 4.7%
Divorced: 14.8%
Zip code 48829 compared to state average:
Median house value below state average.
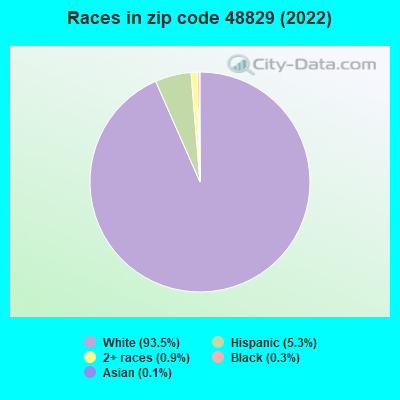
Black race population percentage significantly below state average.
Foreign-born population percentage significantly below state average.
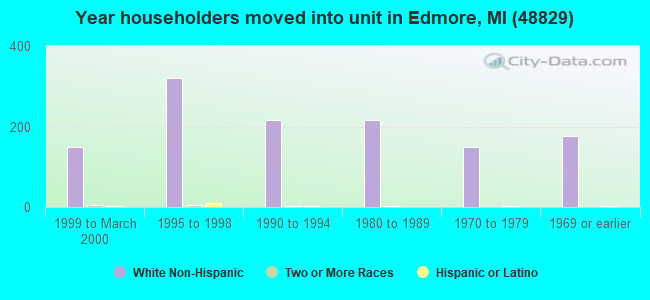
Length of stay since moving in above state average.
Percentage of population with a bachelor's degree or higher significantly below state average.
Averages for the 2020 tax year for zip code 48829, filed in 2021:
Average Adjusted Gross Income (AGI) in 2020: $44,041 (Individual Income Tax Returns)
Here:
$44,041
State:
$68,945
Salary/wage: $38,472 (reported on 76.9% of returns)
Here:
$38,472
State:
$57,142
(% of AGI for various income ranges: 1109.2% for AGIs below $25k, 3127.0% for AGIs $25k-50k, 6345.6% for AGIs $50k-75k, 8092.5% for AGIs $75k-100k, 16098.6% for AGIs $100k-200k)
Taxable interest for individuals: $803 (reported on 25.2% of returns)
This zip code:
$803
Michigan:
$1,630
(% of AGI for various income ranges: 20.5% for AGIs below $25k, 9.4% for AGIs $25k-50k, 28.1% for AGIs $50k-75k, 106.2% for AGIs $75k-100k, 74.3% for AGIs $100k-200k)
Ordinary dividends: $2,682 (reported on 11.9% of returns)
Here:
$2,682
State:
$6,972
(% of AGI for various income ranges: 11.9% for AGIs below $25k, 22.4% for AGIs $25k-50k, 57.5% for AGIs $50k-75k, 126.2% for AGIs $75k-100k, 207.1% for AGIs $100k-200k)
Net capital gain/loss in AGI: +$6,100 (reported on 9.1% of returns)
Here:
+$6,100
State:
+$20,064
(% of AGI for various income ranges: 6.2% for AGIs below $25k, 21.8% for AGIs $25k-50k, 35.6% for AGIs $50k-75k, 321.2% for AGIs $75k-100k, 548.6% for AGIs $100k-200k)
Profit/loss from business: +$10,106 (reported on 11.2% of returns)
Here:
+$10,106
State:
+$11,172
(% of AGI for various income ranges: 71.6% for AGIs below $25k, 113.9% for AGIs $25k-50k, 222.5% for AGIs $50k-75k, 885.7% for AGIs $100k-200k)
Taxable individual retirement arrangement distribution: $12,486 (reported on 9.8% of returns)
48829:
$12,486
Michigan:
$19,803
(% of AGI for various income ranges: 75.1% for AGIs below $25k, 90.6% for AGIs $25k-50k, 325.0% for AGIs $50k-75k, 930.0% for AGIs $100k-200k)
Total itemized deductions: $29,050 (reported on 2.8% of returns)
Here:
$29,050
State:
$34,117
(% of AGI for various income ranges: 1452.5% for AGIs $75k-100k)
Charity contributions: $10,300 (reported on 2.1% of returns)
Here:
$10,300
State:
$13,548
(% of AGI for various income ranges: 193.1% for AGIs $50k-75k)
Taxes paid: $7,033 (reported on 2.1% of returns)
48829:
$7,033
State:
$7,972
(% of AGI for various income ranges: 263.8% for AGIs $75k-100k)
Earned income credit: $2,233 (reported on 18.9% of returns)
Here:
$2,233
State:
$2,251
(% of AGI for various income ranges: 88.6% for AGIs below $25k, 83.3% for AGIs $25k-50k)
Percentage of individuals using paid preparers for their 2020 taxes: 95.1%
Here:
95%
State:
93%
(% for various income ranges: 94.7% for AGIs below $25k, 95.0% for AGIs $25k-50k, 91.3% for AGIs $50k-75k, 100.0% for AGIs $75k-100k, 100.0% for AGIs $100k-200k)
Averages for the 2012 tax year for zip code 48829, filed in 2013:
Average Adjusted Gross Income (AGI) in 2012: $35,201 (Individual Income Tax Returns)
Here:
$35,201
State:
$55,609
Salary/wage: $32,279 (reported on 78.5% of returns)
Here:
$32,279
State:
$46,782
(% of AGI for various income ranges: 66.4% for AGIs below $25k, 73.7% for AGIs $25k-50k, 72.4% for AGIs $50k-75k, 77.2% for AGIs $75k-100k, 68.3% for AGIs $100k-200k)
Taxable interest for individuals: $1,214 (reported on 26.7% of returns)
This zip code:
$1,214
Michigan:
$1,491
(% of AGI for various income ranges: 2.0% for AGIs below $25k, 0.4% for AGIs $25k-50k, 1.5% for AGIs $50k-75k, 0.6% for AGIs $75k-100k, 0.3% for AGIs $100k-200k)
Ordinary dividends: $2,324 (reported on 12.6% of returns)
Here:
$2,324
State:
$6,225
(% of AGI for various income ranges: 1.2% for AGIs below $25k, 0.6% for AGIs $25k-50k, 1.2% for AGIs $50k-75k, 1.3% for AGIs $75k-100k)
Net capital gain/loss in AGI: +$2,846 (reported on 9.6% of returns)
Here:
+$2,846
State:
+$9,326
(% of AGI for various income ranges: 0.4% for AGIs below $25k, 0.2% for AGIs $25k-50k, 1.0% for AGIs $50k-75k, 2.5% for AGIs $75k-100k)
Profit/loss from business: +$6,444 (reported on 13.3% of returns)
Here:
+$6,444
State:
+$11,523
(% of AGI for various income ranges: 4.6% for AGIs below $25k, 3.6% for AGIs $25k-50k, 2.7% for AGIs $50k-75k, 0.7% for AGIs $75k-100k)
Taxable individual retirement arrangement distribution: $8,664 (reported on 10.4% of returns)
48829:
$8,664
Michigan:
$15,298
(% of AGI for various income ranges: 2.9% for AGIs below $25k, 3.0% for AGIs $25k-50k, 3.3% for AGIs $50k-75k, 3.1% for AGIs $75k-100k)
Total itemized deductions: $18,305 (25% of AGI, reported on 15.6% of returns)
Here:
$18,305
State:
$21,628
Here:
25.4% of AGI
State:
18.4% of AGI
(% of AGI for various income ranges: 3.8% for AGIs below $25k, 7.3% for AGIs $25k-50k, 8.0% for AGIs $50k-75k, 10.5% for AGIs $75k-100k, 10.8% for AGIs $100k-200k)
Charity contributions: $4,789 (reported on 13.3% of returns)
Here:
$4,789
State:
$4,225
(% of AGI for various income ranges: 1.6% for AGIs $25k-50k, 2.3% for AGIs $50k-75k, 2.2% for AGIs $75k-100k, 2.7% for AGIs $100k-200k)
Taxes paid: $4,990 (reported on 15.6% of returns)
48829:
$4,990
State:
$8,327
(% of AGI for various income ranges: 0.6% for AGIs below $25k, 1.3% for AGIs $25k-50k, 2.0% for AGIs $50k-75k, 2.9% for AGIs $75k-100k, 4.7% for AGIs $100k-200k)
Earned income credit: $2,175 (reported on 23.7% of returns)
Here:
$2,175
State:
$2,306
(% of AGI for various income ranges: 7.1% for AGIs below $25k, 1.4% for AGIs $25k-50k)
Percentage of individuals using paid preparers for their 2012 taxes: 56.3%
Here:
56%
State:
57%
(% for various income ranges: 47.7% for AGIs below $25k, 56.8% for AGIs $25k-50k, 66.7% for AGIs $50k-75k, 77.8% for AGIs $75k-100k, 83.3% for AGIs $100k-200k)
Averages for the 2004 tax year for zip code 48829, filed in 2005:
Average Adjusted Gross Income (AGI) in 2004: $32,189 (Individual Income Tax Returns)
Here:
$32,189
State:
$48,204
Salary/wage: $28,410 (reported on 84.1% of returns)
Here:
$28,410
State:
$42,791
(% of AGI for various income ranges: 103.9% for AGIs below $10k, 71.1% for AGIs $10k-25k, 81.0% for AGIs $25k-50k, 79.5% for AGIs $50k-75k, 66.1% for AGIs $75k-100k, 54.9% for AGIs over 100k)
Taxable interest for individuals: $1,589 (reported on 37.9% of returns)
This zip code:
$1,589
Michigan:
$1,725
(% of AGI for various income ranges: 2.4% for AGIs below $10k, 2.5% for AGIs $10k-25k, 1.2% for AGIs $25k-50k, 1.5% for AGIs $50k-75k, 3.2% for AGIs $75k-100k, 2.2% for AGIs over 100k)
Taxable dividends: $2,317 (reported on 14.0% of returns)
Here:
$2,317
State:
$3,420
(% of AGI for various income ranges: 2.2% for AGIs below $10k, 1.0% for AGIs $10k-25k, 0.5% for AGIs $25k-50k, 1.1% for AGIs $50k-75k, 2.4% for AGIs $75k-100k, 0.7% for AGIs over 100k)
Net capital gain/loss: +$6,299 (reported on 9.4% of returns)
Here:
+$6,299
State:
+$8,532
(% of AGI for various income ranges: 0.1% for AGIs $10k-25k, 0.7% for AGIs $25k-50k, 1.6% for AGIs $50k-75k, 4.1% for AGIs $75k-100k, 5.1% for AGIs over 100k)
Profit/loss from business: +$2,646 (reported on 13.0% of returns)
Here:
+$2,646
State:
+$9,547
(% of AGI for various income ranges: -2.2% for AGIs below $10k, 2.9% for AGIs $10k-25k, 1.5% for AGIs $25k-50k, 0.3% for AGIs $50k-75k, 1.1% for AGIs $75k-100k)
IRA payment deduction: $2,524 (reported on 1.6% of returns)
48829:
$2,524
Michigan:
$2,875
Total itemized deductions: $14,783 (27% of AGI, reported on 20.4% of returns)
Here:
$14,783
State:
$18,509
Here:
26.8% of AGI
State:
20.7% of AGI
(% of AGI for various income ranges: 9.2% for AGIs below $10k, 6.8% for AGIs $10k-25k, 9.2% for AGIs $25k-50k, 10.3% for AGIs $50k-75k, 11.8% for AGIs $75k-100k, 9.1% for AGIs over 100k)
Charity contributions deductions: $3,966 (7% of AGI, reported on 15.1% of returns)
Here:
$3,966
State:
$3,365
Here:
6.8% of AGI
State:
3.6% of AGI
(% of AGI for various income ranges: 0.8% for AGIs $10k-25k, 1.2% for AGIs $25k-50k, 3.0% for AGIs $50k-75k, 3.6% for AGIs $75k-100k, 1.8% for AGIs over 100k)
Total tax: $3,711 (reported on 65.3% of returns)
48829:
$3,711
State:
$7,691
(% of AGI for various income ranges: 2.3% for AGIs below $10k, 3.5% for AGIs $10k-25k, 5.5% for AGIs $25k-50k, 8.1% for AGIs $50k-75k, 9.4% for AGIs $75k-100k, 14.5% for AGIs over 100k)
Earned income credit: $1,800 (reported on 19.3% of returns)
Here:
$1,800
State:
$1,737
Percentage of individuals using paid preparers for their 2004 taxes: 62.1%
Here:
62%
State:
60%
(% for various income ranges: 52.7% for AGIs below $10k, 61.4% for AGIs $10k-25k, 63.5% for AGIs $25k-50k, 72.0% for AGIs $50k-75k, 65.0% for AGIs $75k-100k, 82.9% for AGIs over 100k)
Household received Food Stamps/SNAP in the past 12 months: 271 Household did not receive Food Stamps/SNAP in the past 12 months: 1,070
Women who had a birth in the past 12 months: 7 (7 now married, 0 unmarried) Women who did not have a birth in the past 12 months: 617 (346 now married, 268 unmarried)
Housing units in zip code 48829 with a mortgage: 621 (43 second mortgage, 39 both second mortgage and home equity loan) Median monthly owner costs for units with a mortgage: $1,016 Median monthly owner costs for units without a mortgage: $485
Residents with income below the poverty level in 2022:
This zip code:
16.7%
Whole state:
13.4%
Residents with income below 50% of the poverty level in 2022:
This zip code:
11.4%
Whole state:
6.9%
Median number of rooms in houses and condos:
Here:
6.2
State:
6.5
Median number of rooms in apartments:
Here:
4.6
State:
4.3
Notable locations in this zip code not listed on our city pages
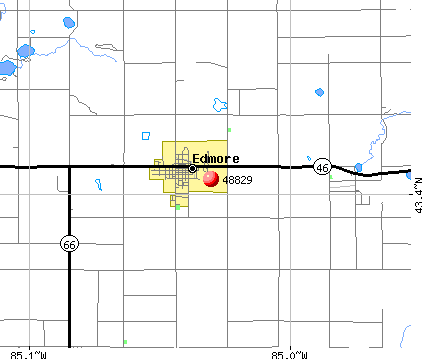
Notable locations in zip code 48829: Family Campground (A), Edmore Golf Course (B), Day Township Fire Department (C), Old Fence Rider Museum (D), Edmore Police Department (E), Home Township Fire Department (F), Home Township Library (G). Display/hide their locations on the map
Churches in zip code 48829 include: Cutler Savage Church (A), Saint Margaret Mary's Church (B), Zion Church (C), First Church of God (D), First Baptist Church (E), Seventh Day Adventist Church (F), Faith United Methodist Church (G), Our Saviour's Lutheran Church (H). Display/hide their locations on the map
Cemeteries: Palmer Cemetery (1), Cedar Lake Cemetery (2), McBrides Cemetery (3), Home Cemetery (4), Vinewood Cemetery (5). Display/hide their locations on the map
In group quarters: 84 (-1 institutionalized population)
Size of family households: 390 2-persons, 187 3-persons, 152 4-persons, 71 5-persons, 33 6-persons, 9 7-or-more-persons
Size of nonfamily households: 437 1-person, 51 2-persons
483 married couples with children.
178 single-parent households (88 men, 90 women).
93.1% of residents of 48829 zip code speak English at home.
5.2% of residents speak Spanish at home (86% very well, 3% well, 11% not well).
0.2% of residents speak other Indo-European language at home (100% very well).
0.3% of residents speak Asian or Pacific Island language at home (64% very well, 36% well).
0.9% of residents speak other language at home (23% very well, 50% well, 27% not at all).
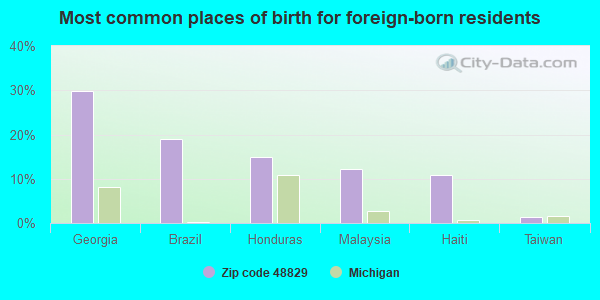
Foreign born population: 74 (2.2%) (58.0% of them are naturalized citizens)
This zip code:
2.2%
Whole state:
6.9%
30%Georgia
19%Brazil
15%Honduras
12%Malaysia
11%Haiti
1%Taiwan
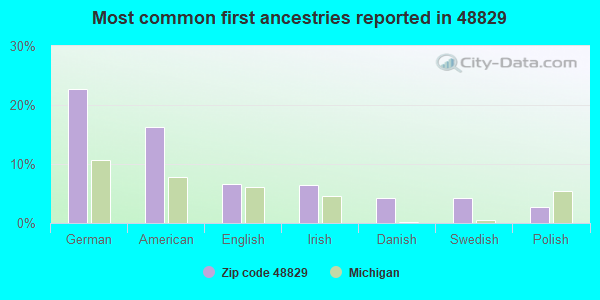
23%German
16%American
7%English
6%Irish
4%Danish
4%Swedish
3%Polish
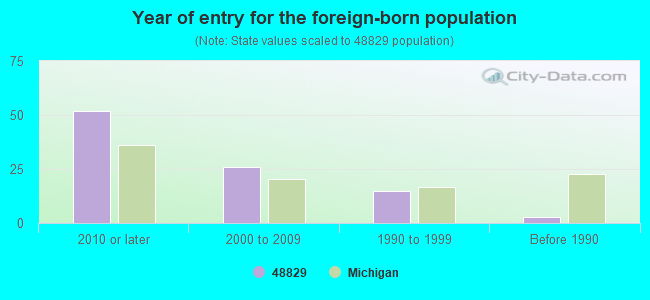
Year of entry for the foreign-born population
522010 or later
262000 to 2009
151990 to 1999
3Before 1990
Facilities with environmental interests located in this zip code:
ANDERSON AGRI GROUP, INC. (313 LEWIS ST in EDMORE, MI)
(Integrated Compliance Information System) - ICIS-05-1997-0358, FORMAL ENFORCEMENT ACTION COMPLIANCE ACTIVITY (Tracking inspections of insecticide, fungicide, and rodenticide, and toxic substances) Business SIC classification: PHOSPHATIC FERTILIZERS
(Resource Conservation and Recovery Act (tracking hazardous waste)) Business NAICS classification: CAR WASHES. Organizations: WAYNE BUNCE (CONTACT/OWNER)
BANK OF ALMA (300 E NORTH ST in EDMORE, MI)
(Resource Conservation and Recovery Act (tracking hazardous waste)) Alternative names: ALMA BANK OF-NU FOODS INC
MI DEPT/ENVIRONMENTAL QUALITY (302 E MAIN ST in EDMORE, MI)
(Resource Conservation and Recovery Act (tracking hazardous waste)) Alternative names: MOBIL OIL CORP EDMORE MOBIL
FOUR JS CORPORATION (217 E MAIN in EDMORE, MI)
(Resource Conservation and Recovery Act (tracking hazardous waste)) Alternative names: EDMORE CLEANERS
BIRD FERT SERVICE (313 LEWIS ST in EDMORE, MI)
COMPLIANCE ACTIVITY (Tracking inspections of insecticide, fungicide, and rodenticide, and toxic substances) Alternative names: BIRD FERT AND GRAIN CO
AMERICAN DISH SERVICE OF W CENTRAL (1350 INDUSTRIAL PARK in EDMORE, MI)
COMPLIANCE ACTIVITY (Tracking inspections of insecticide, fungicide, and rodenticide, and toxic substances)
GROWER SERVICE CORPORTATION (1449 DEANER RD in EDMORE, MI)
COMPLIANCE ACTIVITY (Tracking inspections of insecticide, fungicide, and rodenticide, and toxic substances)
Housing units lacking complete plumbing facilities: 0.8% Housing units lacking complete kitchen facilities: 0.8%
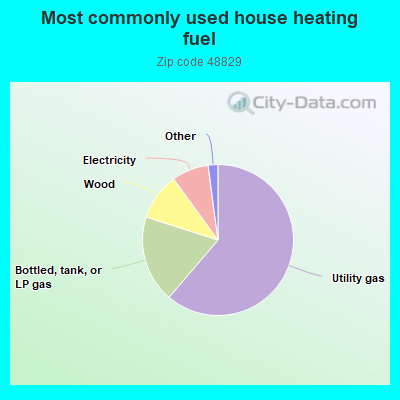
61.3%Utility gas
18.7%Bottled, tank, or LP gas
10.1%Wood
7.9%Electricity
1.0%Fuel oil, kerosene, etc.
0.6%No fuel used
0.5%Other fuel
Population in 1990: 2,515. Population change in the 1990s: +915 (+36.4%).
Place of birth for U.S.-born residents:
This state: 2,975
Northeast: 72
Midwest: 104
South: 66
West: 112
61% of the 48829 zip code residents lived in the same house 5 years ago. Out of people who lived in different houses, 54% lived in this county. Out of people who lived in different counties, 50% lived in Michigan.
94% of the 48829 zip code residents lived in the same house 1 year ago. Out of people who lived in different houses, 35% moved from this county. Out of people who lived in different houses, 62% moved from different county within same state. Out of people who lived in different houses, 3% moved from different state.
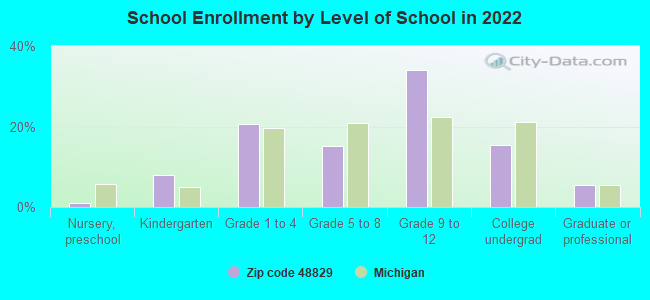
Private vs. public school enrollment:
Students in private schools in grades 1 to 8 (elementary and middle school): 54
Here:
20.7%
Michigan:
12.4%
Students in private schools in grades 9 to 12 (high school): 24
Here:
9.9%
Michigan:
9.8%
Students in private undergraduate colleges: 10
Here:
9.8%
Michigan:
14.9%
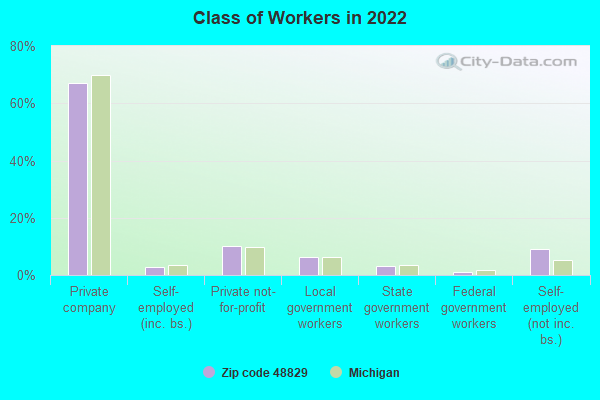
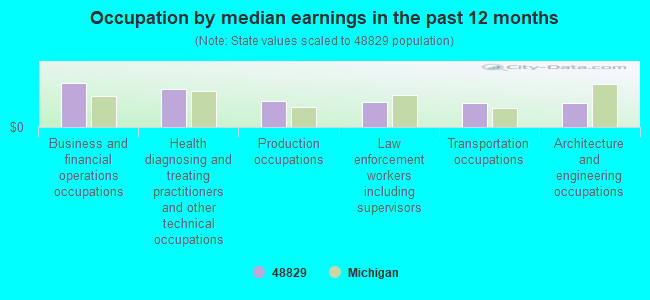
Occupation by median earnings in the past 12 months ($)
112,862Business and financial operations occupations
97,350Health diagnosing and treating practitioners and other technical occupations
66,044Production occupations
65,154Law enforcement workers including supervisors
62,632Transportation occupations
60,418Architecture and engineering occupations
Top industries in this zip code by the number of employees in 2005:
Health Care and Social Assistance: Offices of Physicians (except Mental Health Specialists) (10-19: 2, 5-9: 1, 1-4: 3)
Accommodation and Food Services: Full-Service Restaurants (20-49: 1)
Administrative and Support and Waste Management and Remediation Services: Temporary Help Services (20-49: 1)
Construction: Oil and Gas Pipeline and Related Structures Construction (20-49: 1)
People in group quarters in 2010:
49 people in group homes intended for adults
2 people in college/university student housing
People in group quarters in 2000:
19 people in other group homes
11 people in other noninstitutional group quarters
9 people in homes for the mentally retarded
6 people in homes for the physically handicapped
Fatal accident statistics in 2014:
Fatal accident count: 1
Vehicles involved in fatal accidents: 1
Fatal accidents caused by drunken drivers: 0
Fatalities: 2
Persons involved in fatal accidents: 3
Pedestrians involved in fatal accidents: 0
Fatal accident statistics in 2013:
Fatal accident count: 2
Vehicles involved in fatal accidents: 3
Fatal accidents caused by drunken drivers: 2
Fatalities: 2
Persons involved in fatal accidents: 3
Pedestrians involved in fatal accidents: 0
2002 - 2018 National Fire Incident Reporting System (NFIRS) incidents
Based on the data from the years 2002 - 2018 the average number of fire incidents per year is 13. The highest number of fires - 39 took place in 2003, and the least - 0 in 2005. The data has an increasing trend.
When looking into fire subcategories, the most reports belonged to: Structure Fires (46.6%), and Outside Fires (37.6%).
Fire incident types reported to NFIRS in Zip Code 48829


 Nearest zip codes: 48852, 48891, 49310, 48888, 48886, 48896.


 Based on the data from the years 2002 - 2018 the average number of fire incidents per year is 13. The highest number of fires - 39 took place in 2003, and the least - 0 in 2005. The data has an increasing trend.
 When looking into fire subcategories, the most reports belonged to: Structure Fires (46.6%), and Outside Fires (37.6%).