Estimated zip code population in 2022: 2,945 Zip code population in 2010: 3,016 Zip code population in 2000: 2,757
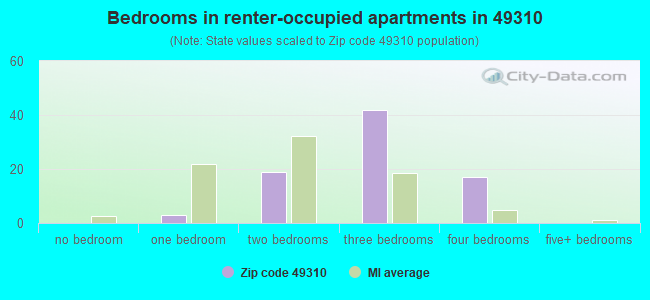
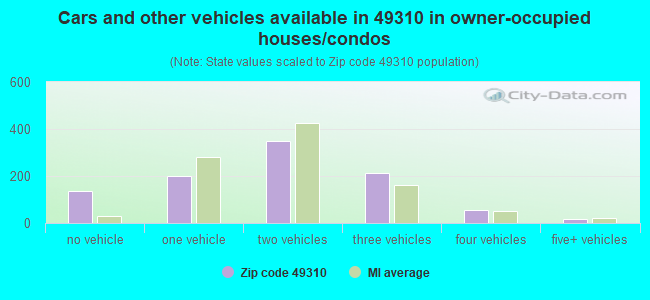
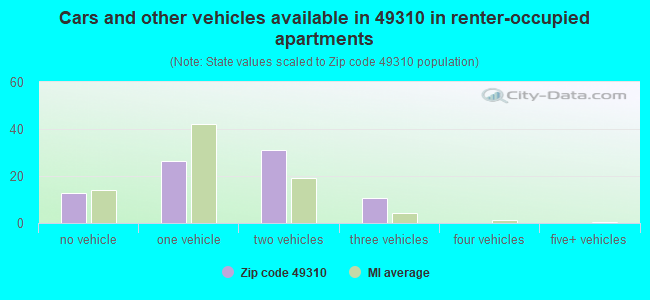
Houses and condos: 1,177 Renter-occupied apartments: 81
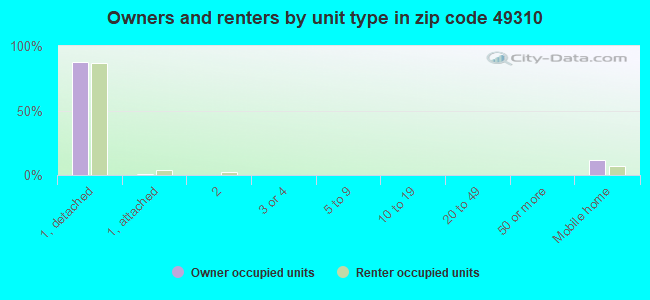
% of renters here:
8%
State:
27%
March 2022 cost of living index in zip code 49310: 80.7 (low, U.S. average is 100)
Land area: 89.2 sq. mi. Water area: 0.2 sq. mi.
Population density: 33 people per square mile
(very low).
OSM Map
General Map
Google Map
MSN Map
OSM Map
General Map
Google Map
MSN Map
OSM Map
General Map
Google Map
MSN Map
OSM Map
General Map
Google Map
MSN Map
Please wait while loading the map...
Real estate property taxes paid for housing units in 2022:
This zip code:
1.1% ($1,837)
Michigan:
1.2% ($2,746)
Median real estate property taxes paid for housing units with mortgages in 2022: $1,862 (1.1%) Median real estate property taxes paid for housing units with no mortgage in 2022: $1,818 (1.0%)
Business Search- 14 Million verified businesses
Males: 1,543
(52.4%)
Females: 1,401
(47.6%)
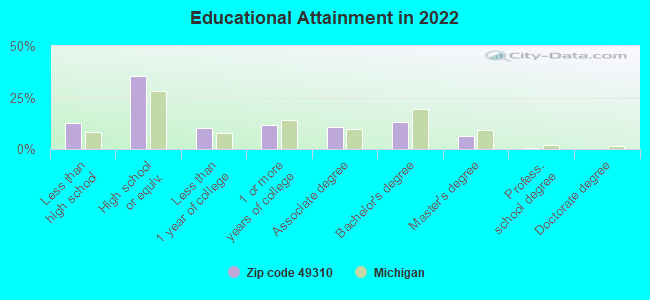
For population 25 years and over in 49310:
High school or higher: 86.1%
Bachelor's degree or higher: 19.8%
Graduate or professional degree: 6.9%
Unemployed: 4.0%
Mean travel time to work (commute): 25.8 minutes
For population 15 years and over in 49310:
Never married: 32.9%
Now married: 50.0%
Separated: 0.4%
Widowed: 6.7%
Divorced: 10.0%
Zip code 49310 compared to state average:
Black race population percentage significantly below state average.
Foreign-born population percentage significantly below state average.
Renting percentage significantly below state average.
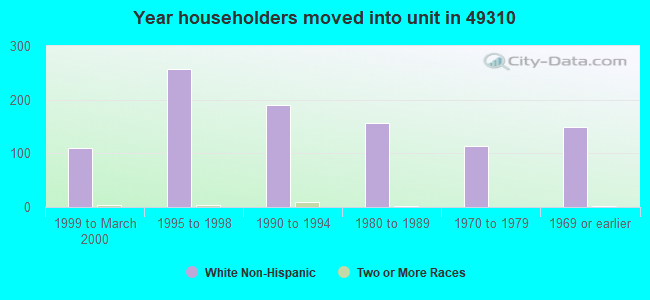
Length of stay since moving in above state average.
Percentage of population with a bachelor's degree or higher below state average.
Estimated median house/condo value in 2022: $172,066
49310:
$172,066
Michigan:
$224,400
According to our research of Michigan and other state lists, there were 11 registered sex offenders living in 49310 zip code as of June 09, 2024. The ratio of all residents to sex offenders in zip code 49310 is 329 to 1. The ratio of registered sex offenders to all residents in this zip code is near the state average.
Median resident age:
This zip code:
37.7 years
Michigan median age:
40.3 years
Average household size:
This zip code:
2.8 people
Michigan:
2.4 people
Averages for the 2020 tax year for zip code 49310, filed in 2021:
Average Adjusted Gross Income (AGI) in 2020: $48,952 (Individual Income Tax Returns)
Here:
$48,952
State:
$68,945
Salary/wage: $42,709 (reported on 75.8% of returns)
Here:
$42,709
State:
$57,142
(% of AGI for various income ranges: 957.4% for AGIs below $25k, 3264.3% for AGIs $25k-50k, 5935.0% for AGIs $50k-75k, 8776.2% for AGIs $75k-100k, 16363.7% for AGIs $100k-200k)
Taxable interest for individuals: $1,056 (reported on 29.0% of returns)
This zip code:
$1,056
Michigan:
$1,630
(% of AGI for various income ranges: 24.4% for AGIs below $25k, 21.1% for AGIs $25k-50k, 65.7% for AGIs $50k-75k, 31.2% for AGIs $75k-100k, 172.5% for AGIs $100k-200k)
Ordinary dividends: $2,257 (reported on 18.5% of returns)
Here:
$2,257
State:
$6,972
(% of AGI for various income ranges: 31.5% for AGIs below $25k, 39.6% for AGIs $25k-50k, 70.0% for AGIs $50k-75k, 120.0% for AGIs $75k-100k, 161.2% for AGIs $100k-200k)
Net capital gain/loss in AGI: +$7,318 (reported on 13.7% of returns)
Here:
+$7,318
State:
+$20,064
(% of AGI for various income ranges: 19.6% for AGIs below $25k, 34.3% for AGIs $25k-50k, 104.3% for AGIs $50k-75k, 175.0% for AGIs $75k-100k, 1011.3% for AGIs $100k-200k)
Profit/loss from business: +$6,017 (reported on 14.5% of returns)
Here:
+$6,017
State:
+$11,172
(% of AGI for various income ranges: 110.0% for AGIs below $25k, 100.4% for AGIs $25k-50k, 322.9% for AGIs $50k-75k, 66.2% for AGIs $100k-200k)
Taxable individual retirement arrangement distribution: $13,523 (reported on 10.5% of returns)
49310:
$13,523
Michigan:
$19,803
(% of AGI for various income ranges: 86.3% for AGIs below $25k, 108.6% for AGIs $25k-50k, 315.7% for AGIs $50k-75k, 973.8% for AGIs $100k-200k)
Total itemized deductions: $32,800 (reported on 1.6% of returns)
Here:
$32,800
State:
$34,117
(% of AGI for various income ranges: 234.3% for AGIs $25k-50k)
Taxes paid: $7,250 (reported on 1.6% of returns)
49310:
$7,250
State:
$7,972
(% of AGI for various income ranges: 51.8% for AGIs $25k-50k)
Earned income credit: $2,100 (reported on 14.5% of returns)
Here:
$2,100
State:
$2,251
(% of AGI for various income ranges: 66.3% for AGIs below $25k, 71.1% for AGIs $25k-50k)
Percentage of individuals using paid preparers for their 2020 taxes: 93.5%
Here:
94%
State:
93%
(% for various income ranges: 90.7% for AGIs below $25k, 94.4% for AGIs $25k-50k, 95.0% for AGIs $50k-75k, 100.0% for AGIs $75k-100k, 91.7% for AGIs $100k-200k, 100.0% for AGIs over 200k)
Averages for the 2012 tax year for zip code 49310, filed in 2013:
Average Adjusted Gross Income (AGI) in 2012: $41,054 (Individual Income Tax Returns)
Here:
$41,054
State:
$55,609
Salary/wage: $35,814 (reported on 78.6% of returns)
Here:
$35,814
State:
$46,782
(% of AGI for various income ranges: 61.5% for AGIs below $25k, 74.9% for AGIs $25k-50k, 75.0% for AGIs $50k-75k, 68.9% for AGIs $75k-100k, 59.6% for AGIs $100k-200k)
Taxable interest for individuals: $1,021 (reported on 32.5% of returns)
This zip code:
$1,021
Michigan:
$1,491
(% of AGI for various income ranges: 2.1% for AGIs below $25k, 0.5% for AGIs $25k-50k, 0.5% for AGIs $50k-75k, 0.6% for AGIs $75k-100k, 0.8% for AGIs $100k-200k)
Ordinary dividends: $2,886 (reported on 18.8% of returns)
Here:
$2,886
State:
$6,225
(% of AGI for various income ranges: 1.8% for AGIs below $25k, 1.0% for AGIs $25k-50k, 1.0% for AGIs $50k-75k, 1.3% for AGIs $75k-100k, 1.8% for AGIs $100k-200k)
Net capital gain/loss in AGI: +$3,743 (reported on 12.0% of returns)
Here:
+$3,743
State:
+$9,326
(% of AGI for various income ranges: 0.9% for AGIs below $25k, 0.7% for AGIs $50k-75k, 3.6% for AGIs $100k-200k)
Profit/loss from business: +$6,933 (reported on 15.4% of returns)
Here:
+$6,933
State:
+$11,523
(% of AGI for various income ranges: 8.4% for AGIs below $25k, 2.1% for AGIs $25k-50k, 0.5% for AGIs $50k-75k, 5.3% for AGIs $75k-100k)
Taxable individual retirement arrangement distribution: $9,160 (reported on 8.5% of returns)
49310:
$9,160
Michigan:
$15,298
(% of AGI for various income ranges: 2.7% for AGIs below $25k, 4.5% for AGIs $25k-50k, 3.1% for AGIs $75k-100k)
Total itemized deductions: $15,516 (21% of AGI, reported on 21.4% of returns)
Here:
$15,516
State:
$21,628
Here:
21.4% of AGI
State:
18.4% of AGI
(% of AGI for various income ranges: 5.8% for AGIs below $25k, 6.1% for AGIs $25k-50k, 9.2% for AGIs $50k-75k, 7.9% for AGIs $75k-100k, 10.3% for AGIs $100k-200k)
Charity contributions: $3,500 (reported on 13.7% of returns)
Here:
$3,500
State:
$4,225
(% of AGI for various income ranges: 0.8% for AGIs $25k-50k, 1.3% for AGIs $50k-75k, 1.7% for AGIs $75k-100k, 1.6% for AGIs $100k-200k)
Taxes paid: $5,104 (reported on 21.4% of returns)
49310:
$5,104
State:
$8,327
(% of AGI for various income ranges: 0.9% for AGIs below $25k, 1.7% for AGIs $25k-50k, 2.5% for AGIs $50k-75k, 2.8% for AGIs $75k-100k, 4.5% for AGIs $100k-200k)
Earned income credit: $2,119 (reported on 17.9% of returns)
Here:
$2,119
State:
$2,306
(% of AGI for various income ranges: 5.2% for AGIs below $25k, 1.1% for AGIs $25k-50k)
Percentage of individuals using paid preparers for their 2012 taxes: 61.5%
Here:
62%
State:
57%
(% for various income ranges: 51.0% for AGIs below $25k, 61.3% for AGIs $25k-50k, 68.4% for AGIs $50k-75k, 80.0% for AGIs $75k-100k, 87.5% for AGIs $100k-200k)
Averages for the 2004 tax year for zip code 49310, filed in 2005:
Average Adjusted Gross Income (AGI) in 2004: $36,167 (Individual Income Tax Returns)
Here:
$36,167
State:
$48,204
Salary/wage: $33,749 (reported on 83.3% of returns)
Here:
$33,749
State:
$42,791
(% of AGI for various income ranges: 181.3% for AGIs below $10k, 69.9% for AGIs $10k-25k, 83.7% for AGIs $25k-50k, 82.9% for AGIs $50k-75k, 81.8% for AGIs $75k-100k, 52.8% for AGIs over 100k)
Taxable interest for individuals: $980 (reported on 46.2% of returns)
This zip code:
$980
Michigan:
$1,725
(% of AGI for various income ranges: 13.2% for AGIs below $10k, 3.0% for AGIs $10k-25k, 0.7% for AGIs $25k-50k, 1.0% for AGIs $50k-75k, 0.2% for AGIs $75k-100k, 1.6% for AGIs over 100k)
Taxable dividends: $2,866 (reported on 21.1% of returns)
Here:
$2,866
State:
$3,420
(% of AGI for various income ranges: 4.4% for AGIs below $10k, 2.1% for AGIs $10k-25k, 1.2% for AGIs $25k-50k, 1.0% for AGIs $50k-75k, 0.9% for AGIs $75k-100k, 3.8% for AGIs over 100k)
Net capital gain/loss: +$5,655 (reported on 14.5% of returns)
Here:
+$5,655
State:
+$8,532
(% of AGI for various income ranges: -3.7% for AGIs below $10k, 0.1% for AGIs $10k-25k, 0.9% for AGIs $25k-50k, 1.7% for AGIs $50k-75k, 2.8% for AGIs $75k-100k, 7.2% for AGIs over 100k)
Profit/loss from business: +$4,206 (reported on 18.6% of returns)
Here:
+$4,206
State:
+$9,547
(% of AGI for various income ranges: 8.4% for AGIs below $10k, 6.8% for AGIs $10k-25k, 1.8% for AGIs $25k-50k, 0.0% for AGIs $50k-75k, 5.0% for AGIs $75k-100k)
IRA payment deduction: $2,622 (reported on 3.1% of returns)
49310:
$2,622
Michigan:
$2,875
Total itemized deductions: $14,305 (24% of AGI, reported on 24.8% of returns)
Here:
$14,305
State:
$18,509
Here:
23.6% of AGI
State:
20.7% of AGI
(% of AGI for various income ranges: 9.2% for AGIs $10k-25k, 8.9% for AGIs $25k-50k, 8.9% for AGIs $50k-75k, 10.1% for AGIs $75k-100k, 13.7% for AGIs over 100k)
Charity contributions deductions: $2,574 (4% of AGI, reported on 19.6% of returns)
Here:
$2,574
State:
$3,365
Here:
3.9% of AGI
State:
3.6% of AGI
(% of AGI for various income ranges: 1.3% for AGIs $10k-25k, 1.1% for AGIs $25k-50k, 1.3% for AGIs $50k-75k, 1.6% for AGIs $75k-100k, 2.1% for AGIs over 100k)
Total tax: $4,150 (reported on 75.0% of returns)
49310:
$4,150
State:
$7,691
(% of AGI for various income ranges: 8.1% for AGIs below $10k, 4.4% for AGIs $10k-25k, 6.1% for AGIs $25k-50k, 8.1% for AGIs $50k-75k, 10.6% for AGIs $75k-100k, 15.2% for AGIs over 100k)
Earned income credit: $1,654 (reported on 15.4% of returns)
Here:
$1,654
State:
$1,737
Percentage of individuals using paid preparers for their 2004 taxes: 68.3%
Here:
68%
State:
60%
(% for various income ranges: 63.6% for AGIs below $10k, 65.5% for AGIs $10k-25k, 69.7% for AGIs $25k-50k, 72.5% for AGIs $50k-75k, 69.2% for AGIs $75k-100k, 78.0% for AGIs over 100k)
Household received Food Stamps/SNAP in the past 12 months: 111 Household did not receive Food Stamps/SNAP in the past 12 months: 944
Women who had a birth in the past 12 months: 72 (37 now married, 34 unmarried) Women who did not have a birth in the past 12 months: 541 (249 now married, 291 unmarried)
Housing units in zip code 49310 with a mortgage: 419 (32 second mortgage, 12 both second mortgage and home equity loan) Houses without a mortgage: 10
Median monthly owner costs for units with a mortgage: $1,165 Median monthly owner costs for units without a mortgage: $467
Residents with income below the poverty level in 2022:
This zip code:
18.3%
Whole state:
13.4%
Residents with income below 50% of the poverty level in 2022:
This zip code:
9.7%
Whole state:
6.9%
Median number of rooms in houses and condos:
Here:
6.5
State:
6.5
Median number of rooms in apartments:
Here:
6.0
State:
4.3
Notable locations in this zip code not listed on our city pages
Churches in zip code 49310 include: Winn United Methodist Church (A), Free Methodist Church (B), Blanchard Wesleyan Church (C), Church of God (D), United by Faith Christian Church (E), Pleasant View Church (F), Pine River Church (G), Trinity Church (H). Display/hide their locations on the map
Cemeteries: Blanchard Cemetery (1), Rolland Township Cemetery (2), Union Cemetery (3), Decker Cemetery (4), Pine River Cemetery (5). Display/hide their locations on the map
Lakes: Rigglees Lake (A), Johnson Pond (B), Demont Lake (C), Clear Lake (D), Carney Lake (E), Bullhead Lake (F), Blanchard Millpond (G), Black Lakes (H). Display/hide their locations on the map
Rivers and creeks: Jewel Creek (A), South Branch Pine River (B), Skunk Creek (C), Miller Creek (D), Decker Creek (E), Pony Creek (F). Display/hide their locations on the map
643 married couples with children.
143 single-parent households (45 men, 98 women).
82.7% of residents of 49310 zip code speak English at home.
0.1% of residents speak Spanish at home (100% very well).
16.5% of residents speak other Indo-European language at home (72% very well, 24% well, 4% not well).
0.3% of residents speak Asian or Pacific Island language at home (100% very well).
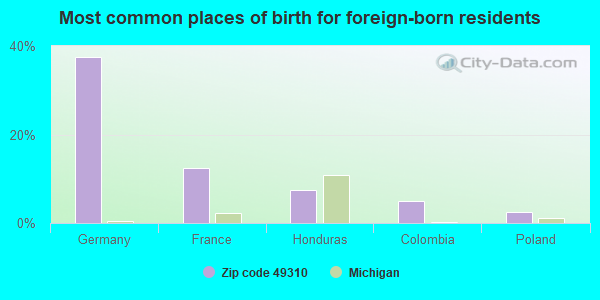
Foreign born population: 39 (1.4%) (53.8% of them are naturalized citizens)
This zip code:
1.4%
Whole state:
6.9%
38%Germany
12%France
8%Honduras
5%Colombia
2%Poland
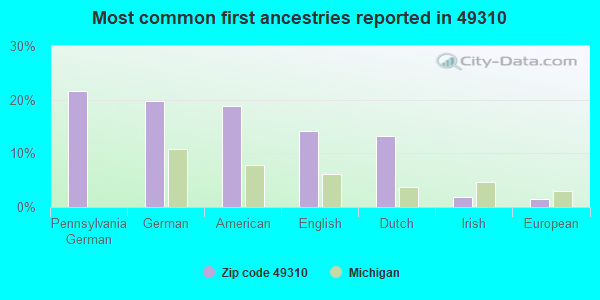
22%Pennsylvania German
20%German
19%American
14%English
13%Dutch
2%Irish
1%European
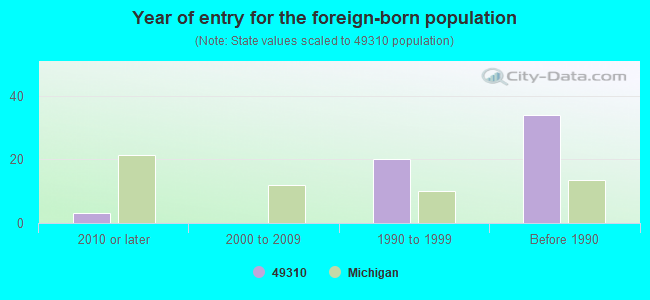
Year of entry for the foreign-born population
32010 or later
02000 to 2009
201990 to 1999
34Before 1990
Facilities with environmental interests located in this zip code:
BLANCHARD ELEMENTARY SCHOOL (405 S. 4TH STREET in BLANCHARD, MI)
(National Center for Education Statistics) - STATE ID-00346 Organizations: MONTABELLA COMMUNITY SCHOOLS (SCHOOL DISTRICT)
BLANCHARD LANES (58 JACKSON RD. in BLANCHARD,, MI)
ENFORCEMENT/COMPLIANCE ACTIVITY (Integrated Compliance Information System)
Housing units lacking complete plumbing facilities: 5.7% Housing units lacking complete kitchen facilities: 6.0%
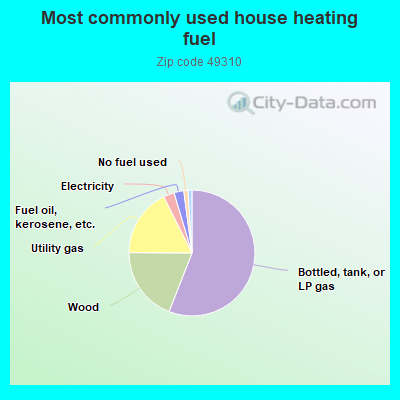
56.0%Bottled, tank, or LP gas
19.2%Wood
17.5%Utility gas
2.8%Electricity
2.5%Fuel oil, kerosene, etc.
1.1%No fuel used
1.0%Other fuel
Population in 1990: 2,473. Population change in the 1990s: +284 (+11.5%).
Place of birth for U.S.-born residents:
This state: 2,369
Northeast: 34
Midwest: 346
South: 60
West: 72
66% of the 49310 zip code residents lived in the same house 5 years ago. Out of people who lived in different houses, 42% lived in this county. Out of people who lived in different counties, 50% lived in Michigan.
92% of the 49310 zip code residents lived in the same house 1 year ago. Out of people who lived in different houses, 6% moved from this county. Out of people who lived in different houses, 88% moved from different county within same state. Out of people who lived in different houses, 2% moved from different state. Out of people who lived in different houses, 3% moved from abroad.
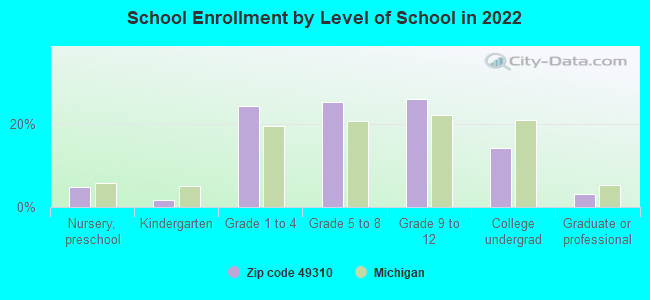
Private vs. public school enrollment:
Students in private schools in grades 1 to 8 (elementary and middle school): 122
Here:
40.3%
Michigan:
12.4%
Students in private schools in grades 9 to 12 (high school): 20
Here:
12.8%
Michigan:
9.8%
Students in private undergraduate colleges:
Here:
0.0%
Michigan:
14.9%
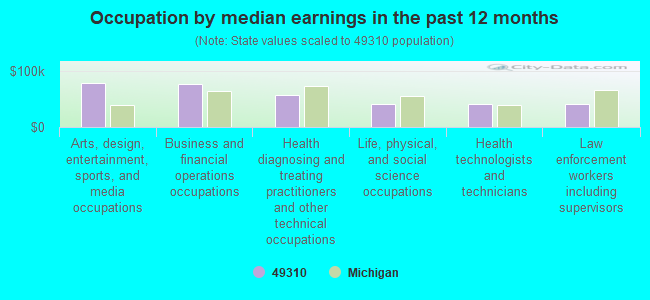
Occupation by median earnings in the past 12 months ($)
78,287Arts, design, entertainment, sports, and media occupations
76,220Business and financial operations occupations
57,502Health diagnosing and treating practitioners and other technical occupations
41,664Life, physical, and social science occupations
41,622Health technologists and technicians
41,192Law enforcement workers including supervisors
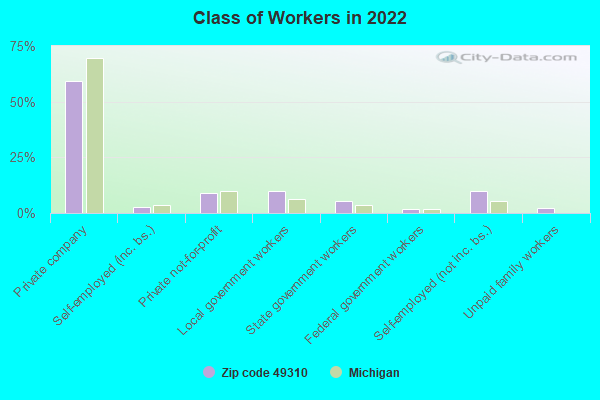
Top industries in this zip code by the number of employees in 2005:
Health Care and Social Assistance: Offices of Dentists (10-19: 1)
Construction: New Single-Family Housing Construction (except Operative Builders) (5-9: 1, 1-4: 1)
Fatal accident statistics in 2014:
Fatal accident count: 1
Vehicles involved in fatal accidents: 1
Fatal accidents caused by drunken drivers: 1
Fatalities: 1
Persons involved in fatal accidents: 1
Pedestrians involved in fatal accidents: 0
2002 - 2018 National Fire Incident Reporting System (NFIRS) incidents
According to the data from the years 2002 - 2018 the average number of fire incidents per year is 24. The highest number of fires - 43 took place in 2003, and the least - 14 in 2011. The data has an increasing trend.
When looking into fire subcategories, the most reports belonged to: Outside Fires (43.4%), and Structure Fires (41.7%).
Fire incident types reported to NFIRS in Zip Code 49310

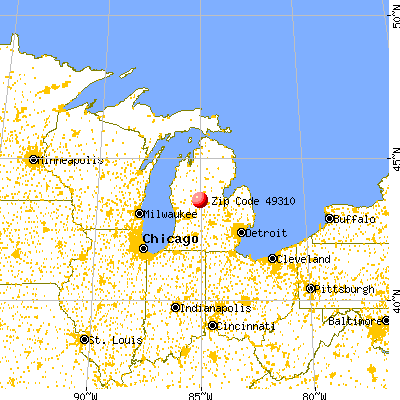


 Nearest zip codes: 48829, 49340, 48896, 48886, 48852, 48891.


 According to the data from the years 2002 - 2018 the average number of fire incidents per year is 24. The highest number of fires - 43 took place in 2003, and the least - 14 in 2011. The data has an increasing trend.
 When looking into fire subcategories, the most reports belonged to: Outside Fires (43.4%), and Structure Fires (41.7%).