Estimated zip code population in 2022: 2,153 Zip code population in 2010: 2,090 Zip code population in 2000: 2,412
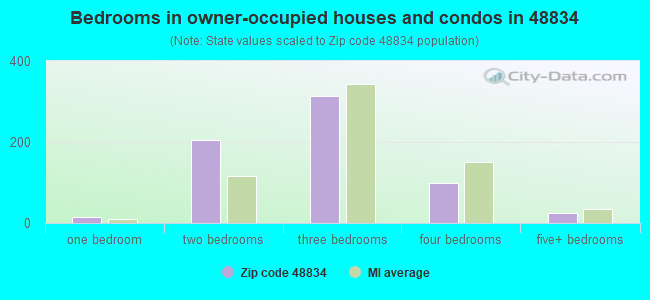
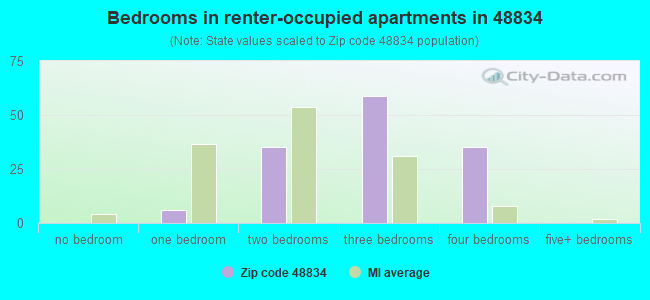
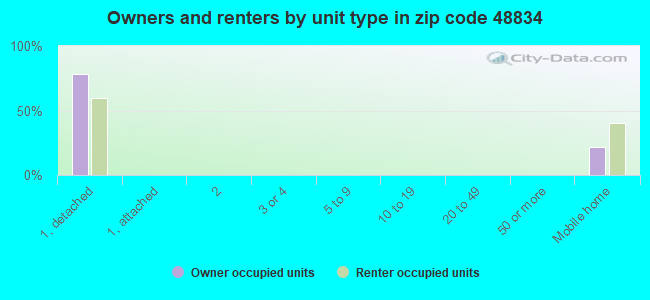
Houses and condos: 936 Renter-occupied apartments: 135
% of renters here:
17%
State:
27%
March 2022 cost of living index in zip code 48834: 81.4 (low, U.S. average is 100)
Land area: 46.3 sq. mi. Water area: 0.9 sq. mi.
Population density: 47 people per square mile
(very low).
OSM Map
General Map
Google Map
MSN Map
OSM Map
General Map
Google Map
MSN Map
OSM Map
General Map
Google Map
MSN Map
OSM Map
General Map
Google Map
MSN Map
Please wait while loading the map...
Real estate property taxes paid for housing units in 2022:
This zip code:
0.9% ($1,624)
Michigan:
1.2% ($2,746)
Median real estate property taxes paid for housing units with mortgages in 2022: $1,653 (0.9%) Median real estate property taxes paid for housing units with no mortgage in 2022: $1,598 (1.1%)
Business Search- 14 Million verified businesses
Males: 1,168
(54.3%)
Females: 985
(45.7%)
For population 25 years and over in 48834:
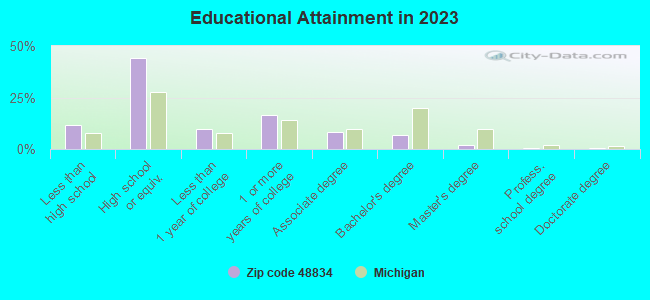
High school or higher: 86.9%
Bachelor's degree or higher: 7.1%
Graduate or professional degree: 2.9%
Unemployed: 3.5%
Mean travel time to work (commute): 33.5 minutes
For population 15 years and over in 48834:
Never married: 26.4%
Now married: 56.1%
Separated: 1.5%
Widowed: 5.9%
Divorced: 10.0%
Zip code 48834 compared to state average:
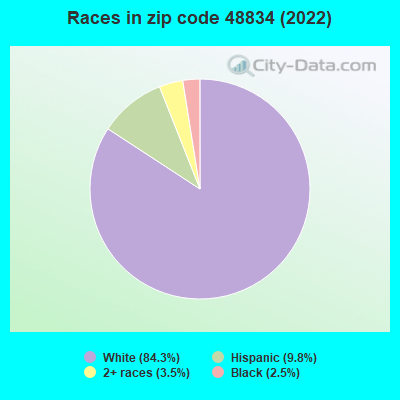
Black race population percentage significantly below state average.
Hispanic race population percentage above state average.
Renting percentage below state average.
Length of stay since moving in significantly above state average.
Number of college students below state average.
Percentage of population with a bachelor's degree or higher significantly below state average.
Averages for the 2020 tax year for zip code 48834, filed in 2021:
Average Adjusted Gross Income (AGI) in 2020: $46,005 (Individual Income Tax Returns)
Here:
$46,005
State:
$68,945
Salary/wage: $42,337 (reported on 76.1% of returns)
Here:
$42,337
State:
$57,142
(% of AGI for various income ranges: 1019.3% for AGIs below $25k, 3248.4% for AGIs $25k-50k, 5993.1% for AGIs $50k-75k, 8431.4% for AGIs $75k-100k, 14960.0% for AGIs $100k-200k)
Taxable interest for individuals: $457 (reported on 21.1% of returns)
This zip code:
$457
Michigan:
$1,630
(% of AGI for various income ranges: 11.1% for AGIs below $25k, 13.2% for AGIs $25k-50k, 6.2% for AGIs $50k-75k, 14.3% for AGIs $75k-100k, 32.9% for AGIs $100k-200k)
Ordinary dividends: $2,600 (reported on 8.3% of returns)
Here:
$2,600
State:
$6,972
(% of AGI for various income ranges: 8.9% for AGIs below $25k, 20.4% for AGIs $25k-50k, 225.7% for AGIs $75k-100k)
Net capital gain/loss in AGI: +$3,278 (reported on 8.3% of returns)
Here:
+$3,278
State:
+$20,064
(% of AGI for various income ranges: 35.7% for AGIs below $25k, 16.2% for AGIs $50k-75k, 248.6% for AGIs $100k-200k)
Profit/loss from business: +$10,340 (reported on 13.8% of returns)
Here:
+$10,340
State:
+$11,172
(% of AGI for various income ranges: 77.1% for AGIs below $25k, 264.0% for AGIs $25k-50k, 345.4% for AGIs $50k-75k, 322.9% for AGIs $75k-100k)
Taxable individual retirement arrangement distribution: $10,644 (reported on 8.3% of returns)
48834:
$10,644
Michigan:
$19,803
(% of AGI for various income ranges: 65.7% for AGIs below $25k, 168.8% for AGIs $25k-50k, 502.9% for AGIs $75k-100k)
Earned income credit: $2,479 (reported on 17.4% of returns)
Here:
$2,479
State:
$2,251
(% of AGI for various income ranges: 93.6% for AGIs below $25k, 83.6% for AGIs $25k-50k)
Percentage of individuals using paid preparers for their 2020 taxes: 94.5%
Here:
94%
State:
93%
(% for various income ranges: 95.0% for AGIs below $25k, 93.5% for AGIs $25k-50k, 94.4% for AGIs $50k-75k, 90.0% for AGIs $75k-100k, 100.0% for AGIs $100k-200k)
Averages for the 2012 tax year for zip code 48834, filed in 2013:
Average Adjusted Gross Income (AGI) in 2012: $38,926 (Individual Income Tax Returns)
Here:
$38,926
State:
$55,609
Salary/wage: $34,972 (reported on 81.4% of returns)
Here:
$34,972
State:
$46,782
(% of AGI for various income ranges: 64.5% for AGIs below $25k, 75.8% for AGIs $25k-50k, 77.6% for AGIs $50k-75k, 82.2% for AGIs $75k-100k, 65.9% for AGIs $100k-200k)
Taxable interest for individuals: $504 (reported on 26.8% of returns)
This zip code:
$504
Michigan:
$1,491
(% of AGI for various income ranges: 0.8% for AGIs below $25k, 0.6% for AGIs $25k-50k, 0.2% for AGIs $50k-75k, 0.2% for AGIs $75k-100k)
Ordinary dividends: $1,040 (reported on 10.3% of returns)
Here:
$1,040
State:
$6,225
(% of AGI for various income ranges: 0.4% for AGIs below $25k, 0.4% for AGIs $25k-50k, 0.4% for AGIs $50k-75k, 0.3% for AGIs $75k-100k)
Net capital gain/loss in AGI: +$1,011 (reported on 9.3% of returns)
Here:
+$1,011
State:
+$9,326
Profit/loss from business: +$9,164 (reported on 14.4% of returns)
Here:
+$9,164
State:
+$11,523
(% of AGI for various income ranges: 5.7% for AGIs below $25k, 1.8% for AGIs $25k-50k, 3.2% for AGIs $50k-75k, 6.0% for AGIs $100k-200k)
Taxable individual retirement arrangement distribution: $7,875 (reported on 8.2% of returns)
48834:
$7,875
Michigan:
$15,298
(% of AGI for various income ranges: 3.2% for AGIs below $25k, 1.9% for AGIs $25k-50k, 3.4% for AGIs $50k-75k)
Total itemized deductions: $16,662 (21% of AGI, reported on 16.5% of returns)
Here:
$16,662
State:
$21,628
Here:
20.7% of AGI
State:
18.4% of AGI
(% of AGI for various income ranges: 4.1% for AGIs below $25k, 6.5% for AGIs $25k-50k, 6.1% for AGIs $50k-75k, 7.0% for AGIs $75k-100k, 10.2% for AGIs $100k-200k)
Charity contributions: $2,567 (reported on 12.4% of returns)
Here:
$2,567
State:
$4,225
(% of AGI for various income ranges: 0.8% for AGIs $25k-50k, 1.6% for AGIs $50k-75k, 1.0% for AGIs $100k-200k)
Taxes paid: $5,944 (reported on 16.5% of returns)
48834:
$5,944
State:
$8,327
(% of AGI for various income ranges: 1.1% for AGIs below $25k, 1.9% for AGIs $25k-50k, 1.7% for AGIs $50k-75k, 2.3% for AGIs $75k-100k, 4.9% for AGIs $100k-200k)
Earned income credit: $2,132 (reported on 22.7% of returns)
Here:
$2,132
State:
$2,306
(% of AGI for various income ranges: 6.9% for AGIs below $25k, 1.1% for AGIs $25k-50k)
Percentage of individuals using paid preparers for their 2012 taxes: 58.8%
Here:
59%
State:
57%
(% for various income ranges: 53.3% for AGIs below $25k, 62.5% for AGIs $25k-50k, 64.3% for AGIs $50k-75k, 57.1% for AGIs $75k-100k, 71.4% for AGIs $100k-200k)
Averages for the 2004 tax year for zip code 48834, filed in 2005:
Average Adjusted Gross Income (AGI) in 2004: $34,856 (Individual Income Tax Returns)
Here:
$34,856
State:
$48,204
Salary/wage: $33,267 (reported on 86.9% of returns)
Here:
$33,267
State:
$42,791
(% of AGI for various income ranges: 157.7% for AGIs below $10k, 75.5% for AGIs $10k-25k, 84.5% for AGIs $25k-50k, 88.9% for AGIs $50k-75k, 85.8% for AGIs $75k-100k, 59.7% for AGIs over 100k)
Taxable interest for individuals: $812 (reported on 39.7% of returns)
This zip code:
$812
Michigan:
$1,725
(% of AGI for various income ranges: 9.8% for AGIs below $10k, 1.6% for AGIs $10k-25k, 0.9% for AGIs $25k-50k, 0.8% for AGIs $50k-75k, 0.5% for AGIs $75k-100k, 0.2% for AGIs over 100k)
Taxable dividends: $1,190 (reported on 12.5% of returns)
Here:
$1,190
State:
$3,420
(% of AGI for various income ranges: 1.4% for AGIs below $10k, 0.8% for AGIs $10k-25k, 0.4% for AGIs $25k-50k, 0.1% for AGIs $50k-75k, 0.1% for AGIs $75k-100k, 1.4% for AGIs over 100k)
Net capital gain/loss: +$2,048 (reported on 10.8% of returns)
Here:
+$2,048
State:
+$8,532
(% of AGI for various income ranges: 0.6% for AGIs $10k-25k, 0.5% for AGIs $25k-50k, 1.1% for AGIs $50k-75k, 0.6% for AGIs $75k-100k, 0.2% for AGIs over 100k)
Profit/loss from business: +$3,573 (reported on 13.6% of returns)
Here:
+$3,573
State:
+$9,547
(% of AGI for various income ranges: 16.0% for AGIs below $10k, 4.5% for AGIs $10k-25k, 1.3% for AGIs $25k-50k, 0.8% for AGIs $50k-75k)
IRA payment deduction: $2,385 (reported on 1.3% of returns)
48834:
$2,385
Michigan:
$2,875
Total itemized deductions: $14,284 (24% of AGI, reported on 21.9% of returns)
Here:
$14,284
State:
$18,509
Here:
23.7% of AGI
State:
20.7% of AGI
(% of AGI for various income ranges: 9.1% for AGIs $10k-25k, 8.2% for AGIs $25k-50k, 7.1% for AGIs $50k-75k, 11.0% for AGIs $75k-100k, 13.7% for AGIs over 100k)
Charity contributions deductions: $1,976 (3% of AGI, reported on 17.0% of returns)
Here:
$1,976
State:
$3,365
Here:
3.1% of AGI
State:
3.6% of AGI
(% of AGI for various income ranges: 0.6% for AGIs $10k-25k, 0.9% for AGIs $25k-50k, 0.7% for AGIs $50k-75k, 1.1% for AGIs $75k-100k, 2.1% for AGIs over 100k)
Total tax: $3,923 (reported on 72.2% of returns)
48834:
$3,923
State:
$7,691
(% of AGI for various income ranges: 4.0% for AGIs below $10k, 4.0% for AGIs $10k-25k, 6.1% for AGIs $25k-50k, 8.2% for AGIs $50k-75k, 9.9% for AGIs $75k-100k, 16.8% for AGIs over 100k)
Earned income credit: $1,599 (reported on 15.2% of returns)
Here:
$1,599
State:
$1,737
Percentage of individuals using paid preparers for their 2004 taxes: 62.4%
Here:
62%
State:
60%
(% for various income ranges: 48.4% for AGIs below $10k, 63.4% for AGIs $10k-25k, 65.3% for AGIs $25k-50k, 68.6% for AGIs $50k-75k, 61.7% for AGIs $75k-100k, 84.6% for AGIs over 100k)
Household received Food Stamps/SNAP in the past 12 months: 108 Household did not receive Food Stamps/SNAP in the past 12 months: 680
Women who had a birth in the past 12 months: 21 (9 now married, 10 unmarried) Women who did not have a birth in the past 12 months: 376 (199 now married, 176 unmarried)
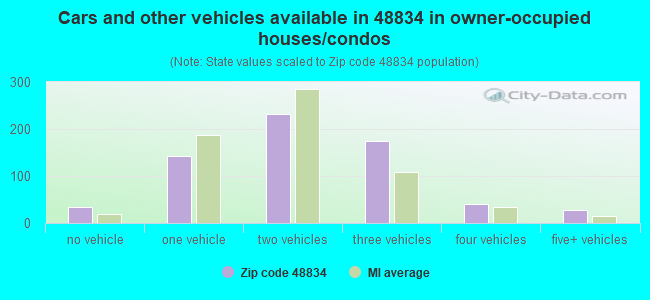
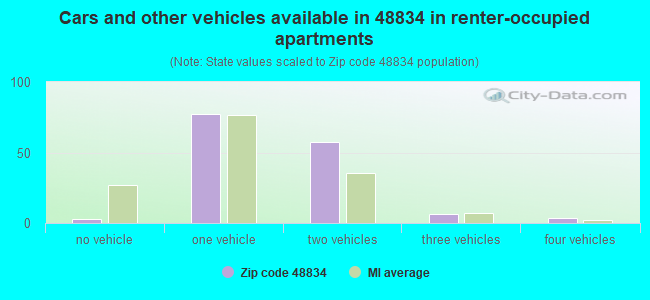
Housing units in zip code 48834 with a mortgage: 348 (29 second mortgage, 23 both second mortgage and home equity loan) Median monthly owner costs for units with a mortgage: $1,205 Median monthly owner costs for units without a mortgage: $509
Residents with income below the poverty level in 2022:
This zip code:
10.4%
Whole state:
13.4%
Residents with income below 50% of the poverty level in 2022:
This zip code:
5.4%
Whole state:
6.9%
Median number of rooms in houses and condos:
Here:
6.2
State:
6.5
Median number of rooms in apartments:
Here:
5.7
State:
4.3
Notable locations in this zip code not listed on our city pages
Notable locations in zip code 48834: Snow Lake Kampground (A), Hickory Hills Golf Course (B), Ronald Township Volunteer Fire Department (C). Display/hide their locations on the map
Lakes and swamps: Long Lake (A), Pickerel Lake (B), Woodard Lake (C), Horseshoe Lake (D), Hammell Lake (E), Grass Lake (F), Snow Lake (G), Clear Lake (H). Display/hide their locations on the map
Size of family households: 265 2-persons, 71 3-persons, 145 4-persons, 32 5-persons, 17 6-persons, 9 7-or-more-persons
Size of nonfamily households: 190 1-person, 41 2-persons, 13 3-persons
376 married couples with children.
100 single-parent households (72 men, 28 women).
91.0% of residents of 48834 zip code speak English at home.
5.9% of residents speak Spanish at home (80% very well, 11% well, 7% not well, 2% not at all).
2.4% of residents speak other Indo-European language at home (73% very well, 27% well).
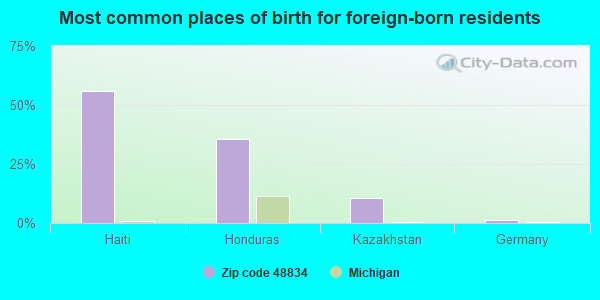
Foreign born population: 109 (5.1%) (14.0% of them are naturalized citizens)
This zip code:
5.1%
Whole state:
6.9%
48%Haiti
42%Honduras
3%Germany
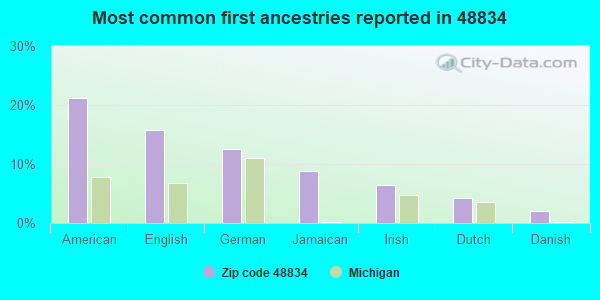
19%American
18%English
14%German
9%Jamaican
5%Irish
2%Danish
2%Dutch
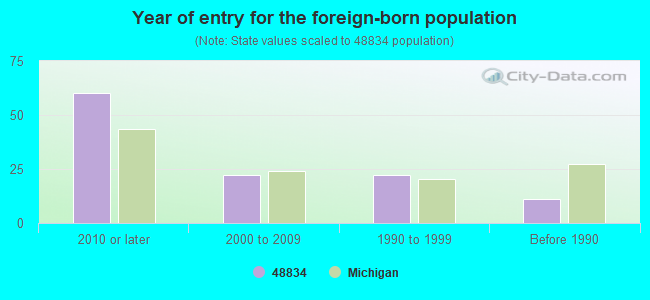
Year of entry for the foreign-born population
602010 or later
222000 to 2009
221990 to 1999
11Before 1990
Facilities with environmental interests located in this zip code:
H.O. STEELE ALTERNATIVE TO EXPULSION (10260 S. SHERIDAN ROAD in FENWICK, MI)
(National Center for Education Statistics) - STATE ID-08430 Organizations: MONTCALM AREA ISD (SCHOOL DISTRICT)
Housing units lacking complete plumbing facilities: 4.9% Housing units lacking complete kitchen facilities: 3.3%
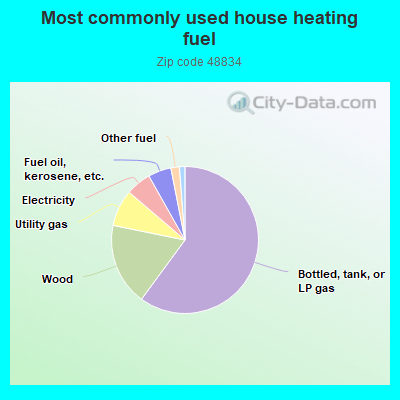
60.4%Bottled, tank, or LP gas
18.2%Wood
8.1%Utility gas
5.6%Electricity
5.1%Fuel oil, kerosene, etc.
1.9%Other fuel
1.2%No fuel used
Population in 1990: 1,440. Population change in the 1990s: +972 (+67.5%).
Place of birth for U.S.-born residents:
This state: 1,899
Northeast: 16
Midwest: 62
South: 34
West: 20
65% of the 48834 zip code residents lived in the same house 5 years ago. Out of people who lived in different houses, 49% lived in this county. Out of people who lived in different counties, 50% lived in Michigan.
95% of the 48834 zip code residents lived in the same house 1 year ago. Out of people who lived in different houses, 57% moved from this county. Out of people who lived in different houses, 29% moved from different county within same state. Out of people who lived in different houses, 15% moved from different state.
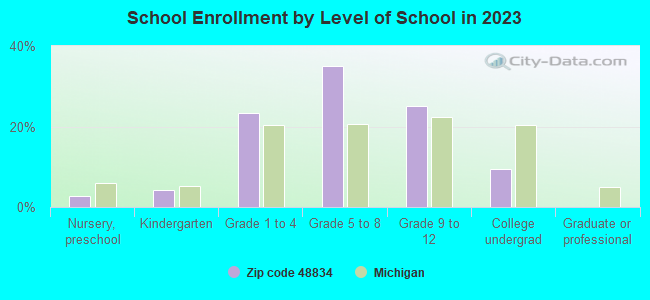
Private vs. public school enrollment:
Students in private schools in grades 1 to 8 (elementary and middle school): 33
Here:
12.1%
Michigan:
12.4%
Students in private schools in grades 9 to 12 (high school): 4
Here:
3.5%
Michigan:
9.8%
Students in private undergraduate colleges: 5
Here:
12.9%
Michigan:
14.9%
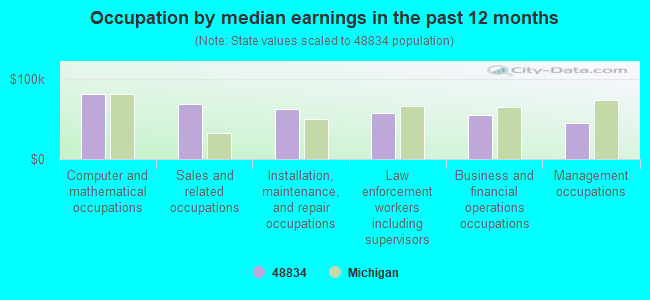
Occupation by median earnings in the past 12 months ($)
82,021Computer and mathematical occupations
68,633Sales and related occupations
62,206Installation, maintenance, and repair occupations
57,507Law enforcement workers including supervisors
54,685Business and financial operations occupations
45,506Management occupations
Top industries in this zip code by the number of employees in 2005:
Construction: Poured Concrete Foundation and Structure Contractors (5-9 employees: 1 establishment, 1-4 employees: 1 establishment)
Construction: Other Building Finishing Contractors (5-9: 1)
Construction: New Multifamily Housing Construction (except Operative Builders) (5-9: 1)
Administrative and Support and Waste Management and Remediation Services: Solid Waste Collection (5-9: 1)
Other Services (except Public Administration): Other Social Advocacy Organizations (1-4: 2)
Accommodation and Food Services: RV (Recreational Vehicle) Parks and Campgrounds (1-4: 1)
Accommodation and Food Services: Snack and Nonalcoholic Beverage Bars (1-4: 1)
People in group quarters in 2000:
14 people in other group homes
Home Mortgage Disclosure Act Aggregated Statistics For Year 2009 (Based on 4 partial tracts)
A) FHA, FSA/RHS & VA Home Purchase Loans
B) Conventional Home Purchase Loans
C) Refinancings
D) Home Improvement Loans
F) Non-occupant Loans on < 5 Family Dwellings (A B C & D)
G) Loans On Manufactured Home Dwelling (A B C & D)
Number
Average Value
Number
Average Value
Number
Average Value
Number
Average Value
Number
Average Value
Number
Average Value
LOANS ORIGINATED
4
$94,268
4
$77,035
41
$106,797
4
$18,690
2
$46,215
5
$78,802
APPLICATIONS APPROVED, NOT ACCEPTED
1
$41,850
1
$20,230
4
$91,585
0
$0
0
$0
1
$10,170
APPLICATIONS DENIED
2
$52,430
2
$47,985
13
$123,332
2
$17,230
1
$52,420
2
$81,985
APPLICATIONS WITHDRAWN
1
$69,590
1
$112,680
10
$108,384
0
$0
1
$89,440
0
$0
FILES CLOSED FOR INCOMPLETENESS
0
$0
0
$0
2
$52,625
0
$0
0
$0
0
$0
Aggregated Statistics For Year 2008 (Based on 4 partial tracts)
A) FHA, FSA/RHS & VA Home Purchase Loans
B) Conventional Home Purchase Loans
C) Refinancings
D) Home Improvement Loans
F) Non-occupant Loans on < 5 Family Dwellings (A B C & D)
G) Loans On Manufactured Home Dwelling (A B C & D)
Number
Average Value
Number
Average Value
Number
Average Value
Number
Average Value
Number
Average Value
Number
Average Value
LOANS ORIGINATED
5
$85,784
9
$99,006
30
$94,558
6
$22,873
3
$50,940
8
$71,435
APPLICATIONS APPROVED, NOT ACCEPTED
2
$65,075
1
$60,250
7
$108,720
0
$0
1
$44,520
2
$80,330
APPLICATIONS DENIED
2
$38,450
4
$49,920
19
$102,063
4
$43,862
2
$43,545
7
$77,304
APPLICATIONS WITHDRAWN
0
$0
2
$61,655
10
$117,811
0
$0
0
$0
1
$110,690
FILES CLOSED FOR INCOMPLETENESS
0
$0
0
$0
2
$109,090
0
$0
0
$0
0
$0
Aggregated Statistics For Year 2007 (Based on 4 partial tracts)
A) FHA, FSA/RHS & VA Home Purchase Loans
B) Conventional Home Purchase Loans
C) Refinancings
D) Home Improvement Loans
F) Non-occupant Loans on < 5 Family Dwellings (A B C & D)
G) Loans On Manufactured Home Dwelling (A B C & D)
Number
Average Value
Number
Average Value
Number
Average Value
Number
Average Value
Number
Average Value
Number
Average Value
LOANS ORIGINATED
3
$97,007
17
$94,599
39
$91,915
11
$42,994
4
$62,122
10
$57,225
APPLICATIONS APPROVED, NOT ACCEPTED
0
$0
3
$152,160
6
$107,027
0
$0
1
$39,470
1
$50,420
APPLICATIONS DENIED
1
$106,790
8
$73,368
30
$115,058
3
$51,993
2
$85,460
7
$77,394
APPLICATIONS WITHDRAWN
0
$0
2
$117,280
8
$161,955
1
$140,300
0
$0
1
$124,050
FILES CLOSED FOR INCOMPLETENESS
0
$0
2
$398,900
2
$117,365
0
$0
0
$0
0
$0
Aggregated Statistics For Year 2006 (Based on 4 partial tracts)
A) FHA, FSA/RHS & VA Home Purchase Loans
B) Conventional Home Purchase Loans
C) Refinancings
D) Home Improvement Loans
F) Non-occupant Loans on < 5 Family Dwellings (A B C & D)
G) Loans On Manufactured Home Dwelling (A B C & D)
Number
Average Value
Number
Average Value
Number
Average Value
Number
Average Value
Number
Average Value
Number
Average Value
LOANS ORIGINATED
4
$98,380
18
$93,171
48
$93,520
13
$38,061
4
$58,242
14
$52,629
APPLICATIONS APPROVED, NOT ACCEPTED
1
$72,120
4
$79,488
9
$103,089
1
$29,800
0
$0
2
$42,170
APPLICATIONS DENIED
1
$62,390
12
$69,412
46
$108,690
5
$68,950
3
$50,393
8
$48,415
APPLICATIONS WITHDRAWN
1
$36,250
5
$83,942
18
$116,388
2
$32,740
1
$76,710
2
$90,445
FILES CLOSED FOR INCOMPLETENESS
1
$53,550
1
$146,650
6
$124,478
0
$0
0
$0
0
$0
Aggregated Statistics For Year 2005 (Based on 4 partial tracts)
A) FHA, FSA/RHS & VA Home Purchase Loans
B) Conventional Home Purchase Loans
C) Refinancings
D) Home Improvement Loans
F) Non-occupant Loans on < 5 Family Dwellings (A B C & D)
G) Loans On Manufactured Home Dwelling (A B C & D)
Number
Average Value
Number
Average Value
Number
Average Value
Number
Average Value
Number
Average Value
Number
Average Value
LOANS ORIGINATED
2
$107,130
24
$101,432
66
$92,470
11
$37,675
3
$61,263
16
$62,846
APPLICATIONS APPROVED, NOT ACCEPTED
0
$0
4
$65,450
8
$95,704
0
$0
0
$0
2
$39,460
APPLICATIONS DENIED
0
$0
7
$89,236
48
$109,315
5
$44,764
1
$124,400
9
$77,269
APPLICATIONS WITHDRAWN
1
$48,380
5
$89,258
25
$107,636
4
$89,795
1
$93,940
2
$65,235
FILES CLOSED FOR INCOMPLETENESS
0
$0
1
$99,980
8
$135,406
1
$54,570
0
$0
0
$0
Aggregated Statistics For Year 2004 (Based on 4 partial tracts)
A) FHA, FSA/RHS & VA Home Purchase Loans
B) Conventional Home Purchase Loans
C) Refinancings
D) Home Improvement Loans
F) Non-occupant Loans on < 5 Family Dwellings (A B C & D)
G) Loans On Manufactured Home Dwelling (A B C & D)
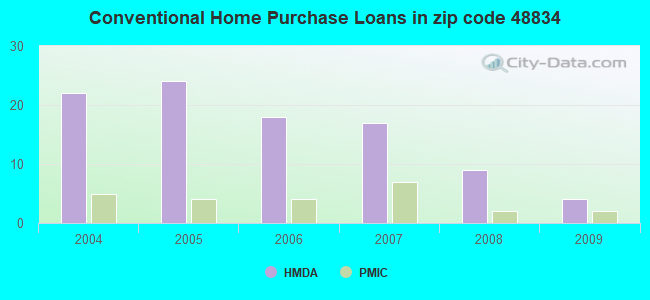
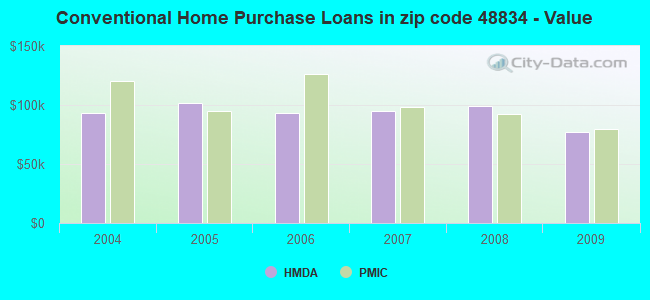
Detailed PMIC statistics for the following Tracts:0301.00
, 0304.00
2002 - 2018 National Fire Incident Reporting System (NFIRS) incidents
Based on the data from the years 2002 - 2018 the average number of fire incidents per year is 17. The highest number of fires - 25 took place in 2014, and the least - 10 in 2013. The data has an increasing trend.
When looking into fire subcategories, the most reports belonged to: Structure Fires (47.3%), and Outside Fires (37.2%).
Fire incident types reported to NFIRS in Zip Code 48834

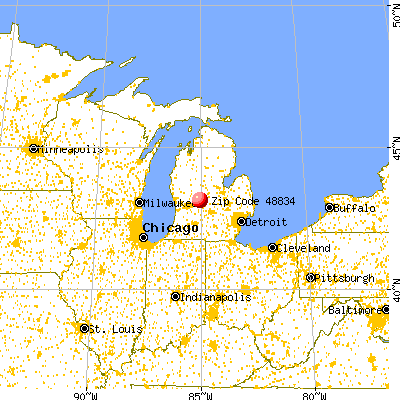


 Nearest zip codes: 48870, 48884, 48865, 48860, 48846, 48885.
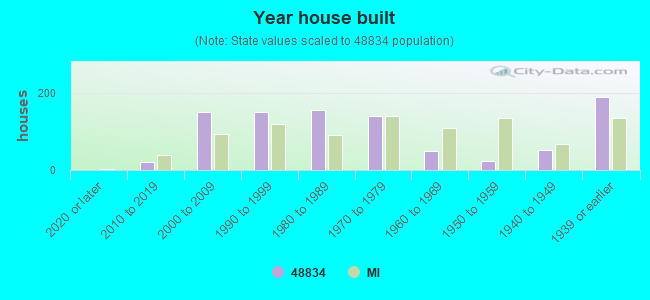


 Based on the data from the years 2002 - 2018 the average number of fire incidents per year is 17. The highest number of fires - 25 took place in 2014, and the least - 10 in 2013. The data has an increasing trend.
 When looking into fire subcategories, the most reports belonged to: Structure Fires (47.3%), and Outside Fires (37.2%).