Estimated zip code population in 2022: 4,645 Zip code population in 2010: 4,474 Zip code population in 2000: 4,698
Houses and condos: 2,037 Renter-occupied apartments: 315
% of renters here:
19%
State:
27%
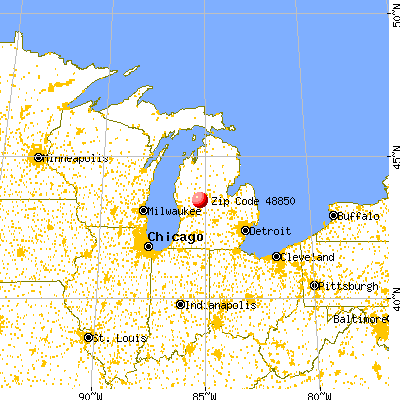
March 2022 cost of living index in zip code 48850: 80.4 (low, U.S. average is 100)
Land area: 80.8 sq. mi. Water area: 1.3 sq. mi.
Population density: 58 people per square mile
(very low).
OSM Map
General Map
Google Map
MSN Map
OSM Map
General Map
Google Map
MSN Map
OSM Map
General Map
Google Map
MSN Map
OSM Map
General Map
Google Map
MSN Map
Please wait while loading the map...
Real estate property taxes paid for housing units in 2022:
This zip code:
1.1% ($1,891)
Michigan:
1.2% ($2,746)
Median real estate property taxes paid for housing units with mortgages in 2022: $2,025 (1.2%) Median real estate property taxes paid for housing units with no mortgage in 2022: $1,809 (1.1%)
Averages for the 2020 tax year for zip code 48850, filed in 2021:
Average Adjusted Gross Income (AGI) in 2020: $48,390 (Individual Income Tax Returns)
Here:
$48,390
State:
$68,945
Salary/wage: $44,589 (reported on 75.2% of returns)
Here:
$44,589
State:
$57,142
(% of AGI for various income ranges: 1017.4% for AGIs below $25k, 3060.0% for AGIs $25k-50k, 6020.9% for AGIs $50k-75k, 9256.4% for AGIs $75k-100k, 14025.0% for AGIs $100k-200k)
Taxable interest for individuals: $839 (reported on 29.0% of returns)
This zip code:
$839
Michigan:
$1,630
(% of AGI for various income ranges: 24.0% for AGIs below $25k, 24.7% for AGIs $25k-50k, 30.5% for AGIs $50k-75k, 20.0% for AGIs $75k-100k, 129.3% for AGIs $100k-200k)
Ordinary dividends: $3,050 (reported on 12.4% of returns)
Here:
$3,050
State:
$6,972
(% of AGI for various income ranges: 17.8% for AGIs below $25k, 45.3% for AGIs $25k-50k, 41.8% for AGIs $50k-75k, 32.9% for AGIs $75k-100k, 252.1% for AGIs $100k-200k)
Net capital gain/loss in AGI: +$7,845 (reported on 10.5% of returns)
Here:
+$7,845
State:
+$20,064
(% of AGI for various income ranges: 15.0% for AGIs below $25k, 32.3% for AGIs $25k-50k, 80.9% for AGIs $50k-75k, 26.4% for AGIs $75k-100k, 917.1% for AGIs $100k-200k)
Profit/loss from business: +$12,024 (reported on 15.7% of returns)
Here:
+$12,024
State:
+$11,172
(% of AGI for various income ranges: 177.4% for AGIs below $25k, 238.3% for AGIs $25k-50k, 277.7% for AGIs $50k-75k, 301.4% for AGIs $75k-100k, 662.9% for AGIs $100k-200k)
Taxable individual retirement arrangement distribution: $11,028 (reported on 8.6% of returns)
48850:
$11,028
Michigan:
$19,803
(% of AGI for various income ranges: 63.4% for AGIs below $25k, 73.4% for AGIs $25k-50k, 139.1% for AGIs $50k-75k, 246.4% for AGIs $75k-100k, 480.0% for AGIs $100k-200k)
Total itemized deductions: $24,640 (reported on 2.4% of returns)
Here:
$24,640
State:
$34,117
(% of AGI for various income ranges: 137.2% for AGIs $25k-50k, 419.3% for AGIs $100k-200k)
Charity contributions: $4,950 (reported on 1.0% of returns)
Here:
$4,950
State:
$13,548
(% of AGI for various income ranges: 21.1% for AGIs $25k-50k)
Taxes paid: $6,360 (reported on 2.4% of returns)
48850:
$6,360
State:
$7,972
(% of AGI for various income ranges: 29.8% for AGIs $25k-50k, 127.1% for AGIs $100k-200k)
Earned income credit: $2,291 (reported on 16.2% of returns)
Here:
$2,291
State:
$2,251
(% of AGI for various income ranges: 85.4% for AGIs below $25k, 74.9% for AGIs $25k-50k)
Percentage of individuals using paid preparers for their 2020 taxes: 94.8%
Here:
95%
State:
93%
(% for various income ranges: 93.4% for AGIs below $25k, 95.0% for AGIs $25k-50k, 96.7% for AGIs $50k-75k, 95.0% for AGIs $75k-100k, 95.2% for AGIs $100k-200k, 100.0% for AGIs over 200k)
Averages for the 2012 tax year for zip code 48850, filed in 2013:
Average Adjusted Gross Income (AGI) in 2012: $38,175 (Individual Income Tax Returns)
Here:
$38,175
State:
$55,609
Salary/wage: $34,545 (reported on 75.8% of returns)
Here:
$34,545
State:
$46,782
(% of AGI for various income ranges: 60.2% for AGIs below $25k, 71.4% for AGIs $25k-50k, 75.6% for AGIs $50k-75k, 72.3% for AGIs $75k-100k, 63.2% for AGIs $100k-200k)
Taxable interest for individuals: $1,030 (reported on 32.8% of returns)
This zip code:
$1,030
Michigan:
$1,491
(% of AGI for various income ranges: 1.5% for AGIs below $25k, 1.1% for AGIs $25k-50k, 0.7% for AGIs $50k-75k, 0.9% for AGIs $75k-100k, 0.5% for AGIs $100k-200k)
Ordinary dividends: $1,748 (reported on 14.5% of returns)
Here:
$1,748
State:
$6,225
(% of AGI for various income ranges: 0.9% for AGIs below $25k, 1.1% for AGIs $25k-50k, 0.2% for AGIs $50k-75k, 0.5% for AGIs $75k-100k, 0.6% for AGIs $100k-200k)
Net capital gain/loss in AGI: +$3,479 (reported on 10.2% of returns)
Here:
+$3,479
State:
+$9,326
(% of AGI for various income ranges: 0.8% for AGIs $25k-50k, 0.9% for AGIs $50k-75k, 1.2% for AGIs $75k-100k, 1.4% for AGIs $100k-200k)
Profit/loss from business: +$7,330 (reported on 19.9% of returns)
Here:
+$7,330
State:
+$11,523
(% of AGI for various income ranges: 11.9% for AGIs below $25k, 5.1% for AGIs $25k-50k, 2.1% for AGIs $50k-75k, 1.1% for AGIs $75k-100k, 0.8% for AGIs $100k-200k)
Taxable individual retirement arrangement distribution: $9,819 (reported on 11.3% of returns)
48850:
$9,819
Michigan:
$15,298
(% of AGI for various income ranges: 4.6% for AGIs below $25k, 3.1% for AGIs $25k-50k, 2.5% for AGIs $50k-75k, 6.2% for AGIs $75k-100k)
Total itemized deductions: $16,565 (24% of AGI, reported on 18.3% of returns)
Here:
$16,565
State:
$21,628
Here:
23.6% of AGI
State:
18.4% of AGI
(% of AGI for various income ranges: 6.5% for AGIs below $25k, 7.9% for AGIs $25k-50k, 6.8% for AGIs $50k-75k, 8.8% for AGIs $75k-100k, 9.2% for AGIs $100k-200k)
Charity contributions: $3,096 (reported on 12.4% of returns)
Here:
$3,096
State:
$4,225
(% of AGI for various income ranges: 0.5% for AGIs below $25k, 1.0% for AGIs $25k-50k, 1.0% for AGIs $50k-75k, 0.8% for AGIs $75k-100k, 1.4% for AGIs $100k-200k)
Taxes paid: $5,147 (reported on 18.3% of returns)
48850:
$5,147
State:
$8,327
(% of AGI for various income ranges: 1.0% for AGIs below $25k, 1.9% for AGIs $25k-50k, 1.9% for AGIs $50k-75k, 3.0% for AGIs $75k-100k, 3.9% for AGIs $100k-200k)
Earned income credit: $2,190 (reported on 21.5% of returns)
Here:
$2,190
State:
$2,306
(% of AGI for various income ranges: 6.0% for AGIs below $25k, 1.3% for AGIs $25k-50k)
Percentage of individuals using paid preparers for their 2012 taxes: 64.5%
Here:
65%
State:
57%
(% for various income ranges: 59.3% for AGIs below $25k, 70.2% for AGIs $25k-50k, 60.9% for AGIs $50k-75k, 76.9% for AGIs $75k-100k, 75.0% for AGIs $100k-200k)
Averages for the 2004 tax year for zip code 48850, filed in 2005:
Average Adjusted Gross Income (AGI) in 2004: $33,762 (Individual Income Tax Returns)
Here:
$33,762
State:
$48,204
Salary/wage: $30,450 (reported on 82.5% of returns)
Here:
$30,450
State:
$42,791
(% of AGI for various income ranges: 112.0% for AGIs below $10k, 64.2% for AGIs $10k-25k, 77.9% for AGIs $25k-50k, 81.0% for AGIs $50k-75k, 79.1% for AGIs $75k-100k, 57.9% for AGIs over 100k)
Taxable interest for individuals: $1,461 (reported on 40.9% of returns)
This zip code:
$1,461
Michigan:
$1,725
(% of AGI for various income ranges: 5.9% for AGIs below $10k, 3.8% for AGIs $10k-25k, 1.4% for AGIs $25k-50k, 1.2% for AGIs $50k-75k, 2.1% for AGIs $75k-100k, 1.0% for AGIs over 100k)
Taxable dividends: $1,988 (reported on 16.2% of returns)
Here:
$1,988
State:
$3,420
(% of AGI for various income ranges: 2.7% for AGIs below $10k, 1.4% for AGIs $10k-25k, 1.0% for AGIs $25k-50k, 0.7% for AGIs $50k-75k, 0.5% for AGIs $75k-100k, 0.9% for AGIs over 100k)
Net capital gain/loss: +$7,342 (reported on 13.4% of returns)
Here:
+$7,342
State:
+$8,532
(% of AGI for various income ranges: -0.5% for AGIs below $10k, 0.9% for AGIs $10k-25k, 2.0% for AGIs $25k-50k, 1.7% for AGIs $50k-75k, 1.9% for AGIs $75k-100k, 9.2% for AGIs over 100k)
Profit/loss from business: +$7,334 (reported on 16.6% of returns)
Here:
+$7,334
State:
+$9,547
(% of AGI for various income ranges: 3.7% for AGIs below $10k, 8.1% for AGIs $10k-25k, 2.6% for AGIs $25k-50k, 2.1% for AGIs $50k-75k, 2.6% for AGIs $75k-100k, 4.9% for AGIs over 100k)
IRA payment deduction: $2,107 (reported on 1.4% of returns)
48850:
$2,107
Michigan:
$2,875
Total itemized deductions: $15,054 (25% of AGI, reported on 21.6% of returns)
Here:
$15,054
State:
$18,509
Here:
24.6% of AGI
State:
20.7% of AGI
(% of AGI for various income ranges: 10.7% for AGIs below $10k, 6.8% for AGIs $10k-25k, 9.4% for AGIs $25k-50k, 9.3% for AGIs $50k-75k, 13.5% for AGIs $75k-100k, 9.8% for AGIs over 100k)
Charity contributions deductions: $2,491 (4% of AGI, reported on 14.5% of returns)
Here:
$2,491
State:
$3,365
Here:
3.6% of AGI
State:
3.6% of AGI
(% of AGI for various income ranges: 1.0% for AGIs $10k-25k, 0.7% for AGIs $25k-50k, 1.2% for AGIs $50k-75k, 1.5% for AGIs $75k-100k, 1.5% for AGIs over 100k)
Total tax: $4,279 (reported on 70.0% of returns)
48850:
$4,279
State:
$7,691
(% of AGI for various income ranges: 3.5% for AGIs below $10k, 3.9% for AGIs $10k-25k, 6.2% for AGIs $25k-50k, 8.5% for AGIs $50k-75k, 9.8% for AGIs $75k-100k, 18.2% for AGIs over 100k)
Earned income credit: $1,744 (reported on 17.9% of returns)
Here:
$1,744
State:
$1,737
Percentage of individuals using paid preparers for their 2004 taxes: 68.8%
Here:
69%
State:
60%
(% for various income ranges: 59.4% for AGIs below $10k, 68.5% for AGIs $10k-25k, 72.1% for AGIs $25k-50k, 73.1% for AGIs $50k-75k, 78.8% for AGIs $75k-100k, 76.5% for AGIs over 100k)
Likely homosexual households (counted as self-reported same-sex unmarried-partner households)
Lesbian couples: 0.0% of all households
Gay men: 0.3% of all households
Household received Food Stamps/SNAP in the past 12 months: 320 Household did not receive Food Stamps/SNAP in the past 12 months: 1,366
Women who had a birth in the past 12 months: 44 (37 now married, 8 unmarried) Women who did not have a birth in the past 12 months: 868 (418 now married, 447 unmarried)
Housing units in zip code 48850 with a mortgage: 688 (49 second mortgage, 41 both second mortgage and home equity loan) Houses without a mortgage: 11
Median monthly owner costs for units with a mortgage: $1,266 Median monthly owner costs for units without a mortgage: $474
Residents with income below the poverty level in 2022:
This zip code:
11.7%
Whole state:
13.4%
Residents with income below 50% of the poverty level in 2022:
This zip code:
6.4%
Whole state:
6.9%
Median number of rooms in houses and condos:
Here:
6.3
State:
6.5
Median number of rooms in apartments:
Here:
4.4
State:
4.3
Notable locations in this zip code not listed on our city pages
Notable locations in zip code 48850: Bass Beach Campground (A), Lakeview District Fire Department (B), Tamarack District Library (C), Lakeview Police Department (D). Display/hide their locations on the map
Churches in zip code 48850 include: Hinton Church (A), Brockway Church (B), Lakeview Baptist Church (C), Lakeview Seventh Day Adventist Church (D), Living Waters Pentecostal Church (E), United Church of Christ (F), Son Shine Worship Center (G), Saint Francis de Sales Church (H), Holy Trinity Lutheran Church (I). Display/hide their locations on the map
Cemeteries: Cato Cemetery (1), Lakeview Cemetery (2), Dickerson Cemetery (3), Hinton Cemetery (4), Morton Cemetery (5). Display/hide their locations on the map
Lakes: Pickerel Lake (A), Little Brimmer Lake (B), Wolf Lake (C), Farnsworth Lake (D), Brockway Lake (E), Bass Lake (F), Basin Lake (G), Tamarack Lake (H). Display/hide their locations on the map
684 married couples with children.
297 single-parent households (109 men, 188 women).
93.9% of residents of 48850 zip code speak English at home.
1.1% of residents speak Spanish at home (76% very well, 14% well, 10% not well).
4.6% of residents speak other Indo-European language at home (90% very well, 5% well, 5% not well).
0.1% of residents speak Asian or Pacific Island language at home (100% very well).
Foreign born population: 66 (1.4%) (95.6% of them are naturalized citizens)
This zip code:
1.4%
Whole state:
6.9%
22%Denmark
14%Honduras
11%France
6%Malaysia
5%Belize
3%Sweden
3%England
24%German
14%Pennsylvania German
10%English
9%American
6%Irish
4%Polish
3%European
Year of entry for the foreign-born population
02010 or later
292000 to 2009
381990 to 1999
31Before 1990
Facilities with environmental interests located in this zip code:
EARLS SPRAYING SERVICE (80 CAROLINE DR in LAKEVIEW, MI)
(Integrated Compliance Information System) - ICIS-05-1985-0221, FORMAL ENFORCEMENT ACTION Business SIC classification: CROP PLANTING, CULTIVATING, AND PROTECTING
BALAGUER CORPORATION (9500 YOUNGMAN ROAD in LAKEVIEW, MI)
Small Quantity Generators, between 100 kg and 1000 kg of hazardous waste/month (Resource Conservation and Recovery Act (tracking hazardous waste)) Organizations: FLEX CABLE NCSI (CONTACT/OPERATOR)
, RICHARD J BALAGUER (CONTACT/OWNER)
MI DEPT/ENVIRONMENTAL QUALITY (12N-08W-SEC 9-SE NE NE in LAKEVIEW, MI)
(Resource Conservation and Recovery Act (tracking hazardous waste)) Business NAICS classification: SUPPORT ACTIVITIES FOR OIL AND GAS OPERATIONS. Alternative names: MI DEPT/ENVIRONMENTAL QUALITY/GLMD
MI DEPT/TRANSPORTATION (HOWARD CITY M-46 AT EDMORE HIL in LAKEVIEW, MI)
(Resource Conservation and Recovery Act (tracking hazardous waste))
BOLLINGERS INC (208 LINCOLN in LAKEVIEW, MI)
Conditionally Exempt Small Quantity Generators, less than 100 kg/month of hazardous waste (Resource Conservation and Recovery Act (tracking hazardous waste)) Organizations: BESEMER BILL (CONTACT/OPERATOR)
MI DEPT/TRANSPORTATION BRIDGE B01-59042 (M-46 OVER TAMARACK CREEK in LAKEVIEW, MI)
Conditionally Exempt Small Quantity Generators, less than 100 kg/month of hazardous waste (Resource Conservation and Recovery Act (tracking hazardous waste)) Organizations: MICH DEPT OF TRANSPORTATION (CONTACT/OPERATOR)
Housing units lacking complete plumbing facilities: 5.2% Housing units lacking complete kitchen facilities: 4.9%
40.5%Utility gas
34.9%Bottled, tank, or LP gas
12.3%Wood
7.7%Electricity
2.1%Fuel oil, kerosene, etc.
1.4%Other fuel
1.3%No fuel used
Population in 1990: 6,000.
Place of birth for U.S.-born residents:
This state: 3,912
Northeast: 41
Midwest: 242
South: 204
West: 135
58% of the 48850 zip code residents lived in the same house 5 years ago. Out of people who lived in different houses, 57% lived in this county. Out of people who lived in different counties, 50% lived in Michigan.
90% of the 48850 zip code residents lived in the same house 1 year ago. Out of people who lived in different houses, 59% moved from this county. Out of people who lived in different houses, 27% moved from different county within same state. Out of people who lived in different houses, 11% moved from different state. Out of people who lived in different houses, 1% moved from abroad.
Private vs. public school enrollment:
Students in private schools in grades 1 to 8 (elementary and middle school): 62
Here:
12.7%
Michigan:
12.4%
Students in private schools in grades 9 to 12 (high school): 21
Here:
6.9%
Michigan:
9.8%
Students in private undergraduate colleges: 2
Here:
3.0%
Michigan:
14.9%
Occupation by median earnings in the past 12 months ($)
70,277Health diagnosing and treating practitioners and other technical occupations
69,422Transportation occupations
68,797Management occupations
65,052Community and social service occupations
62,473Education, training, and library occupations
50,999Business and financial operations occupations
Top industries in this zip code by the number of employees in 2005:
Health Care and Social Assistance: General Medical and Surgical Hospitals (100-249 employees: 1 establishment)
Finance and Insurance: Commercial Banking (20-49: 1, 5-9: 1)
Administrative and Support and Waste Management and Remediation Services: Temporary Help Services (20-49: 1)
Professional, Scientific, and Technical Services: Veterinary Services (20-49: 1)
Health Care and Social Assistance: Offices of Dentists (10-19: 2)
People in group quarters in 2010:
29 people in nursing facilities/skilled-nursing facilities
9 people in group homes intended for adults
People in group quarters in 2000:
45 people in orthopedic wards and institutions for the physically handicapped
14 people in other group homes
Fatal accident statistics in 2014:
Fatal accident count: 1
Vehicles involved in fatal accidents: 2
Fatal accidents caused by drunken drivers: 0
Fatalities: 1
Persons involved in fatal accidents: 3
Pedestrians involved in fatal accidents: 0
Fatal accident statistics in 2012:
Fatal accident count: 2
Vehicles involved in fatal accidents: 5
Fatal accidents caused by drunken drivers: 1
Fatalities: 3
Persons involved in fatal accidents: 14
Pedestrians involved in fatal accidents: 0
2002 - 2018 National Fire Incident Reporting System (NFIRS) incidents
Based on the data from the years 2002 - 2018 the average number of fire incidents per year is 22. The highest number of fire incidents - 31 took place in 2008, and the least - 10 in 2013. The data has a rising trend.
When looking into fire subcategories, the most incidents belonged to: Structure Fires (46.5%), and Outside Fires (34.1%).
Fire incident types reported to NFIRS in Zip Code 48850


 Nearest zip codes: 48886, 49322, 49347, 48888, 49332, 49326.


 Based on the data from the years 2002 - 2018 the average number of fire incidents per year is 22. The highest number of fire incidents - 31 took place in 2008, and the least - 10 in 2013. The data has a rising trend.
 When looking into fire subcategories, the most incidents belonged to: Structure Fires (46.5%), and Outside Fires (34.1%).