Estimated zip code population in 2022: 3,758 Zip code population in 2010: 3,752 Zip code population in 2000: 3,445
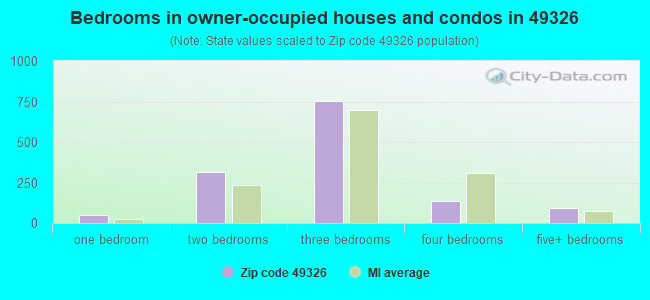
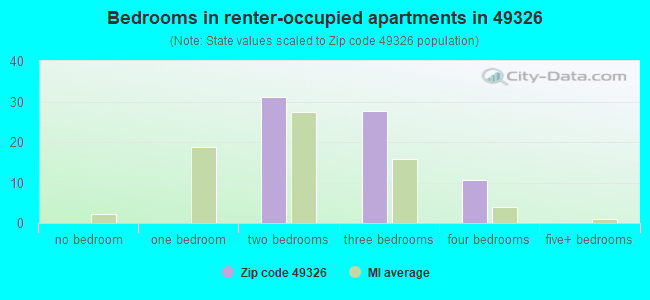
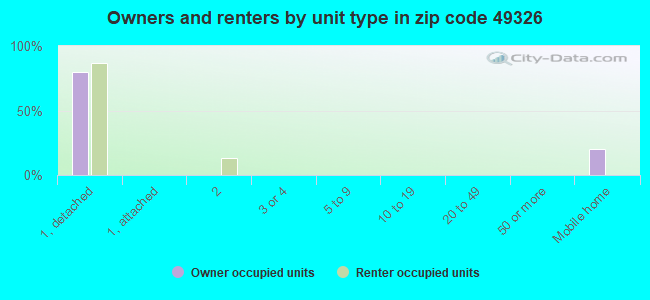
Houses and condos: 1,774 Renter-occupied apartments: 69
% of renters here:
5%
State:
27%
March 2022 cost of living index in zip code 49326: 81.7 (low, U.S. average is 100)
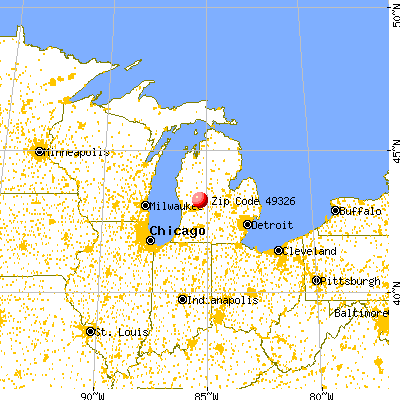
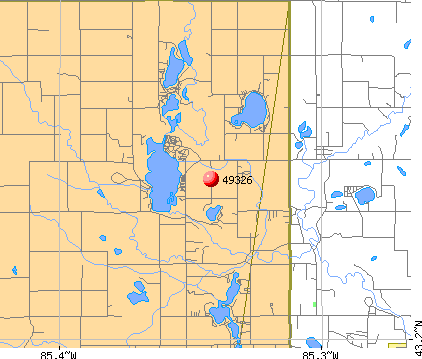
Land area: 23.7 sq. mi. Water area: 2.0 sq. mi.
Population density: 159 people per square mile
(very low).
OSM Map
General Map
Google Map
MSN Map
OSM Map
General Map
Google Map
MSN Map
OSM Map
General Map
Google Map
MSN Map
OSM Map
General Map
Google Map
MSN Map
Please wait while loading the map...
Real estate property taxes paid for housing units in 2022:
This zip code:
0.9% ($1,923)
Michigan:
1.2% ($2,746)
Median real estate property taxes paid for housing units with mortgages in 2022: $2,377 (1.1%) Median real estate property taxes paid for housing units with no mortgage in 2022: $1,565 (0.9%)
Business Search- 14 Million verified businesses
Males: 1,860
(49.5%)
Females: 1,897
(50.5%)
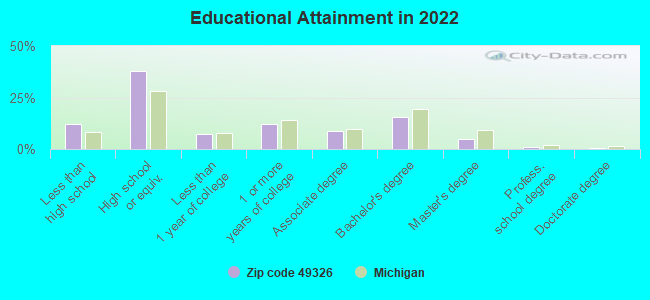
For population 25 years and over in 49326:
High school or higher: 87.0%
Bachelor's degree or higher: 21.2%
Graduate or professional degree: 5.9%
Unemployed: 3.4%
Mean travel time to work (commute): 25.6 minutes
For population 15 years and over in 49326:
Never married: 21.0%
Now married: 64.9%
Separated: 0.9%
Widowed: 3.2%
Divorced: 10.0%
Zip code 49326 compared to state average:
Black race population percentage significantly below state average.
Foreign-born population percentage significantly below state average.
Renting percentage significantly below state average.
Length of stay since moving in above state average.
Percentage of population with a bachelor's degree or higher below state average.
Averages for the 2020 tax year for zip code 49326, filed in 2021:
Average Adjusted Gross Income (AGI) in 2020: $59,341 (Individual Income Tax Returns)
Here:
$59,341
State:
$68,945
Salary/wage: $51,865 (reported on 78.1% of returns)
Here:
$51,865
State:
$57,142
(% of AGI for various income ranges: 957.4% for AGIs below $25k, 3182.5% for AGIs $25k-50k, 6252.6% for AGIs $50k-75k, 9570.0% for AGIs $75k-100k, 14367.2% for AGIs $100k-200k)
Taxable interest for individuals: $909 (reported on 28.6% of returns)
This zip code:
$909
Michigan:
$1,630
(% of AGI for various income ranges: 9.3% for AGIs below $25k, 8.8% for AGIs $25k-50k, 21.7% for AGIs $50k-75k, 42.7% for AGIs $75k-100k, 96.7% for AGIs $100k-200k)
Ordinary dividends: $3,632 (reported on 12.8% of returns)
Here:
$3,632
State:
$6,972
(% of AGI for various income ranges: 12.8% for AGIs below $25k, 18.8% for AGIs $25k-50k, 45.7% for AGIs $50k-75k, 103.3% for AGIs $75k-100k, 231.7% for AGIs $100k-200k)
Net capital gain/loss in AGI: +$7,343 (reported on 14.3% of returns)
Here:
+$7,343
State:
+$20,064
(% of AGI for various income ranges: 6.3% for AGIs below $25k, 21.8% for AGIs $25k-50k, 78.3% for AGIs $50k-75k, 69.3% for AGIs $75k-100k, 381.7% for AGIs $100k-200k)
Profit/loss from business: +$9,046 (reported on 13.3% of returns)
Here:
+$9,046
State:
+$11,172
(% of AGI for various income ranges: 54.9% for AGIs below $25k, 126.8% for AGIs $25k-50k, 117.8% for AGIs $50k-75k, 249.3% for AGIs $75k-100k, 535.6% for AGIs $100k-200k)
Taxable individual retirement arrangement distribution: $17,252 (reported on 11.7% of returns)
49326:
$17,252
Michigan:
$19,803
(% of AGI for various income ranges: 98.6% for AGIs below $25k, 100.5% for AGIs $25k-50k, 207.8% for AGIs $50k-75k, 562.0% for AGIs $75k-100k, 1011.7% for AGIs $100k-200k)
Total itemized deductions: $24,725 (reported on 4.1% of returns)
Here:
$24,725
State:
$34,117
(% of AGI for various income ranges: 311.7% for AGIs $50k-75k, 700.6% for AGIs $100k-200k)
Charity contributions: $11,780 (reported on 2.6% of returns)
Here:
$11,780
State:
$13,548
(% of AGI for various income ranges: 327.2% for AGIs $100k-200k)
Taxes paid: $7,788 (reported on 4.1% of returns)
49326:
$7,788
State:
$7,972
(% of AGI for various income ranges: 96.1% for AGIs $50k-75k, 223.3% for AGIs $100k-200k)
Earned income credit: $1,957 (reported on 11.7% of returns)
Here:
$1,957
State:
$2,251
(% of AGI for various income ranges: 57.7% for AGIs below $25k, 50.5% for AGIs $25k-50k)
Percentage of individuals using paid preparers for their 2020 taxes: 93.4%
Here:
93%
State:
93%
(% for various income ranges: 90.5% for AGIs below $25k, 97.9% for AGIs $25k-50k, 93.5% for AGIs $50k-75k, 90.9% for AGIs $75k-100k, 96.3% for AGIs $100k-200k, 80.0% for AGIs over 200k)
Averages for the 2012 tax year for zip code 49326, filed in 2013:
Average Adjusted Gross Income (AGI) in 2012: $45,005 (Individual Income Tax Returns)
Here:
$45,005
State:
$55,609
Salary/wage: $40,909 (reported on 82.6% of returns)
Here:
$40,909
State:
$46,782
(% of AGI for various income ranges: 70.8% for AGIs below $25k, 75.3% for AGIs $25k-50k, 80.0% for AGIs $50k-75k, 76.2% for AGIs $75k-100k, 73.7% for AGIs $100k-200k, 69.6% for AGIs over 200k)
Taxable interest for individuals: $1,382 (reported on 29.1% of returns)
This zip code:
$1,382
Michigan:
$1,491
(% of AGI for various income ranges: 0.8% for AGIs below $25k, 0.8% for AGIs $25k-50k, 0.7% for AGIs $50k-75k, 1.3% for AGIs $75k-100k, 1.3% for AGIs $100k-200k)
Ordinary dividends: $2,060 (reported on 14.5% of returns)
Here:
$2,060
State:
$6,225
(% of AGI for various income ranges: 0.6% for AGIs below $25k, 0.5% for AGIs $25k-50k, 0.3% for AGIs $50k-75k, 1.0% for AGIs $75k-100k, 1.2% for AGIs $100k-200k)
Net capital gain/loss in AGI: +$1,000 (reported on 8.7% of returns)
Here:
+$1,000
State:
+$9,326
(% of AGI for various income ranges: 0.2% for AGIs $75k-100k, 1.1% for AGIs $100k-200k)
Profit/loss from business: +$5,900 (reported on 14.0% of returns)
Here:
+$5,900
State:
+$11,523
(% of AGI for various income ranges: 5.0% for AGIs below $25k, 1.7% for AGIs $25k-50k, 1.6% for AGIs $50k-75k, 3.5% for AGIs $75k-100k)
Taxable individual retirement arrangement distribution: $13,732 (reported on 11.0% of returns)
49326:
$13,732
Michigan:
$15,298
(% of AGI for various income ranges: 3.9% for AGIs below $25k, 4.2% for AGIs $25k-50k, 2.1% for AGIs $50k-75k, 4.7% for AGIs $75k-100k, 4.3% for AGIs $100k-200k)
Total itemized deductions: $20,112 (23% of AGI, reported on 25.0% of returns)
Here:
$20,112
State:
$21,628
Here:
22.7% of AGI
State:
18.4% of AGI
(% of AGI for various income ranges: 8.4% for AGIs below $25k, 7.5% for AGIs $25k-50k, 11.2% for AGIs $50k-75k, 11.3% for AGIs $75k-100k, 14.0% for AGIs $100k-200k, 14.9% for AGIs over 200k)
Charity contributions: $3,191 (reported on 19.2% of returns)
Here:
$3,191
State:
$4,225
(% of AGI for various income ranges: 0.5% for AGIs below $25k, 0.7% for AGIs $25k-50k, 0.9% for AGIs $50k-75k, 1.4% for AGIs $75k-100k, 2.0% for AGIs $100k-200k, 3.1% for AGIs over 200k)
Taxes paid: $6,453 (reported on 25.0% of returns)
49326:
$6,453
State:
$8,327
(% of AGI for various income ranges: 1.5% for AGIs below $25k, 1.9% for AGIs $25k-50k, 2.9% for AGIs $50k-75k, 3.8% for AGIs $75k-100k, 5.7% for AGIs $100k-200k, 5.5% for AGIs over 200k)
Earned income credit: $1,956 (reported on 18.6% of returns)
Here:
$1,956
State:
$2,306
(% of AGI for various income ranges: 5.2% for AGIs below $25k, 1.3% for AGIs $25k-50k)
Percentage of individuals using paid preparers for their 2012 taxes: 57.0%
Here:
57%
State:
57%
(% for various income ranges: 52.0% for AGIs below $25k, 57.5% for AGIs $25k-50k, 59.3% for AGIs $50k-75k, 62.5% for AGIs $75k-100k, 83.3% for AGIs $100k-200k)
Averages for the 2004 tax year for zip code 49326, filed in 2005:
Average Adjusted Gross Income (AGI) in 2004: $40,920 (Individual Income Tax Returns)
Here:
$40,920
State:
$48,204
Salary/wage: $37,817 (reported on 86.9% of returns)
Here:
$37,817
State:
$42,791
(% of AGI for various income ranges: 92.0% for AGIs below $10k, 75.6% for AGIs $10k-25k, 83.2% for AGIs $25k-50k, 86.7% for AGIs $50k-75k, 83.4% for AGIs $75k-100k, 67.6% for AGIs over 100k)
Taxable interest for individuals: $1,000 (reported on 41.4% of returns)
This zip code:
$1,000
Michigan:
$1,725
(% of AGI for various income ranges: 7.3% for AGIs below $10k, 1.9% for AGIs $10k-25k, 0.7% for AGIs $25k-50k, 0.7% for AGIs $50k-75k, 1.1% for AGIs $75k-100k, 0.8% for AGIs over 100k)
Taxable dividends: $1,518 (reported on 15.7% of returns)
Here:
$1,518
State:
$3,420
(% of AGI for various income ranges: 1.0% for AGIs below $10k, 0.5% for AGIs $10k-25k, 0.3% for AGIs $25k-50k, 0.1% for AGIs $50k-75k, 0.5% for AGIs $75k-100k, 1.6% for AGIs over 100k)
Net capital gain/loss: +$7,633 (reported on 12.3% of returns)
Here:
+$7,633
State:
+$8,532
(% of AGI for various income ranges: 2.2% for AGIs below $10k, -0.5% for AGIs $10k-25k, 0.5% for AGIs $25k-50k, 0.9% for AGIs $50k-75k, 0.8% for AGIs $75k-100k, 8.4% for AGIs over 100k)
Profit/loss from business: +$4,837 (reported on 15.7% of returns)
Here:
+$4,837
State:
+$9,547
(% of AGI for various income ranges: -5.4% for AGIs below $10k, 3.0% for AGIs $10k-25k, 3.7% for AGIs $25k-50k, 2.0% for AGIs $50k-75k, 0.4% for AGIs $75k-100k, 0.6% for AGIs over 100k)
IRA payment deduction: $1,056 (reported on 1.1% of returns)
49326:
$1,056
Michigan:
$2,875
Total itemized deductions: $16,250 (24% of AGI, reported on 33.6% of returns)
Here:
$16,250
State:
$18,509
Here:
24.2% of AGI
State:
20.7% of AGI
(% of AGI for various income ranges: 12.4% for AGIs below $10k, 12.4% for AGIs $10k-25k, 10.7% for AGIs $25k-50k, 16.0% for AGIs $50k-75k, 14.2% for AGIs $75k-100k, 12.9% for AGIs over 100k)
Charity contributions deductions: $2,316 (3% of AGI, reported on 25.6% of returns)
Here:
$2,316
State:
$3,365
Here:
3.2% of AGI
State:
3.6% of AGI
(% of AGI for various income ranges: 1.2% for AGIs $10k-25k, 1.1% for AGIs $25k-50k, 1.3% for AGIs $50k-75k, 1.5% for AGIs $75k-100k, 2.4% for AGIs over 100k)
Total tax: $5,135 (reported on 74.5% of returns)
49326:
$5,135
State:
$7,691
(% of AGI for various income ranges: 3.0% for AGIs below $10k, 3.3% for AGIs $10k-25k, 6.9% for AGIs $25k-50k, 8.3% for AGIs $50k-75k, 9.9% for AGIs $75k-100k, 16.2% for AGIs over 100k)
Earned income credit: $1,674 (reported on 13.5% of returns)
Here:
$1,674
State:
$1,737
Percentage of individuals using paid preparers for their 2004 taxes: 59.2%
Here:
59%
State:
60%
(% for various income ranges: 50.3% for AGIs below $10k, 62.5% for AGIs $10k-25k, 60.0% for AGIs $25k-50k, 60.2% for AGIs $50k-75k, 58.3% for AGIs $75k-100k, 70.8% for AGIs over 100k)
Likely homosexual households (counted as self-reported same-sex unmarried-partner households)
Lesbian couples: 0.0% of all households
Gay men: 0.9% of all households
Household received Food Stamps/SNAP in the past 12 months: 86 Household did not receive Food Stamps/SNAP in the past 12 months: 1,305
Women who had a birth in the past 12 months: 72 (74 now married, 0 unmarried) Women who did not have a birth in the past 12 months: 541 (280 now married, 259 unmarried)
Housing units in zip code 49326 with a mortgage: 805 (122 second mortgage, 113 both second mortgage and home equity loan) Median monthly owner costs for units with a mortgage: $1,416 Median monthly owner costs for units without a mortgage: $397
Residents with income below the poverty level in 2022:
This zip code:
8.9%
Whole state:
13.4%
Residents with income below 50% of the poverty level in 2022:
This zip code:
4.8%
Whole state:
6.9%
Median number of rooms in houses and condos:
Here:
6.1
State:
6.5
Median number of rooms in apartments:
Here:
6.5
State:
4.3
Notable locations in this zip code not listed on our city pages
Notable locations in zip code 49326: Pleasant Hill Camp (A), Camp Concordia (B), Links of Bowen Lake (C), Brookside Golf Course (D), Sheriffs Camp (E), Greenwood Camp (F), Spencer Township Fire Department (G), Spencer Township Library (H). Display/hide their locations on the map
Lakes: Peterson Lake (A), Little Norton Lake (B), Norton Lake (C), Woodbeck Lake (D), Mud Lake (E), Horseshoe Lake (F), Halfmile Lake (G), Bowen Lake (H). Display/hide their locations on the map
Parks in zip code 49326 include: White Pine Park (1), Little Denmark Evangelical Lutheran Church Historical Marker (2). Display/hide their locations on the map
In group quarters: 27 (-1 institutionalized population)
Size of family households: 598 2-persons, 209 3-persons, 162 4-persons, 61 5-persons, 7 6-persons, 61 7-or-more-persons
Size of nonfamily households: 224 1-person, 50 2-persons, 20 3-persons
654 married couples with children.
123 single-parent households (47 men, 76 women).
96.4% of residents of 49326 zip code speak English at home.
3.5% of residents speak Spanish at home (69% very well, 31% well).
Foreign born population: 8 (0.2%) (100.0% of them are naturalized citizens)
This zip code:
0.2%
Whole state:
6.9%
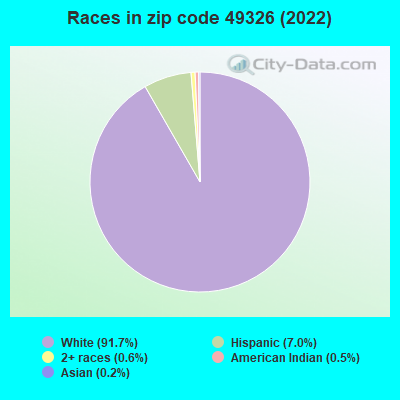
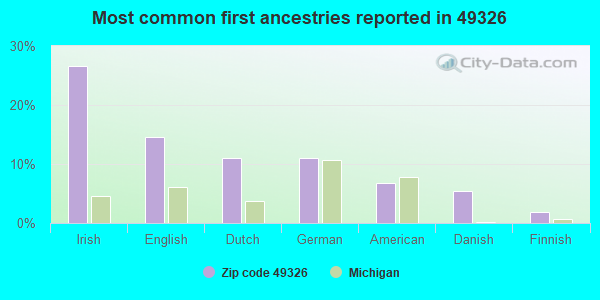
27%Irish
15%English
11%Dutch
11%German
7%American
5%Danish
2%Finnish
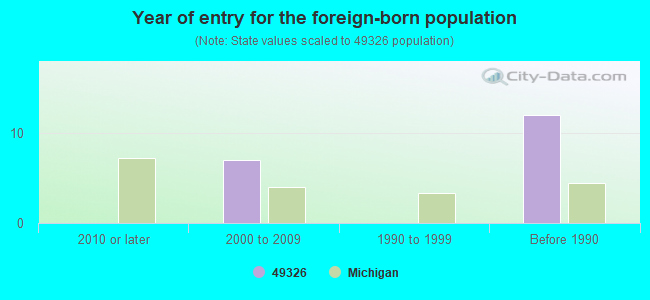
Year of entry for the foreign-born population
02010 or later
72000 to 2009
01990 to 1999
12Before 1990
Housing units lacking complete plumbing facilities: 0.5% Housing units lacking complete kitchen facilities: 1.0%
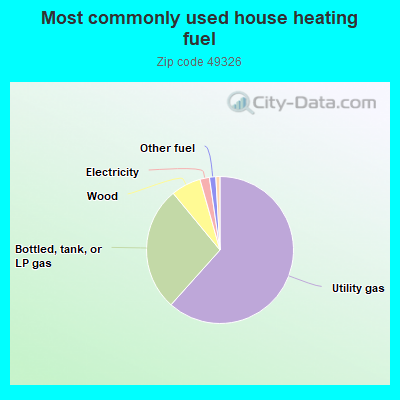
61.8%Utility gas
27.5%Bottled, tank, or LP gas
6.6%Wood
2.1%Electricity
1.4%Other fuel
0.9%Fuel oil, kerosene, etc.
Population in 1990: 6,144.
Place of birth for U.S.-born residents:
This state: 3,065
Northeast: 90
Midwest: 397
South: 120
West: 64
59% of the 49326 zip code residents lived in the same house 5 years ago. Out of people who lived in different houses, 45% lived in this county. Out of people who lived in different counties, 50% lived in Michigan.
89% of the 49326 zip code residents lived in the same house 1 year ago. Out of people who lived in different houses, 50% moved from this county. Out of people who lived in different houses, 41% moved from different county within same state. Out of people who lived in different houses, 7% moved from different state.
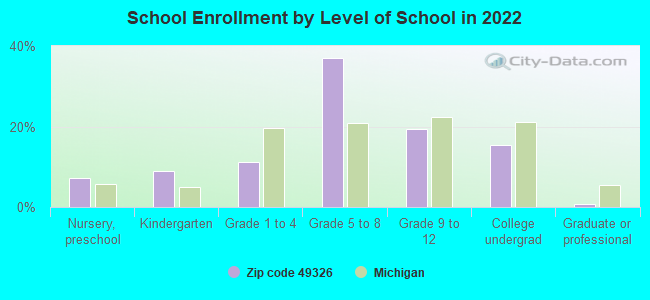
Private vs. public school enrollment:
Students in private schools in grades 1 to 8 (elementary and middle school): 11
Here:
2.9%
Michigan:
12.4%
Students in private schools in grades 9 to 12 (high school): 28
Here:
18.6%
Michigan:
9.8%
Students in private undergraduate colleges:
Here:
0.0%
Michigan:
14.9%
Occupation by median earnings in the past 12 months ($)
56,172Business and financial operations occupations
55,041Health diagnosing and treating practitioners and other technical occupations
51,322Management occupations
47,657Production occupations
45,973Office and administrative support occupations
41,634Building and grounds cleaning and maintenance occupations
Top industries in this zip code by the number of employees in 2005:
Accommodation and Food Services: Recreational and Vacation Camps (except Campgrounds) (5-9: 1)
Real Estate and Rental and Leasing: Lessors of Other Real Estate Property (5-9: 1)
Other Services (except Public Administration): Religious Organizations (1-4: 2)
Other Services (except Public Administration): Commercial and Industrial Machinery and Equipment (except Automotive and Electronic) Repair and Maintenance (1-4: 2)
Construction: New Single-Family Housing Construction (except Operative Builders) (1-4: 1)
People in group quarters in 2010:
44 people in local jails and other municipal confinement facilities
21 people in residential treatment centers for adults
7 people in group homes intended for adults
People in group quarters in 2000:
48 people in local jails and other confinement facilities (including police lockups)
15 people in other group homes
Fatal accident statistics in 2014:
Fatal accident count: 1
Vehicles involved in fatal accidents: 2
Fatal accidents caused by drunken drivers: 0
Fatalities: 1
Persons involved in fatal accidents: 2
Pedestrians involved in fatal accidents: 0
Fatal accident statistics in 2013:
Fatal accident count: 1
Vehicles involved in fatal accidents: 1
Fatal accidents caused by drunken drivers: 0
Fatalities: 1
Persons involved in fatal accidents: 1
Pedestrians involved in fatal accidents: 0
Home Mortgage Disclosure Act Aggregated Statistics For Year 2009 (Based on 2 partial tracts)
A) FHA, FSA/RHS & VA Home Purchase Loans
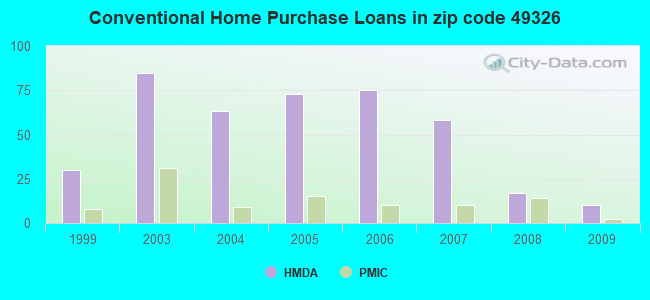
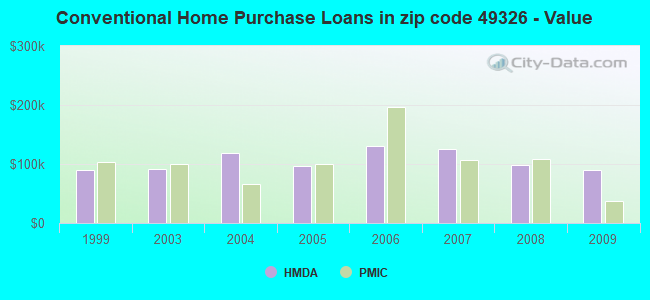
B) Conventional Home Purchase Loans
C) Refinancings
D) Home Improvement Loans
F) Non-occupant Loans on < 5 Family Dwellings (A B C & D)
G) Loans On Manufactured Home Dwelling (A B C & D)
Number
Average Value
Number
Average Value
Number
Average Value
Number
Average Value
Number
Average Value
Number
Average Value
LOANS ORIGINATED
10
$87,085
10
$90,323
111
$136,367
3
$3,410
26
$95,238
12
$57,801
APPLICATIONS APPROVED, NOT ACCEPTED
0
$0
0
$0
19
$187,372
3
$9,090
0
$0
2
$4,260
APPLICATIONS DENIED
3
$51,693
5
$64,760
34
$96,939
3
$35,787
3
$46,580
10
$69,020
APPLICATIONS WITHDRAWN
0
$0
0
$0
24
$166,230
0
$0
2
$172,125
2
$74,985
FILES CLOSED FOR INCOMPLETENESS
0
$0
0
$0
5
$134,632
0
$0
2
$65,610
0
$0
Aggregated Statistics For Year 2008 (Based on 2 partial tracts)
A) FHA, FSA/RHS & VA Home Purchase Loans
B) Conventional Home Purchase Loans
C) Refinancings
D) Home Improvement Loans
F) Non-occupant Loans on < 5 Family Dwellings (A B C & D)
G) Loans On Manufactured Home Dwelling (A B C & D)
Number
Average Value
Number
Average Value
Number
Average Value
Number
Average Value
Number
Average Value
Number
Average Value
LOANS ORIGINATED
9
$82,559
17
$97,741
94
$138,258
10
$46,865
31
$119,679
15
$87,937
APPLICATIONS APPROVED, NOT ACCEPTED
2
$76,690
2
$89,470
17
$128,116
0
$0
0
$0
3
$100,547
APPLICATIONS DENIED
3
$77,257
3
$129,520
51
$129,051
9
$51,126
9
$79,529
9
$56,996
APPLICATIONS WITHDRAWN
0
$0
0
$0
15
$181,895
2
$51,125
0
$0
2
$51,125
FILES CLOSED FOR INCOMPLETENESS
0
$0
0
$0
7
$71,820
0
$0
0
$0
0
$0
Aggregated Statistics For Year 2007 (Based on 2 partial tracts)
A) FHA, FSA/RHS & VA Home Purchase Loans
B) Conventional Home Purchase Loans
C) Refinancings
D) Home Improvement Loans
F) Non-occupant Loans on < 5 Family Dwellings (A B C & D)
G) Loans On Manufactured Home Dwelling (A B C & D)
Number
Average Value
Number
Average Value
Number
Average Value
Number
Average Value
Number
Average Value
Number
Average Value
LOANS ORIGINATED
2
$126,110
58
$125,641
80
$111,242
20
$68,509
17
$150,271
20
$84,017
APPLICATIONS APPROVED, NOT ACCEPTED
2
$31,530
0
$0
31
$121,603
3
$54,533
3
$107,933
3
$76,690
APPLICATIONS DENIED
2
$81,800
15
$119,294
68
$148,416
12
$22,722
5
$100,548
10
$89,811
APPLICATIONS WITHDRAWN
0
$0
2
$51,980
27
$126,048
5
$44,310
0
$0
7
$87,157
FILES CLOSED FOR INCOMPLETENESS
0
$0
0
$0
10
$230,067
0
$0
0
$0
0
$0
Aggregated Statistics For Year 2006 (Based on 2 partial tracts)
A) FHA, FSA/RHS & VA Home Purchase Loans
B) Conventional Home Purchase Loans
C) Refinancings
D) Home Improvement Loans
F) Non-occupant Loans on < 5 Family Dwellings (A B C & D)
G) Loans On Manufactured Home Dwelling (A B C & D)
Number
Average Value
Number
Average Value
Number
Average Value
Number
Average Value
Number
Average Value
Number
Average Value
LOANS ORIGINATED
10
$85,721
75
$130,405
126
$123,216
19
$39,824
31
$115,611
26
$87,438
APPLICATIONS APPROVED, NOT ACCEPTED
0
$0
19
$73,101
29
$115,239
0
$0
3
$145,427
3
$57,943
APPLICATIONS DENIED
0
$0
14
$77,663
101
$113,928
19
$40,183
9
$183,674
27
$63,623
APPLICATIONS WITHDRAWN
2
$71,575
19
$108,082
24
$125,472
3
$79,530
5
$128,156
2
$132,930
FILES CLOSED FOR INCOMPLETENESS
0
$0
3
$68,737
14
$150,091
0
$0
0
$0
0
$0
Aggregated Statistics For Year 2005 (Based on 2 partial tracts)
A) FHA, FSA/RHS & VA Home Purchase Loans
B) Conventional Home Purchase Loans
C) Refinancings
D) Home Improvement Loans
F) Non-occupant Loans on < 5 Family Dwellings (A B C & D)
G) Loans On Manufactured Home Dwelling (A B C & D)
Number
Average Value
Number
Average Value
Number
Average Value
Number
Average Value
Number
Average Value
Number
Average Value
LOANS ORIGINATED
0
$0
73
$95,855
114
$118,352
19
$58,481
26
$97,074
12
$97,992
APPLICATIONS APPROVED, NOT ACCEPTED
0
$0
17
$104,558
36
$136,336
2
$11,930
10
$100,718
3
$30,677
APPLICATIONS DENIED
2
$107,365
26
$64,038
97
$117,888
14
$90,444
10
$44,139
26
$56,042
APPLICATIONS WITHDRAWN
2
$72,430
17
$97,541
61
$136,923
3
$156,217
3
$153,947
5
$74,304
FILES CLOSED FOR INCOMPLETENESS
0
$0
3
$63,623
20
$112,818
2
$4,260
5
$56,580
0
$0
Aggregated Statistics For Year 2004 (Based on 2 partial tracts)
A) FHA, FSA/RHS & VA Home Purchase Loans
B) Conventional Home Purchase Loans
C) Refinancings
D) Home Improvement Loans
F) Non-occupant Loans on < 5 Family Dwellings (A B C & D)
G) Loans On Manufactured Home Dwelling (A B C & D)
Number
Average Value
Number
Average Value
Number
Average Value
Number
Average Value
Number
Average Value
Number
Average Value
LOANS ORIGINATED
5
$130,542
63
$118,753
167
$112,936
14
$74,619
17
$108,166
19
$66,195
APPLICATIONS APPROVED, NOT ACCEPTED
7
$77,420
10
$152,355
56
$105,234
5
$46,354
2
$32,380
10
$57,943
APPLICATIONS DENIED
0
$0
19
$61,979
116
$108,011
12
$34,652
3
$96,570
37
$70,839
APPLICATIONS WITHDRAWN
2
$70,725
10
$105,660
27
$120,809
2
$234,325
5
$94,072
3
$56,807
FILES CLOSED FOR INCOMPLETENESS
0
$0
5
$139,404
24
$128,596
3
$148,833
3
$113,613
0
$0
Aggregated Statistics For Year 2003 (Based on 2 partial tracts)
A) FHA, FSA/RHS & VA Home Purchase Loans
B) Conventional Home Purchase Loans
C) Refinancings
D) Home Improvement Loans
F) Non-occupant Loans on < 5 Family Dwellings (A B C & D)
Number
Average Value
Number
Average Value
Number
Average Value
Number
Average Value
Number
Average Value
LOANS ORIGINATED
3
$110,203
85
$91,967
261
$111,080
9
$56,618
43
$102,648
APPLICATIONS APPROVED, NOT ACCEPTED
0
$0
10
$71,406
31
$102,802
0
$0
3
$109,070
APPLICATIONS DENIED
2
$48,570
14
$70,968
102
$68,502
14
$12,660
7
$44,309
APPLICATIONS WITHDRAWN
3
$78,960
5
$135,654
63
$141,692
7
$25,807
0
$0
FILES CLOSED FOR INCOMPLETENESS
3
$77,257
3
$59,080
15
$82,597
2
$25,565
5
$66,122
Aggregated Statistics For Year 1999 (Based on 1 partial tract)
A) FHA, FSA/RHS & VA Home Purchase Loans
B) Conventional Home Purchase Loans
C) Refinancings
D) Home Improvement Loans
F) Non-occupant Loans on < 5 Family Dwellings (A B C & D)
Detailed PMIC statistics for the following Tracts:0101.02
2002 - 2018 National Fire Incident Reporting System (NFIRS) incidents
According to the data from the years 2002 - 2018 the average number of fire incidents per year is 17. The highest number of fires - 34 took place in 2003, and the least - 6 in 2005. The data has an increasing trend.
When looking into fire subcategories, the most reports belonged to: Structure Fires (47.4%), and Outside Fires (37.6%).
Fire incident types reported to NFIRS in Zip Code 49326


 Nearest zip codes: 49347, 48838, 49322, 48885, 48809, 49339.


 According to the data from the years 2002 - 2018 the average number of fire incidents per year is 17. The highest number of fires - 34 took place in 2003, and the least - 6 in 2005. The data has an increasing trend.
 When looking into fire subcategories, the most reports belonged to: Structure Fires (47.4%), and Outside Fires (37.6%).