Estimated zip code population in 2022: 2,457 Zip code population in 2010: 2,285 Zip code population in 2000: 2,237
Houses and condos: 1,067 Renter-occupied apartments: 135
% of renters here:
14%
State:
27%
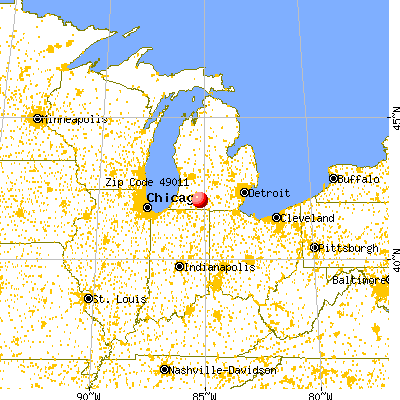
March 2022 cost of living index in zip code 49011: 80.9 (low, U.S. average is 100)
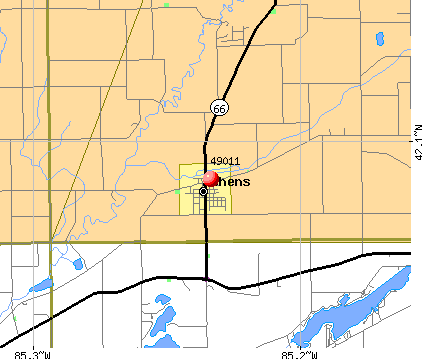
Land area: 32.3 sq. mi. Water area: 0.2 sq. mi.
Population density: 76 people per square mile
(very low).
OSM Map
General Map
Google Map
MSN Map
OSM Map
General Map
Google Map
MSN Map
OSM Map
General Map
Google Map
MSN Map
OSM Map
General Map
Google Map
MSN Map
Please wait while loading the map...
Real estate property taxes paid for housing units in 2022:
This zip code:
1.3% ($1,716)
Michigan:
1.2% ($2,746)
Median real estate property taxes paid for housing units with mortgages in 2022: $1,713 (1.5%) Median real estate property taxes paid for housing units with no mortgage in 2022: $1,750 (1.2%)
Business Search- 14 Million verified businesses
Males: 1,217
(49.5%)
Females: 1,239
(50.5%)
For population 25 years and over in 49011:
High school or higher: 92.3%
Bachelor's degree or higher: 13.1%
Graduate or professional degree: 4.0%
Unemployed: 2.0%
Mean travel time to work (commute): 26.0 minutes
For population 15 years and over in 49011:
Never married: 28.1%
Now married: 42.8%
Separated: 1.3%
Widowed: 9.4%
Divorced: 18.5%
Zip code 49011 compared to state average:
Median house value below state average.
Unemployed percentage below state average.
Black race population percentage significantly below state average.
Median age above state average.
Foreign-born population percentage significantly below state average.
Renting percentage below state average.
Length of stay since moving in significantly above state average.
Number of college students below state average.
Percentage of population with a bachelor's degree or higher significantly below state average.
Estimated median house/condo value in 2022: $136,693
49011:
$136,693
Michigan:
$224,400
According to our research of Michigan and other state lists, there were 5 registered sex offenders living in 49011 zip code as of May 28, 2024. The ratio of all residents to sex offenders in zip code 49011 is 441 to 1. The ratio of registered sex offenders to all residents in this zip code is lower than the state average.
Median resident age:
This zip code:
45.7 years
Michigan median age:
40.3 years
Average household size:
This zip code:
2.6 people
Michigan:
2.4 people
Averages for the 2020 tax year for zip code 49011, filed in 2021:
Average Adjusted Gross Income (AGI) in 2020: $51,961 (Individual Income Tax Returns)
Here:
$51,961
State:
$68,945
Salary/wage: $46,032 (reported on 76.2% of returns)
Here:
$46,032
State:
$57,142
(% of AGI for various income ranges: 937.8% for AGIs below $25k, 3247.5% for AGIs $25k-50k, 5703.8% for AGIs $50k-75k, 7476.2% for AGIs $75k-100k, 16848.8% for AGIs $100k-200k)
Taxable interest for individuals: $572 (reported on 27.6% of returns)
This zip code:
$572
Michigan:
$1,630
(% of AGI for various income ranges: 5.7% for AGIs below $25k, 25.0% for AGIs $25k-50k, 8.5% for AGIs $50k-75k, 28.7% for AGIs $75k-100k, 73.8% for AGIs $100k-200k)
Ordinary dividends: $2,783 (reported on 11.4% of returns)
Here:
$2,783
State:
$6,972
(% of AGI for various income ranges: 15.7% for AGIs below $25k, 12.1% for AGIs $25k-50k, 92.3% for AGIs $50k-75k, 186.2% for AGIs $100k-200k)
Net capital gain/loss in AGI: +$1,280 (reported on 9.5% of returns)
Here:
+$1,280
State:
+$20,064
(% of AGI for various income ranges: 12.6% for AGIs below $25k, 126.2% for AGIs $100k-200k)
Profit/loss from business: +$7,823 (reported on 12.4% of returns)
Here:
+$7,823
State:
+$11,172
(% of AGI for various income ranges: 84.8% for AGIs below $25k, 108.7% for AGIs $25k-50k, 237.7% for AGIs $50k-75k, 315.0% for AGIs $100k-200k)
Taxable individual retirement arrangement distribution: $15,018 (reported on 10.5% of returns)
49011:
$15,018
Michigan:
$19,803
(% of AGI for various income ranges: 134.3% for AGIs below $25k, 195.8% for AGIs $25k-50k, 1091.2% for AGIs $75k-100k)
Earned income credit: $2,127 (reported on 14.3% of returns)
Here:
$2,127
State:
$2,251
(% of AGI for various income ranges: 81.3% for AGIs below $25k, 55.0% for AGIs $25k-50k)
Percentage of individuals using paid preparers for their 2020 taxes: 92.4%
Here:
92%
State:
93%
(% for various income ranges: 88.2% for AGIs below $25k, 93.3% for AGIs $25k-50k, 94.1% for AGIs $50k-75k, 100.0% for AGIs $75k-100k, 92.9% for AGIs $100k-200k)
Averages for the 2012 tax year for zip code 49011, filed in 2013:
Average Adjusted Gross Income (AGI) in 2012: $43,115 (Individual Income Tax Returns)
Here:
$43,115
State:
$55,609
Salary/wage: $40,950 (reported on 78.1% of returns)
Here:
$40,950
State:
$46,782
(% of AGI for various income ranges: 63.7% for AGIs below $25k, 73.8% for AGIs $25k-50k, 78.7% for AGIs $50k-75k, 77.3% for AGIs $75k-100k, 73.2% for AGIs $100k-200k)
Taxable interest for individuals: $612 (reported on 32.4% of returns)
This zip code:
$612
Michigan:
$1,491
(% of AGI for various income ranges: 1.1% for AGIs below $25k, 0.4% for AGIs $25k-50k, 0.1% for AGIs $50k-75k, 0.4% for AGIs $75k-100k, 0.6% for AGIs $100k-200k)
Ordinary dividends: $1,836 (reported on 13.3% of returns)
Here:
$1,836
State:
$6,225
(% of AGI for various income ranges: 0.9% for AGIs below $25k, 0.3% for AGIs $25k-50k, 0.7% for AGIs $50k-75k, 0.9% for AGIs $100k-200k)
Net capital gain/loss in AGI: +$2,656 (reported on 8.6% of returns)
Here:
+$2,656
State:
+$9,326
(% of AGI for various income ranges: 0.1% for AGIs below $25k, 0.8% for AGIs $50k-75k, 2.0% for AGIs $75k-100k)
Profit/loss from business: +$5,780 (reported on 14.3% of returns)
Here:
+$5,780
State:
+$11,523
(% of AGI for various income ranges: 5.4% for AGIs below $25k, 2.8% for AGIs $25k-50k, 3.8% for AGIs $75k-100k)
Taxable individual retirement arrangement distribution: $10,009 (reported on 10.5% of returns)
49011:
$10,009
Michigan:
$15,298
(% of AGI for various income ranges: 3.9% for AGIs below $25k, 2.5% for AGIs $25k-50k, 6.5% for AGIs $50k-75k)
Total itemized deductions: $17,704 (22% of AGI, reported on 22.9% of returns)
Here:
$17,704
State:
$21,628
Here:
22.5% of AGI
State:
18.4% of AGI
(% of AGI for various income ranges: 7.5% for AGIs below $25k, 6.8% for AGIs $25k-50k, 9.9% for AGIs $50k-75k, 12.3% for AGIs $75k-100k, 9.9% for AGIs $100k-200k)
Charity contributions: $2,889 (reported on 17.1% of returns)
Here:
$2,889
State:
$4,225
(% of AGI for various income ranges: 1.4% for AGIs $25k-50k, 1.5% for AGIs $50k-75k, 1.1% for AGIs $75k-100k, 1.1% for AGIs $100k-200k)
Taxes paid: $5,821 (reported on 22.9% of returns)
49011:
$5,821
State:
$8,327
(% of AGI for various income ranges: 0.9% for AGIs below $25k, 2.0% for AGIs $25k-50k, 3.0% for AGIs $50k-75k, 4.2% for AGIs $75k-100k, 4.3% for AGIs $100k-200k)
Earned income credit: $2,095 (reported on 18.1% of returns)
Here:
$2,095
State:
$2,306
(% of AGI for various income ranges: 5.9% for AGIs below $25k, 0.9% for AGIs $25k-50k)
Percentage of individuals using paid preparers for their 2012 taxes: 58.1%
Here:
58%
State:
57%
(% for various income ranges: 56.8% for AGIs below $25k, 55.6% for AGIs $25k-50k, 56.2% for AGIs $50k-75k, 66.7% for AGIs $75k-100k, 66.7% for AGIs $100k-200k)
Averages for the 2004 tax year for zip code 49011, filed in 2005:
Average Adjusted Gross Income (AGI) in 2004: $36,553 (Individual Income Tax Returns)
Here:
$36,553
State:
$48,204
Salary/wage: $36,740 (reported on 81.9% of returns)
Here:
$36,740
State:
$42,791
(% of AGI for various income ranges: 124.0% for AGIs below $10k, 63.0% for AGIs $10k-25k, 81.0% for AGIs $25k-50k, 80.2% for AGIs $50k-75k, 92.8% for AGIs $75k-100k, 87.1% for AGIs over 100k)
Taxable interest for individuals: $1,074 (reported on 43.2% of returns)
This zip code:
$1,074
Michigan:
$1,725
(% of AGI for various income ranges: 4.9% for AGIs below $10k, 2.8% for AGIs $10k-25k, 1.4% for AGIs $25k-50k, 1.3% for AGIs $50k-75k, 0.2% for AGIs $75k-100k, 0.5% for AGIs over 100k)
Taxable dividends: $1,111 (reported on 19.6% of returns)
Here:
$1,111
State:
$3,420
(% of AGI for various income ranges: 3.7% for AGIs below $10k, 1.2% for AGIs $10k-25k, 0.4% for AGIs $25k-50k, 0.5% for AGIs $50k-75k, 0.6% for AGIs $75k-100k, 0.3% for AGIs over 100k)
Net capital gain/loss: +$1,504 (reported on 12.9% of returns)
Here:
+$1,504
State:
+$8,532
(% of AGI for various income ranges: -2.2% for AGIs below $10k, -0.2% for AGIs $10k-25k, 0.5% for AGIs $25k-50k, 0.9% for AGIs $50k-75k, 1.2% for AGIs over 100k)
Profit/loss from business: +$4,368 (reported on 13.6% of returns)
Here:
+$4,368
State:
+$9,547
(% of AGI for various income ranges: 4.1% for AGIs below $10k, 6.8% for AGIs $10k-25k, 1.6% for AGIs $25k-50k, 1.2% for AGIs $50k-75k, 0.3% for AGIs $75k-100k)
IRA payment deduction: $2,273 (reported on 1.0% of returns)
49011:
$2,273
Michigan:
$2,875
Total itemized deductions: $14,338 (22% of AGI, reported on 25.7% of returns)
Here:
$14,338
State:
$18,509
Here:
22.0% of AGI
State:
20.7% of AGI
(% of AGI for various income ranges: 5.9% for AGIs $10k-25k, 9.2% for AGIs $25k-50k, 11.3% for AGIs $50k-75k, 11.6% for AGIs $75k-100k, 11.8% for AGIs over 100k)
Charity contributions deductions: $2,370 (3% of AGI, reported on 20.7% of returns)
Here:
$2,370
State:
$3,365
Here:
3.5% of AGI
State:
3.6% of AGI
(% of AGI for various income ranges: 0.8% for AGIs $10k-25k, 1.0% for AGIs $25k-50k, 1.4% for AGIs $50k-75k, 1.7% for AGIs $75k-100k, 1.9% for AGIs over 100k)
Total tax: $4,199 (reported on 75.0% of returns)
49011:
$4,199
State:
$7,691
(% of AGI for various income ranges: 3.4% for AGIs below $10k, 4.2% for AGIs $10k-25k, 6.4% for AGIs $25k-50k, 8.5% for AGIs $50k-75k, 9.5% for AGIs $75k-100k, 14.6% for AGIs over 100k)
Earned income credit: $1,500 (reported on 13.4% of returns)
Here:
$1,500
State:
$1,737
Percentage of individuals using paid preparers for their 2004 taxes: 57.7%
Here:
58%
State:
60%
(% for various income ranges: 49.6% for AGIs below $10k, 57.0% for AGIs $10k-25k, 61.2% for AGIs $25k-50k, 64.9% for AGIs $50k-75k, 59.7% for AGIs $75k-100k, 49.1% for AGIs over 100k)
Likely homosexual households (counted as self-reported same-sex unmarried-partner households)
Lesbian couples: 0.5% of all households
Gay men: 0.0% of all households
Household received Food Stamps/SNAP in the past 12 months: 72 Household did not receive Food Stamps/SNAP in the past 12 months: 854
Women who had a birth in the past 12 months: 23 (13 now married, 10 unmarried) Women who did not have a birth in the past 12 months: 461 (132 now married, 330 unmarried)
Housing units in zip code 49011 with a mortgage: 434 (72 second mortgage, 75 both second mortgage and home equity loan) Houses without a mortgage: 8
Median monthly owner costs for units with a mortgage: $1,168 Median monthly owner costs for units without a mortgage: $486
Residents with income below the poverty level in 2022:
This zip code:
7.8%
Whole state:
13.4%
Residents with income below 50% of the poverty level in 2022:
This zip code:
3.1%
Whole state:
6.9%
Median number of rooms in houses and condos:
Here:
6.3
State:
6.5
Median number of rooms in apartments:
Here:
5.2
State:
4.3
Notable locations in this zip code not listed on our city pages
Churches in zip code 49011 include: Athens Church (A), Keeler United Methodist Church (B), Keeler General Baptist Church (C), Athens United Methodist Church (D), Congregational Church (E), Athens Christian Church (F), North Athens Baptist Church (G). Display/hide their locations on the map
Cemeteries: Old Burg Cemetery (1), Burr Oak Cemetery (2), North Athens Cemetery (3), Walker Cemetery (4), Factoryville Cemetery (5), Stimpson Cemetery (6). Display/hide their locations on the map
Size of family households: 361 2-persons, 89 3-persons, 114 4-persons, 49 5-persons, 4 6-persons, 17 7-or-more-persons
Size of nonfamily households: 229 1-person, 55 2-persons, 11 3-persons
308 married couples with children.
157 single-parent households (31 men, 126 women).
97.3% of residents of 49011 zip code speak English at home.
1.5% of residents speak Spanish at home (69% very well, 31% well).
0.8% of residents speak other Indo-European language at home (84% very well, 16% well).
Foreign born population: 27 (1.1%) (71.4% of them are naturalized citizens)
This zip code:
1.1%
Whole state:
6.9%
52%Honduras
30%Chile
26%German
16%English
16%Irish
11%American
3%Canadian
2%Italian
2%Scottish
Year of entry for the foreign-born population
02010 or later
02000 to 2009
61990 to 1999
33Before 1990
Facilities with environmental interests located in this zip code:
ATHENS HIGH SCHOOL (300 E. HOLCOMB STREET in ATHENS, MI)
(National Center for Education Statistics) - STATE ID-00136 Organizations: ATHENS AREA SCHOOLS (SCHOOL DISTRICT)
ATHENS MIDDLE SCHOOL (515 E. WILLIAMS STREET in ATHENS, MI)
(National Center for Education Statistics) - STATE ID-00137 Organizations: ATHENS AREA SCHOOLS (SCHOOL DISTRICT)
MCLEIEER OIL ATHENS (333 W MILL ST in ATHENS, MI)
(Resource Conservation and Recovery Act (tracking hazardous waste))
ATHENS SCHOOLS (300 E HOLCOMB in ATHENS, MI)
Conditionally Exempt Small Quantity Generators, less than 100 kg/month of hazardous waste (Resource Conservation and Recovery Act (tracking hazardous waste)) Organizations: ATHENS PUBLIC SCHOOLS (CONTACT/OPERATOR)
Housing units lacking complete plumbing facilities: 2.6% Housing units lacking complete kitchen facilities: 3.9%
64.2%Utility gas
16.5%Bottled, tank, or LP gas
12.8%Wood
2.6%Electricity
2.3%Other fuel
1.8%Fuel oil, kerosene, etc.
Population in 1990: 2,436.
Place of birth for U.S.-born residents:
This state: 1,924
Northeast: 18
Midwest: 223
South: 163
West: 85
65% of the 49011 zip code residents lived in the same house 5 years ago. Out of people who lived in different houses, 45% lived in this county. Out of people who lived in different counties, 50% lived in Michigan.
93% of the 49011 zip code residents lived in the same house 1 year ago. Out of people who lived in different houses, 25% moved from this county. Out of people who lived in different houses, 64% moved from different county within same state. Out of people who lived in different houses, 4% moved from different state. Out of people who lived in different houses, 7% moved from abroad.
Private vs. public school enrollment:
Students in private schools in grades 1 to 8 (elementary and middle school): 10
Here:
4.6%
Michigan:
12.4%
Students in private schools in grades 9 to 12 (high school): 9
Here:
5.9%
Michigan:
9.8%
Students in private undergraduate colleges: 5
Here:
12.2%
Michigan:
14.9%
Occupation by median earnings in the past 12 months ($)
58,141Construction and extraction occupations
56,054Management occupations
55,487Education, training, and library occupations
54,596Computer and mathematical occupations
54,432Health diagnosing and treating practitioners and other technical occupations
51,093Health technologists and technicians
Top industries in this zip code by the number of employees in 2005:
Wholesale Trade: Farm and Garden Machinery and Equipment Merchant Wholesalers (20-49 employees: 1 establishment)
Health Care and Social Assistance: Child Day Care Services (20-49: 1)
Accommodation and Food Services: Full-Service Restaurants (5-9: 2, 1-4: 1)
Other Services (except Public Administration): Funeral Homes and Funeral Services (10-19: 1)
Educational Services: Elementary and Secondary Schools (10-19: 1)
Professional, Scientific, and Technical Services: Building Inspection Services (10-19: 1)
Home Mortgage Disclosure Act Aggregated Statistics For Year 2009 (Based on 2 partial tracts)
A) FHA, FSA/RHS & VA Home Purchase Loans
B) Conventional Home Purchase Loans
C) Refinancings
D) Home Improvement Loans
F) Non-occupant Loans on < 5 Family Dwellings (A B C & D)
G) Loans On Manufactured Home Dwelling (A B C & D)
Number
Average Value
Number
Average Value
Number
Average Value
Number
Average Value
Number
Average Value
Number
Average Value
LOANS ORIGINATED
14
$77,434
12
$81,385
42
$120,685
3
$70,663
0
$0
4
$92,472
APPLICATIONS APPROVED, NOT ACCEPTED
1
$89,910
1
$38,010
4
$106,178
0
$0
0
$0
1
$149,120
APPLICATIONS DENIED
3
$104,777
2
$46,420
26
$115,132
4
$39,108
0
$0
4
$76,208
APPLICATIONS WITHDRAWN
2
$91,740
2
$70,540
15
$118,373
1
$60,670
1
$86,260
1
$143,280
FILES CLOSED FOR INCOMPLETENESS
0
$0
0
$0
1
$103,800
0
$0
0
$0
0
$0
Aggregated Statistics For Year 2008 (Based on 2 partial tracts)
A) FHA, FSA/RHS & VA Home Purchase Loans
B) Conventional Home Purchase Loans
C) Refinancings
D) Home Improvement Loans
F) Non-occupant Loans on < 5 Family Dwellings (A B C & D)
G) Loans On Manufactured Home Dwelling (A B C & D)
Number
Average Value
Number
Average Value
Number
Average Value
Number
Average Value
Number
Average Value
Number
Average Value
LOANS ORIGINATED
5
$82,750
16
$92,152
34
$102,232
7
$71,847
7
$71,116
7
$65,059
APPLICATIONS APPROVED, NOT ACCEPTED
0
$0
1
$241,230
7
$51,379
0
$0
1
$65,790
1
$81,870
APPLICATIONS DENIED
2
$70,175
2
$58,480
29
$129,387
5
$45,030
0
$0
7
$95,761
APPLICATIONS WITHDRAWN
1
$31,430
1
$25,590
14
$106,465
1
$96,490
1
$25,590
1
$115,500
FILES CLOSED FOR INCOMPLETENESS
0
$0
0
$0
1
$143,280
1
$70,180
0
$0
0
$0
Aggregated Statistics For Year 2007 (Based on 2 partial tracts)
A) FHA, FSA/RHS & VA Home Purchase Loans
B) Conventional Home Purchase Loans
C) Refinancings
D) Home Improvement Loans
F) Non-occupant Loans on < 5 Family Dwellings (A B C & D)
G) Loans On Manufactured Home Dwelling (A B C & D)
Number
Average Value
Number
Average Value
Number
Average Value
Number
Average Value
Number
Average Value
Number
Average Value
LOANS ORIGINATED
3
$114,523
31
$82,485
49
$106,547
20
$35,308
5
$48,392
10
$44,445
APPLICATIONS APPROVED, NOT ACCEPTED
1
$68,710
4
$65,425
18
$105,467
2
$21,930
0
$0
2
$84,065
APPLICATIONS DENIED
0
$0
12
$75,597
58
$94,664
11
$39,540
3
$66,033
11
$72,369
APPLICATIONS WITHDRAWN
1
$86,260
1
$90,640
17
$119,110
5
$90,498
0
$0
1
$18,270
FILES CLOSED FOR INCOMPLETENESS
0
$0
0
$0
4
$58,115
1
$102,340
1
$55,560
1
$8,040
Aggregated Statistics For Year 2006 (Based on 2 partial tracts)
A) FHA, FSA/RHS & VA Home Purchase Loans
B) Conventional Home Purchase Loans
C) Refinancings
D) Home Improvement Loans
F) Non-occupant Loans on < 5 Family Dwellings (A B C & D)
G) Loans On Manufactured Home Dwelling (A B C & D)
Number
Average Value
Number
Average Value
Number
Average Value
Number
Average Value
Number
Average Value
Number
Average Value
LOANS ORIGINATED
4
$101,792
41
$94,192
64
$86,007
16
$36,368
4
$63,780
13
$63,878
APPLICATIONS APPROVED, NOT ACCEPTED
2
$19,370
4
$86,622
17
$109,349
1
$17,540
0
$0
0
$0
APPLICATIONS DENIED
1
$100,880
9
$63,353
72
$94,664
25
$69,240
3
$71,393
10
$72,369
APPLICATIONS WITHDRAWN
1
$166,670
4
$70,542
31
$97,176
4
$107,458
2
$77,120
3
$70,663
FILES CLOSED FOR INCOMPLETENESS
1
$70,910
1
$71,640
14
$106,987
0
$0
0
$0
1
$70,910
Aggregated Statistics For Year 2005 (Based on 2 partial tracts)
A) FHA, FSA/RHS & VA Home Purchase Loans
B) Conventional Home Purchase Loans
C) Refinancings
D) Home Improvement Loans
F) Non-occupant Loans on < 5 Family Dwellings (A B C & D)
G) Loans On Manufactured Home Dwelling (A B C & D)
Number
Average Value
Number
Average Value
Number
Average Value
Number
Average Value
Number
Average Value
Number
Average Value
LOANS ORIGINATED
8
$101,791
37
$92,106
80
$88,835
29
$37,331
6
$76,147
15
$68,617
APPLICATIONS APPROVED, NOT ACCEPTED
0
$0
4
$57,565
12
$100,269
1
$144,740
1
$94,300
1
$22,660
APPLICATIONS DENIED
3
$101,123
19
$87,374
77
$96,511
15
$47,564
3
$66,033
16
$64,648
APPLICATIONS WITHDRAWN
0
$0
7
$80,931
39
$98,348
5
$118,130
2
$52,630
5
$98,392
FILES CLOSED FOR INCOMPLETENESS
0
$0
4
$62,500
15
$111,599
1
$21,930
0
$0
1
$109,650
Aggregated Statistics For Year 2004 (Based on 2 partial tracts)
A) FHA, FSA/RHS & VA Home Purchase Loans
B) Conventional Home Purchase Loans
C) Refinancings
D) Home Improvement Loans
E) Loans on Dwellings For 5+ Families
F) Non-occupant Loans on < 5 Family Dwellings (A B C & D)
G) Loans On Manufactured Home Dwelling (A B C & D)
Number
Average Value
Number
Average Value
Number
Average Value
Number
Average Value
Number
Average Value
Number
Average Value
Number
Average Value
LOANS ORIGINATED
6
$108,918
34
$87,871
106
$93,892
11
$38,477
0
$0
7
$63,597
10
$70,980
APPLICATIONS APPROVED, NOT ACCEPTED
1
$49,710
5
$94,006
25
$98,363
2
$46,785
0
$0
1
$48,980
4
$88,450
APPLICATIONS DENIED
1
$129,390
16
$80,364
69
$87,890
6
$37,525
1
$383,770
3
$74,317
9
$60,754
APPLICATIONS WITHDRAWN
0
$0
4
$58,298
39
$94,018
4
$81,325
0
$0
1
$78,950
1
$46,780
FILES CLOSED FOR INCOMPLETENESS
0
$0
1
$98,690
10
$83,480
0
$0
0
$0
1
$19,740
0
$0
Aggregated Statistics For Year 2003 (Based on 2 partial tracts)
A) FHA, FSA/RHS & VA Home Purchase Loans
B) Conventional Home Purchase Loans
C) Refinancings
D) Home Improvement Loans
F) Non-occupant Loans on < 5 Family Dwellings (A B C & D)
Number
Average Value
Number
Average Value
Number
Average Value
Number
Average Value
Number
Average Value
LOANS ORIGINATED
8
$91,558
29
$98,408
137
$97,415
3
$34,600
2
$89,180
APPLICATIONS APPROVED, NOT ACCEPTED
0
$0
3
$54,093
20
$89,840
1
$2,190
1
$68,710
APPLICATIONS DENIED
2
$102,705
10
$65,863
56
$84,365
10
$20,614
1
$13,160
APPLICATIONS WITHDRAWN
0
$0
2
$110,380
28
$101,035
0
$0
1
$69,440
FILES CLOSED FOR INCOMPLETENESS
1
$304,100
3
$57,507
4
$83,335
0
$0
0
$0
Aggregated Statistics For Year 2002 (Based on 2 partial tracts)
A) FHA, FSA/RHS & VA Home Purchase Loans
B) Conventional Home Purchase Loans
C) Refinancings
D) Home Improvement Loans
F) Non-occupant Loans on < 5 Family Dwellings (A B C & D)
Number
Average Value
Number
Average Value
Number
Average Value
Number
Average Value
Number
Average Value
LOANS ORIGINATED
7
$89,287
29
$85,930
107
$90,890
6
$14,255
10
$49,854
APPLICATIONS APPROVED, NOT ACCEPTED
0
$0
6
$75,415
29
$99,618
2
$19,735
0
$0
APPLICATIONS DENIED
1
$38,010
14
$50,439
52
$77,500
4
$26,865
4
$63,048
APPLICATIONS WITHDRAWN
1
$107,460
4
$58,662
24
$80,014
1
$25,590
1
$65,790
FILES CLOSED FOR INCOMPLETENESS
0
$0
2
$71,640
12
$84,248
0
$0
0
$0
Aggregated Statistics For Year 2001 (Based on 2 partial tracts)
A) FHA, FSA/RHS & VA Home Purchase Loans
B) Conventional Home Purchase Loans
C) Refinancings
D) Home Improvement Loans
F) Non-occupant Loans on < 5 Family Dwellings (A B C & D)
Number
Average Value
Number
Average Value
Number
Average Value
Number
Average Value
Number
Average Value
LOANS ORIGINATED
5
$92,838
23
$89,754
94
$93,070
9
$18,600
5
$56,872
APPLICATIONS APPROVED, NOT ACCEPTED
2
$87,720
4
$75,842
18
$69,770
4
$25,402
0
$0
APPLICATIONS DENIED
1
$58,480
10
$56,360
54
$77,378
12
$17,178
3
$38,257
APPLICATIONS WITHDRAWN
0
$0
4
$43,130
29
$85,023
1
$62,870
0
$0
FILES CLOSED FOR INCOMPLETENESS
0
$0
1
$29,240
10
$82,895
1
$27,050
0
$0
Aggregated Statistics For Year 2000 (Based on 2 partial tracts)
A) FHA, FSA/RHS & VA Home Purchase Loans
B) Conventional Home Purchase Loans
C) Refinancings
D) Home Improvement Loans
F) Non-occupant Loans on < 5 Family Dwellings (A B C & D)
Number
Average Value
Number
Average Value
Number
Average Value
Number
Average Value
Number
Average Value
LOANS ORIGINATED
7
$96,283
26
$76,586
42
$70,019
13
$19,793
2
$48,610
APPLICATIONS APPROVED, NOT ACCEPTED
1
$68,710
7
$80,514
12
$74,928
8
$24,945
0
$0
APPLICATIONS DENIED
3
$84,310
13
$68,545
34
$53,406
7
$8,771
1
$730
APPLICATIONS WITHDRAWN
1
$141,810
4
$80,775
17
$59,383
0
$0
0
$0
FILES CLOSED FOR INCOMPLETENESS
0
$0
1
$43,860
7
$58,793
0
$0
0
$0
Aggregated Statistics For Year 1999 (Based on 1 partial tract)
A) FHA, FSA/RHS & VA Home Purchase Loans
B) Conventional Home Purchase Loans
C) Refinancings
D) Home Improvement Loans
F) Non-occupant Loans on < 5 Family Dwellings (A B C & D)
Detailed PMIC statistics for the following Tracts:0028.00
2002 - 2018 National Fire Incident Reporting System (NFIRS) incidents
Based on the data from the years 2002 - 2018 the average number of fire incidents per year is 17. The highest number of reported fires - 38 took place in 2010, and the least - 7 in 2015. The data has a declining trend.
When looking into fire subcategories, the most incidents belonged to: Structure Fires (50.0%), and Outside Fires (34.1%).
Fire incident types reported to NFIRS in Zip Code 49011


 Nearest zip codes: 49051, 49089, 49052, 49094, 49029, 49066.


 Based on the data from the years 2002 - 2018 the average number of fire incidents per year is 17. The highest number of reported fires - 38 took place in 2010, and the least - 7 in 2015. The data has a declining trend.
 When looking into fire subcategories, the most incidents belonged to: Structure Fires (50.0%), and Outside Fires (34.1%).