Estimated zip code population in 2022: 991 Zip code population in 2010: 975 Zip code population in 2000: 850
Houses and condos: 374 Renter-occupied apartments: 48
% of renters here:
14%
State:
27%
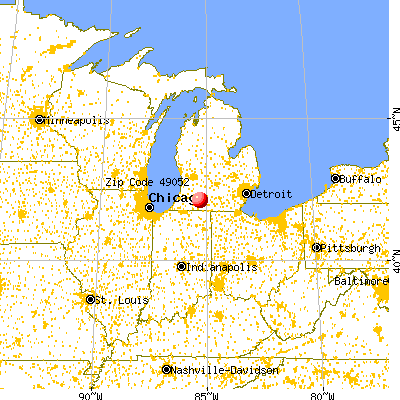
March 2022 cost of living index in zip code 49052: 81.3 (low, U.S. average is 100)
Land area: 30.8 sq. mi. Water area: 0.0 sq. mi.
Population density: 32 people per square mile
(very low).
OSM Map
General Map
Google Map
MSN Map
OSM Map
General Map
Google Map
MSN Map
OSM Map
General Map
Google Map
MSN Map
OSM Map
General Map
Google Map
MSN Map
Please wait while loading the map...
Real estate property taxes paid for housing units in 2022:
This zip code:
1.1% ($1,843)
Michigan:
1.2% ($2,746)
Median real estate property taxes paid for housing units with mortgages in 2022: $2,113 (1.1%) Median real estate property taxes paid for housing units with no mortgage in 2022: $1,624 (1.1%)
Business Search- 14 Million verified businesses
Males: 512
(51.7%)
Females: 479
(48.3%)
For population 25 years and over in 49052:
High school or higher: 92.7%
Bachelor's degree or higher: 20.6%
Graduate or professional degree: 10.8%
Unemployed: 12.9%
Mean travel time to work (commute): 22.8 minutes
For population 15 years and over in 49052:
Never married: 27.5%
Now married: 53.5%
Separated: 3.1%
Widowed: 6.1%
Divorced: 9.8%
Zip code 49052 compared to state average:
Unemployed percentage above state average.
Black race population percentage significantly below state average.
Foreign-born population percentage significantly below state average.
Renting percentage below state average.
Length of stay since moving in significantly above state average.
Percentage of population with a bachelor's degree or higher below state average.
Estimated median house/condo value in 2022: $171,397
49052:
$171,397
Michigan:
$224,400
According to our research of Michigan and other state lists, there were 2 registered sex offenders living in 49052 zip code as of May 29, 2024. The ratio of all residents to sex offenders in zip code 49052 is 451 to 1. The ratio of registered sex offenders to all residents in this zip code is lower than the state average.
Median resident age:
This zip code:
38.2 years
Michigan median age:
40.3 years
Average household size:
This zip code:
2.8 people
Michigan:
2.4 people
Averages for the 2020 tax year for zip code 49052, filed in 2021:
Average Adjusted Gross Income (AGI) in 2020: $51,467 (Individual Income Tax Returns)
Here:
$51,467
State:
$68,945
Salary/wage: $47,444 (reported on 75.6% of returns)
Here:
$47,444
State:
$57,142
(% of AGI for various income ranges: 1035.5% for AGIs below $25k, 3096.7% for AGIs $25k-50k, 6462.0% for AGIs $50k-75k, 8516.7% for AGIs $75k-100k, 12838.0% for AGIs $100k-200k)
Taxable interest for individuals: $317 (reported on 26.7% of returns)
This zip code:
$317
Michigan:
$1,630
(% of AGI for various income ranges: 2.7% for AGIs below $25k, 7.8% for AGIs $25k-50k, 10.0% for AGIs $75k-100k, 50.0% for AGIs $100k-200k)
Ordinary dividends: $900 (reported on 13.3% of returns)
Here:
$900
State:
$6,972
(% of AGI for various income ranges: 9.1% for AGIs below $25k, 146.7% for AGIs $75k-100k)
Net capital gain/loss in AGI: +$3,400 (reported on 11.1% of returns)
Here:
+$3,400
State:
+$20,064
(% of AGI for various income ranges: 87.3% for AGIs below $25k, 246.7% for AGIs $75k-100k)
Profit/loss from business: +$6,250 (reported on 8.9% of returns)
Here:
+$6,250
State:
+$11,172
(% of AGI for various income ranges: 277.8% for AGIs $25k-50k)
Taxable individual retirement arrangement distribution: $9,300 (reported on 11.1% of returns)
49052:
$9,300
Michigan:
$19,803
(% of AGI for various income ranges: 130.9% for AGIs below $25k, 642.0% for AGIs $50k-75k)
Earned income credit: $1,729 (reported on 15.6% of returns)
Here:
$1,729
State:
$2,251
(% of AGI for various income ranges: 68.2% for AGIs below $25k, 51.1% for AGIs $25k-50k)
Percentage of individuals using paid preparers for their 2020 taxes: 97.8%
Here:
98%
State:
93%
(% for various income ranges: 93.3% for AGIs below $25k, 100.0% for AGIs $25k-50k, 100.0% for AGIs $50k-75k, 100.0% for AGIs $75k-100k, 100.0% for AGIs $100k-200k)
Averages for the 2012 tax year for zip code 49052, filed in 2013:
Average Adjusted Gross Income (AGI) in 2012: $44,823 (Individual Income Tax Returns)
Here:
$44,823
State:
$55,609
Salary/wage: $41,323 (reported on 79.5% of returns)
Here:
$41,323
State:
$46,782
(% of AGI for various income ranges: 52.5% for AGIs below $25k, 77.1% for AGIs $25k-50k, 68.5% for AGIs $50k-75k, 81.1% for AGIs $75k-100k, 75.1% for AGIs $100k-200k)
Taxable interest for individuals: $229 (reported on 31.8% of returns)
This zip code:
$229
Michigan:
$1,491
(% of AGI for various income ranges: 0.3% for AGIs below $25k, 0.3% for AGIs $50k-75k, 0.3% for AGIs $75k-100k)
Ordinary dividends: $840 (reported on 11.4% of returns)
Here:
$840
State:
$6,225
Net capital gain/loss in AGI: +$200 (reported on 6.8% of returns)
Here:
+$200
State:
+$9,326
Profit/loss from business: +$5,367 (reported on 13.6% of returns)
Here:
+$5,367
State:
+$11,523
Taxable individual retirement arrangement distribution: $8,975 (reported on 9.1% of returns)
49052:
$8,975
Michigan:
$15,298
Total itemized deductions: $16,944 (21% of AGI, reported on 20.5% of returns)
Here:
$16,944
State:
$21,628
Here:
21.1% of AGI
State:
18.4% of AGI
(% of AGI for various income ranges: 12.4% for AGIs $25k-50k, 11.2% for AGIs $75k-100k, 9.2% for AGIs $100k-200k)
Charity contributions: $3,386 (reported on 15.9% of returns)
Here:
$3,386
State:
$4,225
Taxes paid: $5,811 (reported on 20.5% of returns)
49052:
$5,811
State:
$8,327
(% of AGI for various income ranges: 3.2% for AGIs $25k-50k, 3.9% for AGIs $75k-100k, 3.9% for AGIs $100k-200k)
Earned income credit: $2,014 (reported on 15.9% of returns)
Here:
$2,014
State:
$2,306
(% of AGI for various income ranges: 3.7% for AGIs below $25k, 1.4% for AGIs $25k-50k)
Percentage of individuals using paid preparers for their 2012 taxes: 63.6%
Here:
64%
State:
57%
(% for various income ranges: 62.5% for AGIs below $25k, 61.5% for AGIs $25k-50k, 66.7% for AGIs $50k-75k, 60.0% for AGIs $75k-100k, 75.0% for AGIs $100k-200k)
Averages for the 2004 tax year for zip code 49052, filed in 2005:
Average Adjusted Gross Income (AGI) in 2004: $40,118 (Individual Income Tax Returns)
Here:
$40,118
State:
$48,204
Salary/wage: $39,032 (reported on 85.3% of returns)
Here:
$39,032
State:
$42,791
(% of AGI for various income ranges: 72.8% for AGIs $10k-25k, 85.3% for AGIs $25k-50k, 85.8% for AGIs $50k-75k, 76.5% for AGIs $75k-100k, 78.4% for AGIs over 100k)
Taxable interest for individuals: $591 (reported on 42.9% of returns)
This zip code:
$591
Michigan:
$1,725
(% of AGI for various income ranges: 1.6% for AGIs $10k-25k, 0.3% for AGIs $25k-50k, 0.3% for AGIs $50k-75k, 0.8% for AGIs $75k-100k, 0.3% for AGIs over 100k)
Taxable dividends: $339 (reported on 13.6% of returns)
Here:
$339
State:
$3,420
(% of AGI for various income ranges: 0.4% for AGIs $10k-25k, 0.1% for AGIs $25k-50k, 0.1% for AGIs $50k-75k, 0.1% for AGIs $75k-100k)
Net capital gain/loss: +$231 (reported on 12.0% of returns)
Here:
+$231
State:
+$8,532
Profit/loss from business: +$4,286 (reported on 12.9% of returns)
Here:
+$4,286
State:
+$9,547
Total itemized deductions: $15,776 (22% of AGI, reported on 28.8% of returns)
Here:
$15,776
State:
$18,509
Here:
22.2% of AGI
State:
20.7% of AGI
(% of AGI for various income ranges: 12.2% for AGIs $25k-50k, 10.5% for AGIs $50k-75k, 16.3% for AGIs $75k-100k, 11.1% for AGIs over 100k)
Charity contributions deductions: $2,010 (3% of AGI, reported on 23.7% of returns)
Here:
$2,010
State:
$3,365
Here:
2.8% of AGI
State:
3.6% of AGI
(% of AGI for various income ranges: 0.9% for AGIs $25k-50k, 1.0% for AGIs $50k-75k, 2.2% for AGIs $75k-100k, 1.2% for AGIs over 100k)
Total tax: $4,985 (reported on 76.7% of returns)
49052:
$4,985
State:
$7,691
(% of AGI for various income ranges: 4.3% for AGIs $10k-25k, 5.9% for AGIs $25k-50k, 8.3% for AGIs $50k-75k, 10.3% for AGIs $75k-100k, 17.3% for AGIs over 100k)
Earned income credit: $1,643 (reported on 12.9% of returns)
Here:
$1,643
State:
$1,737
Percentage of individuals using paid preparers for their 2004 taxes: 64.3%
Here:
64%
State:
60%
(% for various income ranges: 51.9% for AGIs below $10k, 52.9% for AGIs $10k-25k, 70.1% for AGIs $25k-50k, 70.9% for AGIs $50k-75k, 80.4% for AGIs $75k-100k, 76.2% for AGIs over 100k)
Household received Food Stamps/SNAP in the past 12 months: 48 Household did not receive Food Stamps/SNAP in the past 12 months: 303
Women who had a birth in the past 12 months: 10 (0 now married, 10 unmarried) Women who did not have a birth in the past 12 months: 196 (129 now married, 66 unmarried)
Housing units in zip code 49052 with a mortgage: 167 (6 second mortgage, 6 both second mortgage and home equity loan) Houses without a mortgage: 10
Median monthly owner costs for units with a mortgage: $1,158 Median monthly owner costs for units without a mortgage: $557
Residents with income below the poverty level in 2022:
This zip code:
14.2%
Whole state:
13.4%
Residents with income below 50% of the poverty level in 2022:
This zip code:
4.8%
Whole state:
6.9%
Median number of rooms in houses and condos:
Here:
6.2
State:
6.5
Median number of rooms in apartments:
Here:
6.3
State:
4.3
Notable locations in this zip code not listed on our city pages
Churches in zip code 49052 include: Mission Church (A), Wakeshma Church (B), Fulton Christian Church (C), Faith Bible Church (D). Display/hide their locations on the map
In group quarters: 6 (-1 institutionalized population)
Size of family households: 101 2-persons, 52 3-persons, 42 4-persons, 42 5-persons, 19 6-persons
Size of nonfamily households: 80 1-person, 9 2-persons, 1 4-persons
150 married couples with children.
75 single-parent households (39 men, 36 women).
98.9% of residents of 49052 zip code speak English at home.
0.5% of residents speak Spanish at home (100% very well).
Foreign born population: 0 (0.0%)
:
0.0%
Whole state:
6.9%
44%German
11%English
8%Irish
4%Scottish
2%Dutch
2%American
1%British
Year of entry for the foreign-born population
02010 or later
02000 to 2009
01990 to 1999
21Before 1990
Facilities with environmental interests located in this zip code:
MDEQ-RRD-FULTON SUNOCO (MCCLEIEER OIL GAS STA.0-013083 in FULTON, MI)
National Pollutant Discharge Elimination System NON-MAJOR (Tracking pollutant discharge elimination systems) - permit
MCLEIEER OIL FULTON (13995 W AVE E in FULTON, MI)
(Resource Conservation and Recovery Act (tracking hazardous waste))
MI DEPT/STATE POLICE (T03S R11W SEC 3 PORTAGR TWP in FULTON, MI)
(Resource Conservation and Recovery Act (tracking hazardous waste))
Housing units lacking complete plumbing facilities: 0.7% Housing units lacking complete kitchen facilities: 6.4%
54.7%Bottled, tank, or LP gas
25.7%Wood
7.6%Other fuel
7.3%Utility gas
4.7%Fuel oil, kerosene, etc.
0.9%No fuel used
Population in 1990: 720. Population change in the 1990s: +130 (+18.1%).
Place of birth for U.S.-born residents:
This state: 886
Northeast: 13
Midwest: 48
South: 10
West: 7
69% of the 49052 zip code residents lived in the same house 5 years ago. Out of people who lived in different houses, 62% lived in this county. Out of people who lived in different counties, 50% lived in Michigan.
91% of the 49052 zip code residents lived in the same house 1 year ago. Out of people who lived in different houses, 8% moved from this county. Out of people who lived in different houses, 66% moved from different county within same state. Out of people who lived in different houses, 27% moved from different state.
Private vs. public school enrollment:
Students in private schools in grades 1 to 8 (elementary and middle school):
Here:
0.0%
Michigan:
12.4%
Students in private schools in grades 9 to 12 (high school): 1
Here:
2.6%
Michigan:
9.8%
Students in private undergraduate colleges: 14
Here:
56.8%
Michigan:
14.9%
Occupation by median earnings in the past 12 months ($)
110,120Installation, maintenance, and repair occupations
67,831Health diagnosing and treating practitioners and other technical occupations
65,138Community and social service occupations
60,976Management occupations
51,171Production occupations
47,971Education, training, and library occupations
Top industries in this zip code by the number of employees in 2005:
Administrative and Support and Waste Management and Remediation Services: Landscaping Services (1-4 employees: 1 establishment)
Construction: Electrical Contractors (1-4: 1)
Other Services (except Public Administration): Religious Organizations (1-4: 1)
Construction: Other Building Equipment Contractors (1-4: 1)
Health Care and Social Assistance: Child Day Care Services (1-4: 1)
Home Mortgage Disclosure Act Aggregated Statistics For Year 2009 (Based on 2 partial tracts)
A) FHA, FSA/RHS & VA Home Purchase Loans
B) Conventional Home Purchase Loans
C) Refinancings
D) Home Improvement Loans
F) Non-occupant Loans on < 5 Family Dwellings (A B C & D)
G) Loans On Manufactured Home Dwelling (A B C & D)
Number
Average Value
Number
Average Value
Number
Average Value
Number
Average Value
Number
Average Value
Number
Average Value
LOANS ORIGINATED
8
$97,241
5
$93,586
42
$115,263
6
$23,407
2
$66,660
1
$43,360
APPLICATIONS APPROVED, NOT ACCEPTED
0
$0
0
$0
3
$97,080
0
$0
0
$0
0
$0
APPLICATIONS DENIED
2
$108,730
1
$46,600
18
$142,312
3
$113,690
1
$75,720
1
$91,900
APPLICATIONS WITHDRAWN
3
$78,743
1
$25,890
8
$140,524
1
$44,660
0
$0
0
$0
FILES CLOSED FOR INCOMPLETENESS
0
$0
0
$0
1
$110,020
2
$80,900
0
$0
0
$0
Aggregated Statistics For Year 2008 (Based on 2 partial tracts)
A) FHA, FSA/RHS & VA Home Purchase Loans
B) Conventional Home Purchase Loans
C) Refinancings
D) Home Improvement Loans
F) Non-occupant Loans on < 5 Family Dwellings (A B C & D)
G) Loans On Manufactured Home Dwelling (A B C & D)
Number
Average Value
Number
Average Value
Number
Average Value
Number
Average Value
Number
Average Value
Number
Average Value
LOANS ORIGINATED
3
$76,153
10
$128,599
28
$157,662
6
$24,378
1
$84,140
2
$74,430
APPLICATIONS APPROVED, NOT ACCEPTED
1
$66,660
1
$141,090
5
$117,402
1
$56,950
1
$9,060
1
$67,310
APPLICATIONS DENIED
1
$95,790
2
$124,585
23
$157,889
4
$39,640
1
$129,440
3
$106,787
APPLICATIONS WITHDRAWN
3
$119,083
1
$116,500
6
$135,480
1
$71,840
0
$0
0
$0
FILES CLOSED FOR INCOMPLETENESS
0
$0
0
$0
2
$137,205
0
$0
0
$0
0
$0
Aggregated Statistics For Year 2007 (Based on 2 partial tracts)
A) FHA, FSA/RHS & VA Home Purchase Loans
B) Conventional Home Purchase Loans
C) Refinancings
D) Home Improvement Loans
F) Non-occupant Loans on < 5 Family Dwellings (A B C & D)
G) Loans On Manufactured Home Dwelling (A B C & D)
Number
Average Value
Number
Average Value
Number
Average Value
Number
Average Value
Number
Average Value
Number
Average Value
LOANS ORIGINATED
6
$130,303
13
$130,435
43
$96,794
9
$25,241
2
$76,370
6
$140,658
APPLICATIONS APPROVED, NOT ACCEPTED
0
$0
1
$116,500
11
$85,784
1
$11,000
0
$0
2
$112,935
APPLICATIONS DENIED
0
$0
5
$76,110
37
$120,292
8
$79,039
0
$0
5
$109,376
APPLICATIONS WITHDRAWN
1
$91,900
2
$114,555
13
$125,059
3
$107,437
0
$0
1
$123,620
FILES CLOSED FOR INCOMPLETENESS
0
$0
0
$0
3
$116,063
0
$0
0
$0
0
$0
Aggregated Statistics For Year 2006 (Based on 2 partial tracts)
A) FHA, FSA/RHS & VA Home Purchase Loans
B) Conventional Home Purchase Loans
C) Refinancings
D) Home Improvement Loans
F) Non-occupant Loans on < 5 Family Dwellings (A B C & D)
G) Loans On Manufactured Home Dwelling (A B C & D)
Number
Average Value
Number
Average Value
Number
Average Value
Number
Average Value
Number
Average Value
Number
Average Value
LOANS ORIGINATED
5
$111,836
24
$99,561
61
$101,144
11
$30,830
4
$102,258
8
$73,781
APPLICATIONS APPROVED, NOT ACCEPTED
1
$53,070
5
$126,980
16
$94,451
1
$52,420
1
$38,180
1
$83,490
APPLICATIONS DENIED
1
$52,420
5
$135,524
53
$114,823
12
$71,246
1
$92,550
10
$101,805
APPLICATIONS WITHDRAWN
1
$108,080
5
$54,494
32
$110,206
2
$57,275
1
$102,260
1
$97,080
FILES CLOSED FOR INCOMPLETENESS
1
$95,140
1
$71,190
15
$104,156
1
$77,020
0
$0
1
$67,310
Aggregated Statistics For Year 2005 (Based on 2 partial tracts)
A) FHA, FSA/RHS & VA Home Purchase Loans
B) Conventional Home Purchase Loans
C) Refinancings
D) Home Improvement Loans
F) Non-occupant Loans on < 5 Family Dwellings (A B C & D)
G) Loans On Manufactured Home Dwelling (A B C & D)
Number
Average Value
Number
Average Value
Number
Average Value
Number
Average Value
Number
Average Value
Number
Average Value
LOANS ORIGINATED
3
$129,870
30
$100,143
81
$113,787
12
$42,446
3
$83,273
5
$89,444
APPLICATIONS APPROVED, NOT ACCEPTED
1
$52,420
8
$99,426
14
$112,336
1
$11,650
0
$0
4
$74,428
APPLICATIONS DENIED
0
$0
9
$93,557
51
$125,087
8
$40,126
1
$80,250
9
$85,718
APPLICATIONS WITHDRAWN
0
$0
4
$53,395
33
$123,223
2
$66,660
1
$20,710
3
$101,180
FILES CLOSED FOR INCOMPLETENESS
0
$0
1
$82,190
11
$119,320
1
$50,480
0
$0
1
$62,130
Aggregated Statistics For Year 2004 (Based on 2 partial tracts)
A) FHA, FSA/RHS & VA Home Purchase Loans
B) Conventional Home Purchase Loans
C) Refinancings
D) Home Improvement Loans
F) Non-occupant Loans on < 5 Family Dwellings (A B C & D)
G) Loans On Manufactured Home Dwelling (A B C & D)
Number
Average Value
Number
Average Value
Number
Average Value
Number
Average Value
Number
Average Value
Number
Average Value
LOANS ORIGINATED
2
$100,315
33
$115,849
83
$103,069
9
$42,571
3
$83,273
5
$87,242
APPLICATIONS APPROVED, NOT ACCEPTED
0
$0
9
$94,922
10
$102,516
4
$35,272
1
$40,770
1
$66,660
APPLICATIONS DENIED
3
$91,903
14
$81,316
46
$106,732
5
$38,444
4
$71,515
7
$80,160
APPLICATIONS WITHDRAWN
0
$0
2
$105,495
36
$105,296
1
$87,370
2
$89,635
3
$99,237
FILES CLOSED FOR INCOMPLETENESS
1
$81,550
1
$119,730
8
$96,514
0
$0
0
$0
0
$0
Aggregated Statistics For Year 2003 (Based on 2 partial tracts)
A) FHA, FSA/RHS & VA Home Purchase Loans
B) Conventional Home Purchase Loans
C) Refinancings
D) Home Improvement Loans
F) Non-occupant Loans on < 5 Family Dwellings (A B C & D)
Number
Average Value
Number
Average Value
Number
Average Value
Number
Average Value
Number
Average Value
LOANS ORIGINATED
6
$95,785
20
$119,926
159
$107,431
8
$43,524
3
$218,323
APPLICATIONS APPROVED, NOT ACCEPTED
0
$0
5
$99,540
22
$108,082
1
$29,120
0
$0
APPLICATIONS DENIED
1
$99,670
10
$95,462
71
$101,064
4
$21,035
1
$69,900
APPLICATIONS WITHDRAWN
1
$40,130
3
$82,410
32
$110,348
0
$0
1
$109,380
FILES CLOSED FOR INCOMPLETENESS
0
$0
0
$0
8
$88,748
0
$0
0
$0
Aggregated Statistics For Year 2002 (Based on 2 partial tracts)
A) FHA, FSA/RHS & VA Home Purchase Loans
B) Conventional Home Purchase Loans
C) Refinancings
D) Home Improvement Loans
F) Non-occupant Loans on < 5 Family Dwellings (A B C & D)
Number
Average Value
Number
Average Value
Number
Average Value
Number
Average Value
Number
Average Value
LOANS ORIGINATED
4
$121,350
23
$104,903
96
$98,132
6
$15,210
3
$76,800
APPLICATIONS APPROVED, NOT ACCEPTED
0
$0
3
$82,410
16
$91,943
3
$15,963
0
$0
APPLICATIONS DENIED
0
$0
2
$148,210
37
$1,779,975
2
$36,890
0
$0
APPLICATIONS WITHDRAWN
1
$54,360
2
$159,210
19
$99,737
0
$0
0
$0
FILES CLOSED FOR INCOMPLETENESS
0
$0
1
$5,820
8
$105,979
0
$0
1
$84,140
Aggregated Statistics For Year 2001 (Based on 2 partial tracts)
A) FHA, FSA/RHS & VA Home Purchase Loans
B) Conventional Home Purchase Loans
C) Refinancings
D) Home Improvement Loans
F) Non-occupant Loans on < 5 Family Dwellings (A B C & D)
Number
Average Value
Number
Average Value
Number
Average Value
Number
Average Value
Number
Average Value
LOANS ORIGINATED
5
$110,800
27
$92,166
82
$96,496
12
$21,358
1
$83,490
APPLICATIONS APPROVED, NOT ACCEPTED
1
$116,500
2
$118,760
13
$100,565
3
$48,110
1
$48,540
APPLICATIONS DENIED
0
$0
5
$93,586
36
$76,100
10
$22,846
1
$60,190
APPLICATIONS WITHDRAWN
0
$0
3
$106,573
21
$103,398
2
$21,360
1
$12,940
FILES CLOSED FOR INCOMPLETENESS
0
$0
1
$20,710
4
$93,520
0
$0
0
$0
Aggregated Statistics For Year 2000 (Based on 2 partial tracts)
A) FHA, FSA/RHS & VA Home Purchase Loans
B) Conventional Home Purchase Loans
C) Refinancings
D) Home Improvement Loans
F) Non-occupant Loans on < 5 Family Dwellings (A B C & D)
Number
Average Value
Number
Average Value
Number
Average Value
Number
Average Value
Number
Average Value
LOANS ORIGINATED
3
$90,393
19
$102,768
45
$77,535
15
$26,881
3
$112,613
APPLICATIONS APPROVED, NOT ACCEPTED
0
$0
2
$65,365
12
$74,104
2
$19,090
0
$0
APPLICATIONS DENIED
0
$0
7
$78,311
27
$56,666
6
$9,168
0
$0
APPLICATIONS WITHDRAWN
1
$73,780
1
$44,660
18
$52,387
1
$33,010
1
$22,650
FILES CLOSED FOR INCOMPLETENESS
1
$73,780
0
$0
2
$48,540
0
$0
0
$0
Aggregated Statistics For Year 1999 (Based on 1 partial tract)
A) FHA, FSA/RHS & VA Home Purchase Loans
B) Conventional Home Purchase Loans
C) Refinancings
D) Home Improvement Loans
F) Non-occupant Loans on < 5 Family Dwellings (A B C & D)
Detailed PMIC statistics for the following Tracts:0034.00
2002 - 2018 National Fire Incident Reporting System (NFIRS) incidents
According to the data from the years 2002 - 2018 the average number of fire incidents per year is 13. The highest number of fire incidents - 43 took place in 2003, and the least - 5 in 2002. The data has an increasing trend.
When looking into fire subcategories, the most incidents belonged to: Structure Fires (56.6%), and Outside Fires (28.8%).
Fire incident types reported to NFIRS in Zip Code 49052


 Nearest zip codes: 49066, 49011, 49051, 49088, 49034, 49089.


 According to the data from the years 2002 - 2018 the average number of fire incidents per year is 13. The highest number of fire incidents - 43 took place in 2003, and the least - 5 in 2002. The data has an increasing trend.
 When looking into fire subcategories, the most incidents belonged to: Structure Fires (56.6%), and Outside Fires (28.8%).