Estimated zip code population in 2022: 2,962 Zip code population in 2010: 2,436 Zip code population in 2000: 2,296
Houses and condos: 1,065 Renter-occupied apartments: 90
% of renters here:
8%
State:
27%
March 2022 cost of living index in zip code 49051: 82.4 (low, U.S. average is 100)
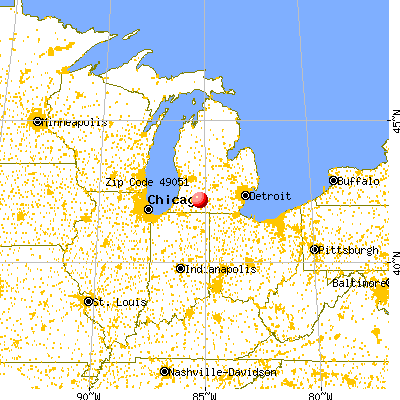
Land area: 29.4 sq. mi. Water area: 0.2 sq. mi.
Population density: 101 people per square mile
(very low).
OSM Map
General Map
Google Map
MSN Map
OSM Map
General Map
Google Map
MSN Map
OSM Map
General Map
Google Map
MSN Map
OSM Map
General Map
Google Map
MSN Map
Please wait while loading the map...
Real estate property taxes paid for housing units in 2022:
This zip code:
1.0% ($2,555)
Michigan:
1.2% ($2,746)
Median real estate property taxes paid for housing units with mortgages in 2022: $2,716 (0.9%) Median real estate property taxes paid for housing units with no mortgage in 2022: $2,152 (1.0%)
Business Search- 14 Million verified businesses
Males: 1,600
(54.0%)
Females: 1,362
(46.0%)
For population 25 years and over in 49051:
High school or higher: 95.9%
Bachelor's degree or higher: 22.4%
Graduate or professional degree: 1.2%
Unemployed: 7.0%
Mean travel time to work (commute): 24.6 minutes
For population 15 years and over in 49051:
Never married: 22.6%
Now married: 58.2%
Separated: 0.0%
Widowed: 8.0%
Divorced: 11.2%
Zip code 49051 compared to state average:
Black race population percentage significantly below state average.
Hispanic race population percentage significantly below state average.
Foreign-born population percentage significantly below state average.
Renting percentage significantly below state average.
Length of stay since moving in significantly above state average.
Estimated median house/condo value in 2022: $264,459
49051:
$264,459
Michigan:
$224,400
According to our research of Michigan and other state lists, there were 10 registered sex offenders living in 49051 zip code as of May 28, 2024. The ratio of all residents to sex offenders in zip code 49051 is 279 to 1. The ratio of registered sex offenders to all residents in this zip code is near the state average.
Median resident age:
This zip code:
39.1 years
Michigan median age:
40.3 years
Average household size:
This zip code:
2.8 people
Michigan:
2.4 people
Averages for the 2020 tax year for zip code 49051, filed in 2021:
Average Adjusted Gross Income (AGI) in 2020: $72,189 (Individual Income Tax Returns)
Here:
$72,189
State:
$68,945
Salary/wage: $63,306 (reported on 74.2% of returns)
Here:
$63,306
State:
$57,142
(% of AGI for various income ranges: 961.8% for AGIs below $25k, 2824.5% for AGIs $25k-50k, 5462.1% for AGIs $50k-75k, 7470.0% for AGIs $75k-100k, 15130.6% for AGIs $100k-200k)
Taxable interest for individuals: $871 (reported on 43.3% of returns)
This zip code:
$871
Michigan:
$1,630
(% of AGI for various income ranges: 24.5% for AGIs below $25k, 39.0% for AGIs $25k-50k, 26.4% for AGIs $50k-75k, 19.1% for AGIs $75k-100k, 73.1% for AGIs $100k-200k)
Ordinary dividends: $4,066 (reported on 24.2% of returns)
Here:
$4,066
State:
$6,972
(% of AGI for various income ranges: 29.1% for AGIs below $25k, 71.5% for AGIs $25k-50k, 113.6% for AGIs $50k-75k, 140.9% for AGIs $75k-100k, 270.0% for AGIs $100k-200k)
Net capital gain/loss in AGI: +$4,514 (reported on 18.3% of returns)
Here:
+$4,514
State:
+$20,064
(% of AGI for various income ranges: 6.8% for AGIs below $25k, 30.5% for AGIs $25k-50k, 22.1% for AGIs $50k-75k, 189.1% for AGIs $75k-100k, 241.9% for AGIs $100k-200k)
Profit/loss from business: +$13,253 (reported on 12.5% of returns)
Here:
+$13,253
State:
+$11,172
(% of AGI for various income ranges: 48.6% for AGIs below $25k, 154.0% for AGIs $25k-50k, 29.3% for AGIs $50k-75k, 388.2% for AGIs $75k-100k, 690.6% for AGIs $100k-200k)
Taxable individual retirement arrangement distribution: $21,400 (reported on 18.3% of returns)
49051:
$21,400
Michigan:
$19,803
(% of AGI for various income ranges: 75.0% for AGIs below $25k, 268.0% for AGIs $25k-50k, 415.7% for AGIs $50k-75k, 672.7% for AGIs $75k-100k, 1678.1% for AGIs $100k-200k)
Total itemized deductions: $26,217 (reported on 5.0% of returns)
Here:
$26,217
State:
$34,117
(% of AGI for various income ranges: 256.0% for AGIs $25k-50k, 663.1% for AGIs $100k-200k)
Charity contributions: $9,350 (reported on 3.3% of returns)
Here:
$9,350
State:
$13,548
(% of AGI for various income ranges: 233.8% for AGIs $100k-200k)
Taxes paid: $7,117 (reported on 5.0% of returns)
49051:
$7,117
State:
$7,972
(% of AGI for various income ranges: 74.5% for AGIs $25k-50k, 173.8% for AGIs $100k-200k)
Earned income credit: $2,025 (reported on 10.0% of returns)
Here:
$2,025
State:
$2,251
(% of AGI for various income ranges: 60.9% for AGIs below $25k, 54.5% for AGIs $25k-50k)
Percentage of individuals using paid preparers for their 2020 taxes: 95.8%
Here:
96%
State:
93%
(% for various income ranges: 93.9% for AGIs below $25k, 96.2% for AGIs $25k-50k, 94.7% for AGIs $50k-75k, 100.0% for AGIs $75k-100k, 95.7% for AGIs $100k-200k, 100.0% for AGIs over 200k)
Averages for the 2012 tax year for zip code 49051, filed in 2013:
Average Adjusted Gross Income (AGI) in 2012: $62,618 (Individual Income Tax Returns)
Here:
$62,618
State:
$55,609
Salary/wage: $50,798 (reported on 77.8% of returns)
Here:
$50,798
State:
$46,782
(% of AGI for various income ranges: 54.9% for AGIs below $25k, 63.3% for AGIs $25k-50k, 66.2% for AGIs $50k-75k, 76.2% for AGIs $75k-100k, 75.6% for AGIs $100k-200k, 32.7% for AGIs over 200k)
Taxable interest for individuals: $739 (reported on 46.2% of returns)
This zip code:
$739
Michigan:
$1,491
(% of AGI for various income ranges: 1.0% for AGIs below $25k, 1.0% for AGIs $25k-50k, 0.7% for AGIs $50k-75k, 0.3% for AGIs $75k-100k, 0.3% for AGIs $100k-200k, 0.6% for AGIs over 200k)
Ordinary dividends: $4,506 (reported on 26.5% of returns)
Here:
$4,506
State:
$6,225
(% of AGI for various income ranges: 2.1% for AGIs below $25k, 2.0% for AGIs $25k-50k, 1.2% for AGIs $50k-75k, 0.4% for AGIs $75k-100k, 1.1% for AGIs $100k-200k, 4.9% for AGIs over 200k)
Net capital gain/loss in AGI: +$9,186 (reported on 18.8% of returns)
Here:
+$9,186
State:
+$9,326
(% of AGI for various income ranges: 0.2% for AGIs $25k-50k, 1.6% for AGIs $50k-75k, 0.4% for AGIs $75k-100k, 1.4% for AGIs $100k-200k, 10.5% for AGIs over 200k)
Profit/loss from business: +$9,228 (reported on 15.4% of returns)
Here:
+$9,228
State:
+$11,523
(% of AGI for various income ranges: 3.1% for AGIs below $25k, 3.6% for AGIs $25k-50k, 2.5% for AGIs $50k-75k, 0.4% for AGIs $75k-100k, 3.9% for AGIs $100k-200k)
Taxable individual retirement arrangement distribution: $16,757 (reported on 17.9% of returns)
49051:
$16,757
Michigan:
$15,298
(% of AGI for various income ranges: 6.9% for AGIs below $25k, 5.6% for AGIs $25k-50k, 5.5% for AGIs $50k-75k, 3.0% for AGIs $75k-100k, 7.8% for AGIs $100k-200k)
Total itemized deductions: $20,209 (19% of AGI, reported on 36.8% of returns)
Here:
$20,209
State:
$21,628
Here:
19.2% of AGI
State:
18.4% of AGI
(% of AGI for various income ranges: 13.0% for AGIs below $25k, 10.6% for AGIs $25k-50k, 12.1% for AGIs $50k-75k, 10.2% for AGIs $75k-100k, 13.5% for AGIs $100k-200k, 10.9% for AGIs over 200k)
Charity contributions: $3,244 (reported on 29.1% of returns)
Here:
$3,244
State:
$4,225
(% of AGI for various income ranges: 1.3% for AGIs below $25k, 0.9% for AGIs $25k-50k, 1.6% for AGIs $50k-75k, 1.5% for AGIs $75k-100k, 2.2% for AGIs $100k-200k, 0.9% for AGIs over 200k)
Taxes paid: $7,565 (reported on 36.8% of returns)
49051:
$7,565
State:
$8,327
(% of AGI for various income ranges: 2.7% for AGIs below $25k, 2.2% for AGIs $25k-50k, 3.7% for AGIs $50k-75k, 3.9% for AGIs $75k-100k, 5.8% for AGIs $100k-200k, 5.7% for AGIs over 200k)
Earned income credit: $2,100 (reported on 10.3% of returns)
Here:
$2,100
State:
$2,306
(% of AGI for various income ranges: 3.7% for AGIs below $25k, 1.0% for AGIs $25k-50k)
Percentage of individuals using paid preparers for their 2012 taxes: 63.2%
Here:
63%
State:
57%
(% for various income ranges: 55.3% for AGIs below $25k, 66.7% for AGIs $25k-50k, 65.2% for AGIs $50k-75k, 69.2% for AGIs $75k-100k, 62.5% for AGIs $100k-200k, 100.0% for AGIs over 200k)
Averages for the 2004 tax year for zip code 49051, filed in 2005:
Average Adjusted Gross Income (AGI) in 2004: $48,459 (Individual Income Tax Returns)
Here:
$48,459
State:
$48,204
Salary/wage: $44,900 (reported on 81.6% of returns)
Here:
$44,900
State:
$42,791
(% of AGI for various income ranges: 102.6% for AGIs below $10k, 69.4% for AGIs $10k-25k, 67.6% for AGIs $25k-50k, 80.3% for AGIs $50k-75k, 85.7% for AGIs $75k-100k, 70.1% for AGIs over 100k)
Taxable interest for individuals: $1,071 (reported on 55.1% of returns)
This zip code:
$1,071
Michigan:
$1,725
(% of AGI for various income ranges: 6.7% for AGIs below $10k, 2.5% for AGIs $10k-25k, 2.2% for AGIs $25k-50k, 0.9% for AGIs $50k-75k, 0.4% for AGIs $75k-100k, 0.9% for AGIs over 100k)
Taxable dividends: $2,618 (reported on 30.8% of returns)
Here:
$2,618
State:
$3,420
(% of AGI for various income ranges: 5.7% for AGIs below $10k, 1.6% for AGIs $10k-25k, 1.7% for AGIs $25k-50k, 1.0% for AGIs $50k-75k, 1.0% for AGIs $75k-100k, 2.5% for AGIs over 100k)
Net capital gain/loss: +$2,245 (reported on 21.7% of returns)
Here:
+$2,245
State:
+$8,532
(% of AGI for various income ranges: 1.4% for AGIs below $10k, 0.5% for AGIs $10k-25k, 1.1% for AGIs $25k-50k, 0.6% for AGIs $50k-75k, 0.2% for AGIs $75k-100k, 2.0% for AGIs over 100k)
Profit/loss from business: +$3,204 (reported on 13.3% of returns)
Here:
+$3,204
State:
+$9,547
(% of AGI for various income ranges: 8.1% for AGIs below $10k, 4.2% for AGIs $10k-25k, 1.6% for AGIs $25k-50k, 0.8% for AGIs $50k-75k, 0.2% for AGIs $75k-100k, -0.1% for AGIs over 100k)
IRA payment deduction: $3,000 (reported on 1.9% of returns)
49051:
$3,000
Michigan:
$2,875
Total itemized deductions: $15,930 (20% of AGI, reported on 38.9% of returns)
Here:
$15,930
State:
$18,509
Here:
20.0% of AGI
State:
20.7% of AGI
(% of AGI for various income ranges: 13.0% for AGIs $10k-25k, 11.9% for AGIs $25k-50k, 13.6% for AGIs $50k-75k, 14.7% for AGIs $75k-100k, 11.9% for AGIs over 100k)
Charity contributions deductions: $2,793 (3% of AGI, reported on 32.7% of returns)
Here:
$2,793
State:
$3,365
Here:
3.3% of AGI
State:
3.6% of AGI
(% of AGI for various income ranges: 1.2% for AGIs $10k-25k, 1.8% for AGIs $25k-50k, 1.9% for AGIs $50k-75k, 1.7% for AGIs $75k-100k, 2.2% for AGIs over 100k)
Total tax: $6,586 (reported on 80.0% of returns)
49051:
$6,586
State:
$7,691
(% of AGI for various income ranges: 4.0% for AGIs below $10k, 4.0% for AGIs $10k-25k, 6.8% for AGIs $25k-50k, 8.5% for AGIs $50k-75k, 9.9% for AGIs $75k-100k, 17.7% for AGIs over 100k)
Earned income credit: $1,718 (reported on 9.3% of returns)
Here:
$1,718
State:
$1,737
Percentage of individuals using paid preparers for their 2004 taxes: 63.3%
Here:
63%
State:
60%
(% for various income ranges: 56.2% for AGIs below $10k, 60.1% for AGIs $10k-25k, 68.0% for AGIs $25k-50k, 65.7% for AGIs $50k-75k, 65.2% for AGIs $75k-100k, 65.1% for AGIs over 100k)
In group quarters: 1 (-1 institutionalized population)
Size of family households: 362 2-persons, 124 3-persons, 162 4-persons, 120 5-persons, 28 6-persons
Size of nonfamily households: 191 1-person, 71 2-persons
519 married couples with children.
196 single-parent households (81 men, 115 women).
97.0% of residents of 49051 zip code speak English at home.
3.0% of residents speak Spanish at home (100% very well).
0.1% of residents speak other Indo-European language at home (100% very well).
Foreign born population: 40 (1.4%) (17.8% of them are naturalized citizens)
This zip code:
1.4%
Whole state:
6.9%
46%Costa Rica
24%American
19%Irish
18%English
12%German
6%Finnish
6%Italian
5%Dutch
Year of entry for the foreign-born population
192010 or later
132000 to 2009
01990 to 1999
45Before 1990
Facilities with environmental interests located in this zip code:
EAST LEROY ELEMENTARY SCHOOL (4320 K DRIVE SOUTH in EAST LEROY, MI)
(National Center for Education Statistics) - STATE ID-01027 Organizations: ATHENS AREA SCHOOLS (SCHOOL DISTRICT)
Housing units lacking complete kitchen facilities: 1.1%
48.7%Utility gas
26.4%Bottled, tank, or LP gas
10.2%Wood
8.5%Other fuel
3.6%Electricity
2.9%Fuel oil, kerosene, etc.
Population in 1990: 1,915. Population change in the 1990s: +381 (+19.9%).
Place of birth for U.S.-born residents:
This state: 2,485
Northeast: 9
Midwest: 142
South: 99
West: 148
74% of the 49051 zip code residents lived in the same house 5 years ago. Out of people who lived in different houses, 70% lived in this county. Out of people who lived in different counties, 50% lived in Michigan.
90% of the 49051 zip code residents lived in the same house 1 year ago. Out of people who lived in different houses, 30% moved from this county. Out of people who lived in different houses, 58% moved from different county within same state. Out of people who lived in different houses, 11% moved from abroad.
Private vs. public school enrollment:
Students in private schools in grades 1 to 8 (elementary and middle school): 12
Here:
3.2%
Michigan:
12.4%
Students in private schools in grades 9 to 12 (high school):
Here:
0.0%
Michigan:
9.8%
Students in private undergraduate colleges: 70
Here:
37.1%
Michigan:
14.9%
Occupation by median earnings in the past 12 months ($)
109,349Architecture and engineering occupations
102,474Installation, maintenance, and repair occupations
85,640Business and financial operations occupations
68,453Management occupations
57,558Construction and extraction occupations
46,772Education, training, and library occupations
Top industries in this zip code by the number of employees in 2005:
Construction: Plumbing, Heating, and Air-Conditioning Contractors (20-49 employees: 1 establishment)
Construction: New Housing Operative Builders (10-19: 1)
Construction: New Single-Family Housing Construction (except Operative Builders) (5-9: 1, 1-4: 1)
Administrative and Support and Waste Management and Remediation Services: Remediation Services (5-9: 1)
Wholesale Trade: Grain and Field Bean Merchant Wholesalers (5-9: 1)
Construction: Poured Concrete Foundation and Structure Contractors (1-4: 2)
Construction: Site Preparation Contractors (1-4: 2)
Other Services (except Public Administration): Religious Organizations (1-4: 1)
People in group quarters in 2010:
3 people in group homes intended for adults
People in group quarters in 2000:
6 people in homes or halfway houses for drug/alcohol abuse
5 people in other group homes
Home Mortgage Disclosure Act Aggregated Statistics For Year 2009 (Based on 4 partial tracts)
A) FHA, FSA/RHS & VA Home Purchase Loans
B) Conventional Home Purchase Loans
C) Refinancings
D) Home Improvement Loans
F) Non-occupant Loans on < 5 Family Dwellings (A B C & D)
G) Loans On Manufactured Home Dwelling (A B C & D)
Number
Average Value
Number
Average Value
Number
Average Value
Number
Average Value
Number
Average Value
Number
Average Value
LOANS ORIGINATED
27
$111,006
26
$128,166
169
$137,917
15
$71,085
5
$89,998
5
$55,852
APPLICATIONS APPROVED, NOT ACCEPTED
1
$140,360
1
$42,040
16
$95,944
0
$0
0
$0
1
$78,120
APPLICATIONS DENIED
6
$137,188
2
$95,785
48
$151,801
3
$22,010
0
$0
2
$59,015
APPLICATIONS WITHDRAWN
4
$95,985
5
$87,740
33
$165,393
0
$0
2
$46,365
0
$0
FILES CLOSED FOR INCOMPLETENESS
0
$0
1
$42,640
4
$191,925
0
$0
0
$0
0
$0
Aggregated Statistics For Year 2008 (Based on 4 partial tracts)
A) FHA, FSA/RHS & VA Home Purchase Loans
B) Conventional Home Purchase Loans
C) Refinancings
D) Home Improvement Loans
F) Non-occupant Loans on < 5 Family Dwellings (A B C & D)
G) Loans On Manufactured Home Dwelling (A B C & D)
Number
Average Value
Number
Average Value
Number
Average Value
Number
Average Value
Number
Average Value
Number
Average Value
LOANS ORIGINATED
12
$157,196
42
$142,688
72
$144,683
22
$63,214
8
$131,372
4
$74,092
APPLICATIONS APPROVED, NOT ACCEPTED
2
$65,100
4
$85,638
12
$130,922
1
$2,280
1
$65,530
0
$0
APPLICATIONS DENIED
2
$114,540
3
$153,013
47
$123,483
6
$42,643
2
$106,595
2
$108,850
APPLICATIONS WITHDRAWN
1
$68,070
3
$104,543
24
$154,112
2
$47,265
1
$67,700
2
$81,570
FILES CLOSED FOR INCOMPLETENESS
0
$0
0
$0
5
$171,028
1
$110,350
0
$0
0
$0
Aggregated Statistics For Year 2007 (Based on 4 partial tracts)
A) FHA, FSA/RHS & VA Home Purchase Loans
B) Conventional Home Purchase Loans
C) Refinancings
D) Home Improvement Loans
F) Non-occupant Loans on < 5 Family Dwellings (A B C & D)
G) Loans On Manufactured Home Dwelling (A B C & D)
Number
Average Value
Number
Average Value
Number
Average Value
Number
Average Value
Number
Average Value
Number
Average Value
LOANS ORIGINATED
2
$130,785
74
$136,194
103
$116,803
32
$35,743
7
$107,380
7
$44,331
APPLICATIONS APPROVED, NOT ACCEPTED
0
$0
7
$112,429
17
$133,905
3
$19,723
0
$0
1
$78,210
APPLICATIONS DENIED
2
$104,310
13
$124,398
76
$120,100
12
$74,587
7
$106,867
7
$54,119
APPLICATIONS WITHDRAWN
3
$120,247
7
$158,987
25
$135,489
3
$78,170
1
$118,020
0
$0
FILES CLOSED FOR INCOMPLETENESS
0
$0
2
$91,370
9
$145,779
1
$59,880
4
$137,375
0
$0
Aggregated Statistics For Year 2006 (Based on 4 partial tracts)
A) FHA, FSA/RHS & VA Home Purchase Loans
B) Conventional Home Purchase Loans
C) Refinancings
D) Home Improvement Loans
E) Loans on Dwellings For 5+ Families
F) Non-occupant Loans on < 5 Family Dwellings (A B C & D)
G) Loans On Manufactured Home Dwelling (A B C & D)
Number
Average Value
Number
Average Value
Number
Average Value
Number
Average Value
Number
Average Value
Number
Average Value
Number
Average Value
LOANS ORIGINATED
6
$102,747
83
$125,394
146
$112,994
30
$57,668
1
$152,280
9
$114,702
7
$79,099
APPLICATIONS APPROVED, NOT ACCEPTED
1
$12,580
9
$124,344
24
$98,185
5
$52,154
0
$0
1
$91,370
0
$0
APPLICATIONS DENIED
0
$0
14
$150,551
108
$122,904
30
$102,721
0
$0
6
$83,672
6
$68,105
APPLICATIONS WITHDRAWN
0
$0
11
$133,823
58
$126,037
8
$112,434
0
$0
2
$124,410
1
$68,850
FILES CLOSED FOR INCOMPLETENESS
0
$0
0
$0
23
$158,930
2
$78,045
0
$0
0
$0
0
$0
Aggregated Statistics For Year 2005 (Based on 4 partial tracts)
A) FHA, FSA/RHS & VA Home Purchase Loans
B) Conventional Home Purchase Loans
C) Refinancings
D) Home Improvement Loans
F) Non-occupant Loans on < 5 Family Dwellings (A B C & D)
G) Loans On Manufactured Home Dwelling (A B C & D)
Number
Average Value
Number
Average Value
Number
Average Value
Number
Average Value
Number
Average Value
Number
Average Value
LOANS ORIGINATED
9
$118,214
86
$124,901
155
$123,466
34
$46,866
7
$118,003
14
$65,861
APPLICATIONS APPROVED, NOT ACCEPTED
0
$0
9
$123,703
31
$133,815
4
$29,072
0
$0
0
$0
APPLICATIONS DENIED
2
$130,730
24
$86,326
117
$128,538
21
$43,484
4
$114,115
14
$74,246
APPLICATIONS WITHDRAWN
0
$0
18
$108,273
56
$119,077
4
$170,920
3
$122,560
4
$76,680
FILES CLOSED FOR INCOMPLETENESS
0
$0
7
$101,553
26
$145,281
0
$0
1
$54,820
0
$0
Aggregated Statistics For Year 2004 (Based on 4 partial tracts)
A) FHA, FSA/RHS & VA Home Purchase Loans
B) Conventional Home Purchase Loans
C) Refinancings
D) Home Improvement Loans
F) Non-occupant Loans on < 5 Family Dwellings (A B C & D)
G) Loans On Manufactured Home Dwelling (A B C & D)
Number
Average Value
Number
Average Value
Number
Average Value
Number
Average Value
Number
Average Value
Number
Average Value
LOANS ORIGINATED
8
$118,564
83
$130,037
186
$118,775
26
$42,244
10
$85,192
12
$75,427
APPLICATIONS APPROVED, NOT ACCEPTED
0
$0
10
$132,825
39
$113,446
2
$24,710
1
$67,680
4
$71,365
APPLICATIONS DENIED
0
$0
23
$86,252
99
$107,762
18
$55,076
6
$76,407
11
$53,452
APPLICATIONS WITHDRAWN
1
$89,850
13
$87,119
49
$122,336
5
$61,178
3
$58,800
0
$0
FILES CLOSED FOR INCOMPLETENESS
0
$0
0
$0
22
$125,806
2
$17,130
0
$0
0
$0
Aggregated Statistics For Year 2003 (Based on 4 partial tracts)
A) FHA, FSA/RHS & VA Home Purchase Loans
B) Conventional Home Purchase Loans
C) Refinancings
D) Home Improvement Loans
F) Non-occupant Loans on < 5 Family Dwellings (A B C & D)
Number
Average Value
Number
Average Value
Number
Average Value
Number
Average Value
Number
Average Value
LOANS ORIGINATED
8
$106,160
91
$124,796
411
$118,361
19
$35,837
11
$86,666
APPLICATIONS APPROVED, NOT ACCEPTED
0
$0
8
$99,479
38
$121,191
1
$19,750
1
$85,510
APPLICATIONS DENIED
1
$117,720
20
$69,742
100
$110,122
13
$38,183
3
$73,250
APPLICATIONS WITHDRAWN
0
$0
5
$155,502
61
$118,137
2
$59,010
1
$60,620
FILES CLOSED FOR INCOMPLETENESS
0
$0
2
$105,675
12
$97,851
1
$114,210
0
$0
Aggregated Statistics For Year 2002 (Based on 4 partial tracts)
A) FHA, FSA/RHS & VA Home Purchase Loans
B) Conventional Home Purchase Loans
C) Refinancings
D) Home Improvement Loans
F) Non-occupant Loans on < 5 Family Dwellings (A B C & D)
Number
Average Value
Number
Average Value
Number
Average Value
Number
Average Value
Number
Average Value
LOANS ORIGINATED
12
$105,047
70
$134,190
263
$114,963
26
$13,192
9
$84,231
APPLICATIONS APPROVED, NOT ACCEPTED
1
$92,890
14
$97,459
40
$100,356
4
$18,432
1
$6,850
APPLICATIONS DENIED
2
$89,925
11
$71,862
72
$99,447
6
$38,683
3
$66,640
APPLICATIONS WITHDRAWN
2
$81,025
4
$103,948
35
$98,919
1
$138,510
0
$0
FILES CLOSED FOR INCOMPLETENESS
0
$0
1
$46,530
19
$98,750
0
$0
0
$0
Aggregated Statistics For Year 2001 (Based on 4 partial tracts)
A) FHA, FSA/RHS & VA Home Purchase Loans
B) Conventional Home Purchase Loans
C) Refinancings
D) Home Improvement Loans
F) Non-occupant Loans on < 5 Family Dwellings (A B C & D)
Number
Average Value
Number
Average Value
Number
Average Value
Number
Average Value
Number
Average Value
LOANS ORIGINATED
5
$75,376
58
$114,506
191
$111,414
26
$27,715
8
$65,984
APPLICATIONS APPROVED, NOT ACCEPTED
1
$122,460
7
$67,807
23
$82,617
9
$29,131
0
$0
APPLICATIONS DENIED
0
$0
31
$42,918
64
$85,803
14
$12,233
3
$82,473
APPLICATIONS WITHDRAWN
1
$82,230
6
$55,530
35
$98,627
0
$0
0
$0
FILES CLOSED FOR INCOMPLETENESS
0
$0
0
$0
20
$121,236
2
$19,620
0
$0
Aggregated Statistics For Year 2000 (Based on 4 partial tracts)
A) FHA, FSA/RHS & VA Home Purchase Loans
B) Conventional Home Purchase Loans
C) Refinancings
D) Home Improvement Loans
F) Non-occupant Loans on < 5 Family Dwellings (A B C & D)
Number
Average Value
Number
Average Value
Number
Average Value
Number
Average Value
Number
Average Value
LOANS ORIGINATED
8
$117,301
67
$107,907
81
$85,515
30
$23,293
5
$78,038
APPLICATIONS APPROVED, NOT ACCEPTED
0
$0
4
$73,360
16
$89,203
6
$46,080
0
$0
APPLICATIONS DENIED
2
$83,330
26
$60,446
36
$64,476
17
$15,550
0
$0
APPLICATIONS WITHDRAWN
1
$74,230
3
$96,650
23
$67,056
3
$24,110
1
$20,560
FILES CLOSED FOR INCOMPLETENESS
0
$0
1
$29,470
5
$50,334
0
$0
0
$0
Aggregated Statistics For Year 1999 (Based on 2 partial tracts)
A) FHA, FSA/RHS & VA Home Purchase Loans
B) Conventional Home Purchase Loans
C) Refinancings
D) Home Improvement Loans
F) Non-occupant Loans on < 5 Family Dwellings (A B C & D)
Detailed PMIC statistics for the following Tracts:0027.00
, 0028.00
2002 - 2018 National Fire Incident Reporting System (NFIRS) incidents
According to the data from the years 2002 - 2018 the average number of fire incidents per year is 8. The highest number of fire incidents - 26 took place in 2014, and the least - 1 in 2007. The data has a decreasing trend.
When looking into fire subcategories, the most incidents belonged to: Structure Fires (69.8%), and Outside Fires (24.8%).
Fire incident types reported to NFIRS in Zip Code 49051


 Nearest zip codes: 49011, 49015, 49034, 49052, 49037, 49029.


 According to the data from the years 2002 - 2018 the average number of fire incidents per year is 8. The highest number of fire incidents - 26 took place in 2014, and the least - 1 in 2007. The data has a decreasing trend.
 When looking into fire subcategories, the most incidents belonged to: Structure Fires (69.8%), and Outside Fires (24.8%).