Estimated zip code population in 2022: 510 Zip code population in 2010: 433 Zip code population in 2000: 539
Houses and condos: 199 Renter-occupied apartments: 15
% of renters here:
8%
State:
28%
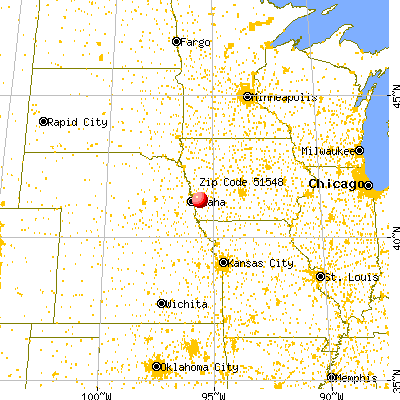
March 2022 cost of living index in zip code 51548: 80.3 (low, U.S. average is 100)
Land area: 24.9 sq. mi. Water area: 0.0 sq. mi.
Population density: 21 people per square mile
(very low).
OSM Map
General Map
Google Map
MSN Map
OSM Map
General Map
Google Map
MSN Map
OSM Map
General Map
Google Map
MSN Map
OSM Map
General Map
Google Map
MSN Map
Please wait while loading the map...
Real estate property taxes paid for housing units in 2022:
This zip code:
1.7% ($4,031)
Iowa:
1.4% ($2,724)
Median real estate property taxes paid for housing units with mortgages in 2022: $4,094 (1.8%) Median real estate property taxes paid for housing units with no mortgage in 2022: $3,982 (1.6%)
Business Search- 14 Million verified businesses
Males: 222
(43.5%)
Females: 288
(56.5%)
For population 25 years and over in 51548:
High school or higher: 96.8%
Bachelor's degree or higher: 29.8%
Graduate or professional degree: 4.9%
Unemployed: 1.2%
Mean travel time to work (commute): 21.6 minutes
For population 15 years and over in 51548:
Never married: 19.1%
Now married: 72.3%
Separated: 0.0%
Widowed: 5.6%
Divorced: 3.0%
Zip code 51548 compared to state average:
Unemployed percentage below state average.
Black race population percentage significantly below state average.
Hispanic race population percentage significantly below state average.
Foreign-born population percentage significantly below state average.
Renting percentage significantly below state average.
Length of stay since moving in significantly above state average.
Estimated median house/condo value in 2022: $235,106
51548:
$235,106
Iowa:
$194,600
Median resident age:
This zip code:
41.3 years
Iowa median age:
38.9 years
Average household size:
This zip code:
2.7 people
Iowa:
2.3 people
Averages for the 2020 tax year for zip code 51548, filed in 2021:
Average Adjusted Gross Income (AGI) in 2020: $85,641 (Individual Income Tax Returns)
Here:
$85,641
State:
$71,087
Salary/wage: $63,400 (reported on 90.9% of returns)
Here:
$63,400
State:
$57,361
(% of AGI for various income ranges: 767.5% for AGIs below $25k, 3816.7% for AGIs $25k-50k, 6206.7% for AGIs $50k-75k, 8925.0% for AGIs $75k-100k, 25270.0% for AGIs $100k-200k)
Taxable interest for individuals: $433 (reported on 40.9% of returns)
This zip code:
$433
Iowa:
$1,633
(% of AGI for various income ranges: 10.0% for AGIs below $25k, 46.7% for AGIs $50k-75k, 70.0% for AGIs $100k-200k)
Ordinary dividends: $1,560 (reported on 22.7% of returns)
Here:
$1,560
State:
$5,432
(% of AGI for various income ranges: 73.3% for AGIs $25k-50k, 186.7% for AGIs $100k-200k)
Net capital gain/loss in AGI: +$2,900 (reported on 18.2% of returns)
Here:
+$2,900
State:
+$15,243
(% of AGI for various income ranges: 117.5% for AGIs below $25k, 230.0% for AGIs $100k-200k)
Profit/loss from business: +$3,333 (reported on 13.6% of returns)
Here:
+$3,333
State:
+$11,763
(% of AGI for various income ranges: 333.3% for AGIs $25k-50k)
Percentage of individuals using paid preparers for their 2020 taxes: 100.0%
Here:
100%
State:
95%
(% for various income ranges: 100.0% for AGIs below $25k, 100.0% for AGIs $25k-50k, 100.0% for AGIs $50k-75k, 100.0% for AGIs $75k-100k, 100.0% for AGIs $100k-200k)
Averages for the 2012 tax year for zip code 51548, filed in 2013:
Average Adjusted Gross Income (AGI) in 2012: $61,671 (Individual Income Tax Returns)
Here:
$61,671
State:
$58,860
Salary/wage: $54,447 (reported on 81.0% of returns)
Here:
$54,447
State:
$46,659
(% of AGI for various income ranges: 82.3% for AGIs below $25k, 70.8% for AGIs $25k-50k, 74.1% for AGIs $50k-75k, 71.8% for AGIs $75k-100k, 69.5% for AGIs $100k-200k)
Taxable interest for individuals: $425 (reported on 38.1% of returns)
This zip code:
$425
Iowa:
$1,537
Ordinary dividends: $950 (reported on 19.0% of returns)
Here:
$950
State:
$4,542
Net capital gain/loss in AGI: +$3,933 (reported on 14.3% of returns)
Here:
+$3,933
State:
+$11,802
Profit/loss from business: +$4,033 (reported on 14.3% of returns)
Here:
+$4,033
State:
+$10,509
Total itemized deductions: $20,175 (20% of AGI, reported on 38.1% of returns)
Here:
$20,175
State:
$21,278
Here:
19.8% of AGI
State:
18.9% of AGI
Charity contributions: $2,800 (reported on 33.3% of returns)
Here:
$2,800
State:
$4,044
(% of AGI for various income ranges: 3.3% for AGIs $50k-75k, 2.2% for AGIs $100k-200k)
Taxes paid: $8,212 (reported on 38.1% of returns)
51548:
$8,212
State:
$8,846
(% of AGI for various income ranges: 13.2% for AGIs $50k-75k, 6.5% for AGIs $100k-200k)
Percentage of individuals using paid preparers for their 2012 taxes: 71.4%
Here:
71%
State:
65%
(% for various income ranges: 60.0% for AGIs below $25k, 75.0% for AGIs $25k-50k, 75.0% for AGIs $50k-75k, 75.0% for AGIs $75k-100k, 75.0% for AGIs $100k-200k)
Averages for the 2004 tax year for zip code 51548, filed in 2005:
Average Adjusted Gross Income (AGI) in 2004: $45,509 (Individual Income Tax Returns)
Here:
$45,509
State:
$43,875
Salary/wage: $42,177 (reported on 88.4% of returns)
Here:
$42,177
State:
$38,265
(% of AGI for various income ranges: 91.6% for AGIs below $10k, 80.3% for AGIs $10k-25k, 81.4% for AGIs $25k-50k, 88.0% for AGIs $50k-75k, 84.2% for AGIs $75k-100k, 71.4% for AGIs over 100k)
Taxable interest for individuals: $378 (reported on 43.8% of returns)
This zip code:
$378
Iowa:
$1,768
(% of AGI for various income ranges: 0.9% for AGIs $10k-25k, 0.4% for AGIs $25k-50k, 0.3% for AGIs $50k-75k, 0.6% for AGIs $75k-100k)
Taxable dividends: $429 (reported on 18.8% of returns)
Here:
$429
State:
$2,510
Profit/loss from business: +$6,808 (reported on 11.6% of returns)
Here:
+$6,808
State:
+$8,574
Profit/loss from farming: +$769 (reported on 5.8% of returns)
Here:
+$769
State:
-$74
Total itemized deductions: $16,969 (24% of AGI, reported on 42.9% of returns)
Here:
$16,969
State:
$16,976
Here:
24.0% of AGI
State:
20.8% of AGI
(% of AGI for various income ranges: 17.1% for AGIs $25k-50k, 16.3% for AGIs $50k-75k, 21.4% for AGIs $75k-100k, 15.3% for AGIs over 100k)
Charity contributions deductions: $2,143 (3% of AGI, reported on 34.4% of returns)
Here:
$2,143
State:
$3,089
Here:
2.8% of AGI
State:
3.6% of AGI
(% of AGI for various income ranges: 0.6% for AGIs $25k-50k, 2.1% for AGIs $50k-75k, 2.0% for AGIs $75k-100k, 2.4% for AGIs over 100k)
Total tax: $4,866 (reported on 83.5% of returns)
51548:
$4,866
State:
$6,177
(% of AGI for various income ranges: 4.5% for AGIs $10k-25k, 6.6% for AGIs $25k-50k, 7.7% for AGIs $50k-75k, 8.6% for AGIs $75k-100k, 16.0% for AGIs over 100k)
Earned income credit: $1,500 (reported on 4.5% of returns)
Here:
$1,500
State:
$1,540
Percentage of individuals using paid preparers for their 2004 taxes: 77.2%
Here:
77%
State:
70%
(% for various income ranges: 50.0% for AGIs below $10k, 73.3% for AGIs $10k-25k, 83.1% for AGIs $25k-50k, 87.0% for AGIs $50k-75k, 76.9% for AGIs $75k-100k, 91.7% for AGIs over 100k)
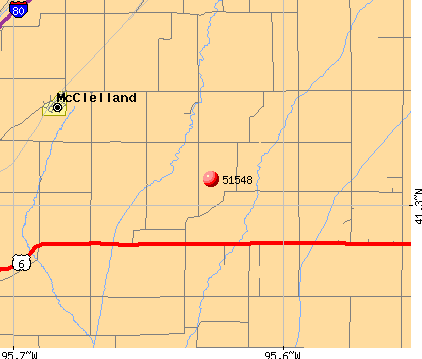
Notable locations in zip code 51548: McClelland (A), McClelland Volunteer Fire Department (B), Pottawattami County Home (C). Display/hide their locations on the map
Size of family households: 78 2-persons, 32 3-persons, 31 4-persons, 11 5-persons, 4 6-persons, 2 7-or-more-persons
Size of nonfamily households: 25 1-person
121 married couples with children.
9 single-parent households (9 men).
All residents speak English at home
Foreign born population: 0 (0.0%)
:
0.0%
Whole state:
6.0%
52%German
15%English
10%American
6%European
6%Czech
5%Norwegian
5%Irish
74.3%Bottled, tank, or LP gas
21.6%Electricity
3.3%Wood
0.6%Utility gas
0.6%Fuel oil, kerosene, etc.
Population in 1990: 714.
Place of birth for U.S.-born residents:
This state: 255
Northeast: 1
Midwest: 229
South: 12
West: 6
63% of the 51548 zip code residents lived in the same house 5 years ago. Out of people who lived in different houses, 40% lived in this county. Out of people who lived in different counties, 50% lived in Iowa.
86% of the 51548 zip code residents lived in the same house 1 year ago. Out of people who lived in different houses, 74% moved from this county. Out of people who lived in different houses, 11% moved from different county within same state. Out of people who lived in different houses, 9% moved from different state.
Private vs. public school enrollment:
Students in private schools in grades 1 to 8 (elementary and middle school): 8
Here:
10.4%
Iowa:
10.6%
Students in private schools in grades 9 to 12 (high school): 2
Here:
8.4%
Iowa:
7.9%
Students in private undergraduate colleges:
Here:
0.0%
Iowa:
23.9%
Occupation by median earnings in the past 12 months ($)
109,247Sales and related occupations
95,951Business and financial operations occupations
66,723Material moving occupations
61,787Management occupations
55,434Installation, maintenance, and repair occupations
49,208Health diagnosing and treating practitioners and other technical occupations
Companies with federal contracts located in this zip code:
SCOLA (21557 270TH ST in MC CLELLAND, IA) : $10,868,000 in 18 contractsfrom 1999 to 2006
Contracts for Radio and Television Communication Equipment, Except Airborne, Communications Services, Film/Video Tape Production Services by Army, Defense Intelligence Agency, Department of Defense Signed by year:2000: $250,000; 2001: $750,000; 2002: $1,400,000; 2003: $1,272,000; 2004: $2,600,000; 2005: $3,498,000; 2006: $498,000.
Biggest contracts:
$3,000,000 with Army for Radio and Television Communication Equipment, Except Airborne. Taking place in CA. Signed on 2005-09-26. Completion date: 2006-09-26.
$2,600,000 with Army for Radio and Television Communication Equipment, Except Airborne. Signed on 2004-09-29. Completion date: 2005-09-27.
$1,272,000 with Army for Radio and Television Communication Equipment, Except Airborne. Taking place in CA. Signed on 2003-08-14. Completion date: 2004-02-28.
$1,200,000, same as above.Signed on 2002-09-27. Completion date: 2003-09-27.
Top industries in this zip code by the number of employees in 2005:
Information: Cable and Other Program Distribution (20-49 employees: 1 establishment)
Professional, Scientific, and Technical Services: Advertising Agencies (1-4: 1)
Accommodation and Food Services: Drinking Places (Alcoholic Beverages) (1-4: 1)
Construction: Painting and Wall Covering Contractors (1-4: 1)
Construction: New Single-Family Housing Construction (except Operative Builders) (1-4: 1)
Fatal accident statistics in 2013:
Fatal accident count: 1
Vehicles involved in fatal accidents: 1
Fatal accidents caused by drunken drivers: 1
Fatalities: 1
Persons involved in fatal accidents: 2
Pedestrians involved in fatal accidents: 0
Home Mortgage Disclosure Act Aggregated Statistics For Year 2009 (Based on 4 partial tracts)
A) FHA, FSA/RHS & VA Home Purchase Loans
B) Conventional Home Purchase Loans
C) Refinancings
D) Home Improvement Loans
E) Loans on Dwellings For 5+ Families
G) Loans On Manufactured Home Dwelling (A B C & D)
Number
Average Value
Number
Average Value
Number
Average Value
Number
Average Value
Number
Average Value
Number
Average Value
LOANS ORIGINATED
8
$145,666
7
$130,201
58
$177,853
6
$45,330
1
$140,990
0
$0
APPLICATIONS APPROVED, NOT ACCEPTED
1
$82,810
1
$120,900
10
$155,919
1
$70,150
0
$0
0
$0
APPLICATIONS DENIED
3
$116,320
2
$144,805
19
$171,591
2
$12,300
0
$0
1
$61,240
APPLICATIONS WITHDRAWN
1
$141,600
1
$89,440
8
$180,186
1
$29,910
0
$0
0
$0
FILES CLOSED FOR INCOMPLETENESS
0
$0
0
$0
2
$117,310
0
$0
0
$0
0
$0
Aggregated Statistics For Year 2008 (Based on 4 partial tracts)
A) FHA, FSA/RHS & VA Home Purchase Loans
B) Conventional Home Purchase Loans
C) Refinancings
D) Home Improvement Loans
E) Loans on Dwellings For 5+ Families
F) Non-occupant Loans on < 5 Family Dwellings (A B C & D)
Number
Average Value
Number
Average Value
Number
Average Value
Number
Average Value
Number
Average Value
Number
Average Value
LOANS ORIGINATED
5
$148,548
11
$159,185
28
$135,304
8
$32,205
1
$48,880
4
$111,568
APPLICATIONS APPROVED, NOT ACCEPTED
1
$81,720
0
$0
4
$167,068
1
$61,750
0
$0
0
$0
APPLICATIONS DENIED
0
$0
1
$184,660
12
$173,959
2
$57,690
0
$0
1
$120,230
APPLICATIONS WITHDRAWN
0
$0
0
$0
5
$132,226
0
$0
0
$0
0
$0
FILES CLOSED FOR INCOMPLETENESS
0
$0
0
$0
2
$151,870
0
$0
0
$0
0
$0
Aggregated Statistics For Year 2007 (Based on 4 partial tracts)
A) FHA, FSA/RHS & VA Home Purchase Loans
B) Conventional Home Purchase Loans
C) Refinancings
D) Home Improvement Loans
F) Non-occupant Loans on < 5 Family Dwellings (A B C & D)
G) Loans On Manufactured Home Dwelling (A B C & D)
Number
Average Value
Number
Average Value
Number
Average Value
Number
Average Value
Number
Average Value
Number
Average Value
LOANS ORIGINATED
2
$180,610
21
$156,124
32
$133,663
11
$37,062
4
$87,545
1
$116,280
APPLICATIONS APPROVED, NOT ACCEPTED
0
$0
2
$131,570
7
$137,263
1
$106,680
0
$0
0
$0
APPLICATIONS DENIED
0
$0
5
$106,184
14
$149,690
2
$116,250
2
$160,310
1
$70,500
APPLICATIONS WITHDRAWN
0
$0
1
$109,730
4
$137,145
1
$100,790
0
$0
0
$0
FILES CLOSED FOR INCOMPLETENESS
0
$0
1
$186,600
3
$189,277
0
$0
0
$0
0
$0
Aggregated Statistics For Year 2006 (Based on 4 partial tracts)
A) FHA, FSA/RHS & VA Home Purchase Loans
B) Conventional Home Purchase Loans
C) Refinancings
D) Home Improvement Loans
F) Non-occupant Loans on < 5 Family Dwellings (A B C & D)
G) Loans On Manufactured Home Dwelling (A B C & D)
Number
Average Value
Number
Average Value
Number
Average Value
Number
Average Value
Number
Average Value
Number
Average Value
LOANS ORIGINATED
1
$227,490
26
$139,176
35
$124,581
12
$39,970
5
$151,028
1
$84,290
APPLICATIONS APPROVED, NOT ACCEPTED
0
$0
1
$44,700
5
$132,232
1
$84,470
0
$0
0
$0
APPLICATIONS DENIED
0
$0
2
$138,155
15
$134,898
5
$57,950
0
$0
0
$0
APPLICATIONS WITHDRAWN
0
$0
2
$143,350
6
$143,262
1
$26,930
0
$0
0
$0
FILES CLOSED FOR INCOMPLETENESS
0
$0
0
$0
4
$189,125
0
$0
0
$0
0
$0
Aggregated Statistics For Year 2005 (Based on 4 partial tracts)
A) FHA, FSA/RHS & VA Home Purchase Loans
B) Conventional Home Purchase Loans
C) Refinancings
D) Home Improvement Loans
F) Non-occupant Loans on < 5 Family Dwellings (A B C & D)
G) Loans On Manufactured Home Dwelling (A B C & D)
Number
Average Value
Number
Average Value
Number
Average Value
Number
Average Value
Number
Average Value
Number
Average Value
LOANS ORIGINATED
2
$118,420
27
$130,026
41
$136,700
4
$30,435
1
$167,910
1
$98,380
APPLICATIONS APPROVED, NOT ACCEPTED
0
$0
2
$114,400
4
$90,262
1
$41,720
0
$0
0
$0
APPLICATIONS DENIED
0
$0
5
$98,566
21
$111,213
4
$25,788
0
$0
1
$72,790
APPLICATIONS WITHDRAWN
0
$0
2
$137,680
13
$148,395
1
$39,420
1
$72,240
0
$0
FILES CLOSED FOR INCOMPLETENESS
0
$0
2
$140,680
6
$149,712
0
$0
0
$0
0
$0
Aggregated Statistics For Year 2004 (Based on 4 partial tracts)
A) FHA, FSA/RHS & VA Home Purchase Loans
B) Conventional Home Purchase Loans
C) Refinancings
D) Home Improvement Loans
F) Non-occupant Loans on < 5 Family Dwellings (A B C & D)
G) Loans On Manufactured Home Dwelling (A B C & D)
Number
Average Value
Number
Average Value
Number
Average Value
Number
Average Value
Number
Average Value
Number
Average Value
LOANS ORIGINATED
2
$124,950
25
$158,424
45
$132,309
11
$25,393
3
$78,320
1
$90,800
APPLICATIONS APPROVED, NOT ACCEPTED
0
$0
3
$79,173
8
$142,468
2
$94,260
0
$0
0
$0
APPLICATIONS DENIED
0
$0
4
$122,278
21
$122,468
2
$33,905
0
$0
0
$0
APPLICATIONS WITHDRAWN
0
$0
4
$120,162
5
$135,928
1
$181,650
0
$0
0
$0
FILES CLOSED FOR INCOMPLETENESS
0
$0
0
$0
6
$105,238
1
$8,950
0
$0
0
$0
Aggregated Statistics For Year 2003 (Based on 4 partial tracts)
A) FHA, FSA/RHS & VA Home Purchase Loans
B) Conventional Home Purchase Loans
C) Refinancings
D) Home Improvement Loans
F) Non-occupant Loans on < 5 Family Dwellings (A B C & D)
Number
Average Value
Number
Average Value
Number
Average Value
Number
Average Value
Number
Average Value
LOANS ORIGINATED
1
$156,090
17
$141,888
103
$121,849
13
$21,228
3
$61,087
APPLICATIONS APPROVED, NOT ACCEPTED
0
$0
2
$124,415
6
$136,453
1
$18,130
0
$0
APPLICATIONS DENIED
0
$0
3
$75,370
26
$114,693
4
$17,785
0
$0
APPLICATIONS WITHDRAWN
0
$0
3
$131,597
14
$106,976
0
$0
0
$0
FILES CLOSED FOR INCOMPLETENESS
0
$0
0
$0
3
$156,007
0
$0
0
$0
Aggregated Statistics For Year 1999 (Based on 1 partial tract)
A) FHA, FSA/RHS & VA Home Purchase Loans
B) Conventional Home Purchase Loans
C) Refinancings
D) Home Improvement Loans
F) Non-occupant Loans on < 5 Family Dwellings (A B C & D)


+$769
-$74
 Nearest zip codes: 51575, 51576, 51553, 51559, 51503, 51554.


 : $10,868,000 in 18 contracts from 1999 to 2006


