Estimated zip code population in 2022: 1,104 Zip code population in 2010: 1,013 Zip code population in 2000: 956
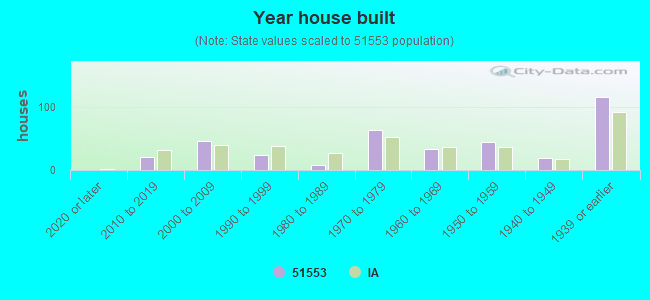
Houses and condos: 382 Renter-occupied apartments: 46
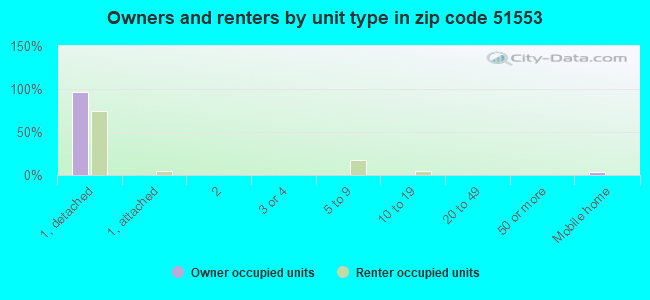
% of renters here:
12%
State:
28%
March 2022 cost of living index in zip code 51553: 82.4 (low, U.S. average is 100)
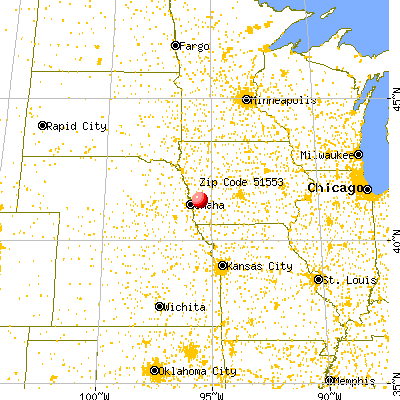
Land area: 45.7 sq. mi. Water area: 0.0 sq. mi.
Population density: 24 people per square mile
(very low).
OSM Map
General Map
Google Map
MSN Map
OSM Map
General Map
Google Map
MSN Map
OSM Map
General Map
Google Map
MSN Map
OSM Map
General Map
Google Map
MSN Map
Please wait while loading the map...
Real estate property taxes paid for housing units in 2022:
This zip code:
1.1% ($2,467)
Iowa:
1.4% ($2,724)
Median real estate property taxes paid for housing units with mortgages in 2022: $2,552 (1.3%) Median real estate property taxes paid for housing units with no mortgage in 2022: $2,402 (1.0%)
Business Search- 14 Million verified businesses
Males: 637
(57.7%)
Females: 466
(42.3%)
For population 25 years and over in 51553:
High school or higher: 96.1%
Bachelor's degree or higher: 22.3%
Graduate or professional degree: 7.3%
Unemployed: 0.4%
Mean travel time to work (commute): 36.1 minutes
For population 15 years and over in 51553:
Never married: 28.1%
Now married: 58.1%
Separated: 0.7%
Widowed: 5.2%
Divorced: 7.9%
Zip code 51553 compared to state average:
Unemployed percentage significantly below state average.
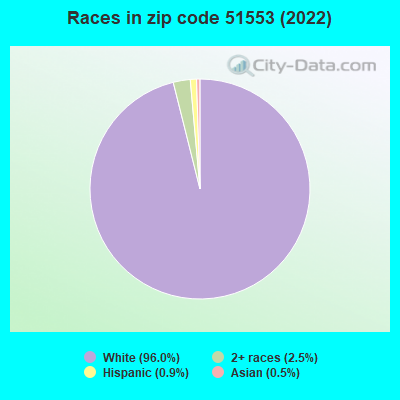
Black race population percentage significantly below state average.
Hispanic race population percentage significantly below state average.
Foreign-born population percentage significantly below state average.
Renting percentage significantly below state average.
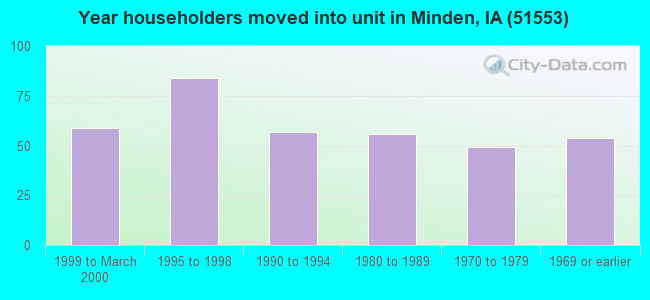
Length of stay since moving in significantly above state average.
Percentage of population with a bachelor's degree or higher below state average.
Averages for the 2020 tax year for zip code 51553, filed in 2021:
Average Adjusted Gross Income (AGI) in 2020: $72,871 (Individual Income Tax Returns)
Here:
$72,871
State:
$71,087
Salary/wage: $61,684 (reported on 82.2% of returns)
Here:
$61,684
State:
$57,361
(% of AGI for various income ranges: 1255.0% for AGIs below $25k, 3608.3% for AGIs $25k-50k, 5018.0% for AGIs $50k-75k, 8630.0% for AGIs $75k-100k, 22821.7% for AGIs $100k-200k)
Taxable interest for individuals: $676 (reported on 37.8% of returns)
This zip code:
$676
Iowa:
$1,633
(% of AGI for various income ranges: 16.2% for AGIs below $25k, 45.0% for AGIs $25k-50k, 117.5% for AGIs $75k-100k, 46.7% for AGIs $100k-200k)
Ordinary dividends: $1,320 (reported on 22.2% of returns)
Here:
$1,320
State:
$5,432
(% of AGI for various income ranges: 35.0% for AGIs below $25k, 54.0% for AGIs $50k-75k, 128.3% for AGIs $100k-200k)
Net capital gain/loss in AGI: +$4,644 (reported on 20.0% of returns)
Here:
+$4,644
State:
+$15,243
(% of AGI for various income ranges: 171.7% for AGIs $25k-50k, 202.5% for AGIs $75k-100k, 390.0% for AGIs $100k-200k)
Profit/loss from business: +$5,286 (reported on 15.6% of returns)
Here:
+$5,286
State:
+$11,763
(% of AGI for various income ranges: 307.5% for AGIs below $25k, 148.0% for AGIs $50k-75k, 83.3% for AGIs $100k-200k)
Taxable individual retirement arrangement distribution: $13,025 (reported on 8.9% of returns)
51553:
$13,025
Iowa:
$17,324
(% of AGI for various income ranges: 1302.5% for AGIs $75k-100k)
Earned income credit: $1,725 (reported on 8.9% of returns)
Here:
$1,725
State:
$2,195
(% of AGI for various income ranges: 115.0% for AGIs $25k-50k)
Percentage of individuals using paid preparers for their 2020 taxes: 95.6%
Here:
96%
State:
95%
(% for various income ranges: 100.0% for AGIs below $25k, 88.9% for AGIs $25k-50k, 100.0% for AGIs $50k-75k, 83.3% for AGIs $75k-100k, 100.0% for AGIs $100k-200k)
Averages for the 2012 tax year for zip code 51553, filed in 2013:
Average Adjusted Gross Income (AGI) in 2012: $61,286 (Individual Income Tax Returns)
Here:
$61,286
State:
$58,860
Salary/wage: $49,714 (reported on 84.1% of returns)
Here:
$49,714
State:
$46,659
(% of AGI for various income ranges: 60.9% for AGIs below $25k, 75.6% for AGIs $25k-50k, 71.7% for AGIs $50k-75k, 73.9% for AGIs $75k-100k, 62.9% for AGIs $100k-200k)
Taxable interest for individuals: $600 (reported on 43.2% of returns)
This zip code:
$600
Iowa:
$1,537
(% of AGI for various income ranges: 1.0% for AGIs below $25k, 0.4% for AGIs $25k-50k, 0.7% for AGIs $50k-75k, 0.4% for AGIs $75k-100k, 0.3% for AGIs $100k-200k)
Ordinary dividends: $1,533 (reported on 20.5% of returns)
Here:
$1,533
State:
$4,542
(% of AGI for various income ranges: 2.6% for AGIs below $25k, 1.2% for AGIs $50k-75k, 0.3% for AGIs $100k-200k)
Net capital gain/loss in AGI: +$1,183 (reported on 13.6% of returns)
Here:
+$1,183
State:
+$11,802
Profit/loss from business: +$7,783 (reported on 13.6% of returns)
Here:
+$7,783
State:
+$10,509
Taxable individual retirement arrangement distribution: $7,633 (reported on 6.8% of returns)
51553:
$7,633
Iowa:
$11,773
Total itemized deductions: $19,067 (20% of AGI, reported on 34.1% of returns)
Here:
$19,067
State:
$21,278
Here:
19.6% of AGI
State:
18.9% of AGI
(% of AGI for various income ranges: 32.7% for AGIs below $25k, 9.2% for AGIs $50k-75k, 11.5% for AGIs $75k-100k, 11.0% for AGIs $100k-200k)
Charity contributions: $2,625 (reported on 27.3% of returns)
Here:
$2,625
State:
$4,044
(% of AGI for various income ranges: 2.2% for AGIs $25k-50k, 2.0% for AGIs $75k-100k, 1.1% for AGIs $100k-200k)
Taxes paid: $7,380 (reported on 34.1% of returns)
51553:
$7,380
State:
$8,846
(% of AGI for various income ranges: 6.5% for AGIs below $25k, 2.6% for AGIs $50k-75k, 4.2% for AGIs $75k-100k, 5.6% for AGIs $100k-200k)
Earned income credit: $1,950 (reported on 9.1% of returns)
Here:
$1,950
State:
$2,098
(% of AGI for various income ranges: 3.2% for AGIs below $25k, 0.9% for AGIs $25k-50k)
Percentage of individuals using paid preparers for their 2012 taxes: 75.0%
Here:
75%
State:
65%
(% for various income ranges: 69.2% for AGIs below $25k, 66.7% for AGIs $25k-50k, 75.0% for AGIs $50k-75k, 83.3% for AGIs $75k-100k, 87.5% for AGIs $100k-200k)
Averages for the 2004 tax year for zip code 51553, filed in 2005:
Average Adjusted Gross Income (AGI) in 2004: $41,260 (Individual Income Tax Returns)
Here:
$41,260
State:
$43,875
Salary/wage: $40,486 (reported on 85.2% of returns)
Here:
$40,486
State:
$38,265
(% of AGI for various income ranges: 389.9% for AGIs below $10k, 83.4% for AGIs $10k-25k, 79.0% for AGIs $25k-50k, 82.5% for AGIs $50k-75k, 85.4% for AGIs $75k-100k, 80.4% for AGIs over 100k)
Taxable interest for individuals: $996 (reported on 50.6% of returns)
This zip code:
$996
Iowa:
$1,768
(% of AGI for various income ranges: 29.2% for AGIs below $10k, 3.4% for AGIs $10k-25k, 1.7% for AGIs $25k-50k, 1.1% for AGIs $50k-75k, 0.2% for AGIs $75k-100k, 0.4% for AGIs over 100k)
Taxable dividends: $805 (reported on 25.3% of returns)
Here:
$805
State:
$2,510
(% of AGI for various income ranges: 11.2% for AGIs below $10k, 0.4% for AGIs $10k-25k, 0.4% for AGIs $25k-50k, 1.0% for AGIs $50k-75k, 0.1% for AGIs $75k-100k)
Net capital gain/loss: +$1,391 (reported on 19.5% of returns)
Here:
+$1,391
State:
+$6,139
(% of AGI for various income ranges: -7.9% for AGIs below $10k, 0.7% for AGIs $25k-50k, 0.3% for AGIs $50k-75k, 1.9% for AGIs $75k-100k)
Profit/loss from business: +$3,621 (reported on 14.8% of returns)
Here:
+$3,621
State:
+$8,574
Profit/loss from farming: +$5,756 (reported on 9.2% of returns)
Here:
+$5,756
State:
-$74
IRA payment deduction: $3,667 (reported on 3.4% of returns)
51553:
$3,667
Iowa:
$2,970
Total itemized deductions: $15,266 (24% of AGI, reported on 35.3% of returns)
Here:
$15,266
State:
$16,976
Here:
24.1% of AGI
State:
20.8% of AGI
(% of AGI for various income ranges: 15.4% for AGIs $10k-25k, 10.6% for AGIs $25k-50k, 14.8% for AGIs $50k-75k, 13.2% for AGIs $75k-100k, 12.6% for AGIs over 100k)
Charity contributions deductions: $1,638 (2% of AGI, reported on 30.9% of returns)
Here:
$1,638
State:
$3,089
Here:
2.5% of AGI
State:
3.6% of AGI
(% of AGI for various income ranges: 1.6% for AGIs $10k-25k, 0.8% for AGIs $25k-50k, 1.1% for AGIs $50k-75k, 1.4% for AGIs $75k-100k, 1.7% for AGIs over 100k)
Total tax: $4,526 (reported on 77.9% of returns)
51553:
$4,526
State:
$6,177
(% of AGI for various income ranges: 13.5% for AGIs below $10k, 4.8% for AGIs $10k-25k, 6.9% for AGIs $25k-50k, 7.4% for AGIs $50k-75k, 10.3% for AGIs $75k-100k, 12.9% for AGIs over 100k)
Earned income credit: $1,500 (reported on 10.7% of returns)
Here:
$1,500
State:
$1,540
Percentage of individuals using paid preparers for their 2004 taxes: 72.7%
Here:
73%
State:
70%
(% for various income ranges: 69.9% for AGIs below $10k, 76.2% for AGIs $10k-25k, 76.5% for AGIs $25k-50k, 74.4% for AGIs $50k-75k, 60.8% for AGIs $75k-100k, 70.0% for AGIs over 100k)
Household received Food Stamps/SNAP in the past 12 months: 17 Household did not receive Food Stamps/SNAP in the past 12 months: 372
Women who had a birth in the past 12 months: 9 (9 now married, 0 unmarried) Women who did not have a birth in the past 12 months: 213 (118 now married, 94 unmarried)
Housing units in zip code 51553 with a mortgage: 185 (17 second mortgage, 16 both second mortgage and home equity loan) Houses without a mortgage: 19
Median monthly owner costs for units with a mortgage: $1,359 Median monthly owner costs for units without a mortgage: $569
Residents with income below the poverty level in 2022:
This zip code:
7.5%
Whole state:
11.0%
Residents with income below 50% of the poverty level in 2022:
This zip code:
5.4%
Whole state:
5.5%
Median number of rooms in houses and condos:
Here:
7.4
State:
6.8
Median number of rooms in apartments:
Here:
5.0
State:
4.2
Notable locations in this zip code not listed on our city pages
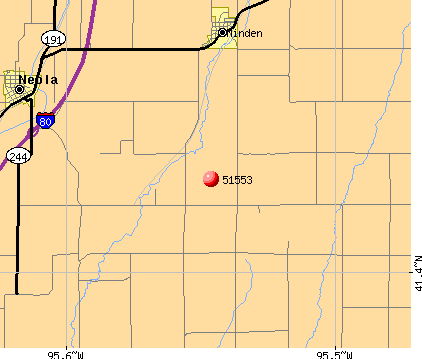
Notable locations in zip code 51553: Minden City Hall (A), Minden Community Hall (B), Minden Volunteer Fire and Rescue (C). Display/hide their locations on the map
Churches in zip code 51553 include: United Church of Christ (A), Harvest Alliance Church (B), Silver Creek Church (C). Display/hide their locations on the map
Size of family households: 100 2-persons, 72 3-persons, 59 4-persons, 45 5-persons, 4 6-persons, 2 7-or-more-persons
Size of nonfamily households: 83 1-person, 17 2-persons
217 married couples with children.
40 single-parent households (7 men, 33 women).
98.1% of residents of 51553 zip code speak English at home.
0.6% of residents speak Spanish at home (100% very well).
0.7% of residents speak other Indo-European language at home (29% very well, 71% well).
0.1% of residents speak Asian or Pacific Island language at home (100% well).
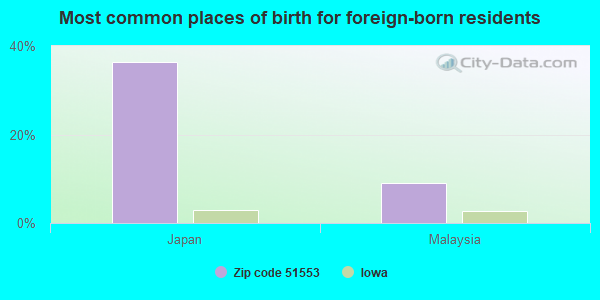
Foreign born population: 11 (1.1%) (55.4% of them are naturalized citizens)
This zip code:
1.1%
Whole state:
6.0%
36%Japan
9%Malaysia
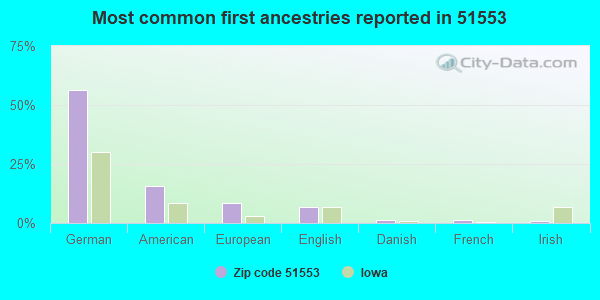
56%German
16%American
8%European
7%English
1%Danish
1%French
1%Irish
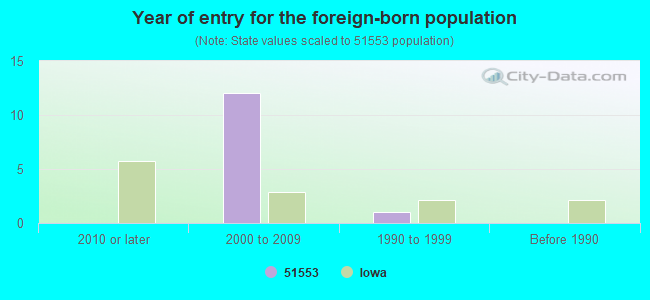
Year of entry for the foreign-born population
02010 or later
122000 to 2009
11990 to 1999
0Before 1990
Facilities with environmental interests located in this zip code:
DAVES AUTO (206 MAIN STREET in MINDEN, IA)
AIR MINOR (AIRS/AFS) (Integrated Compliance Information System) - ICIS-07-1999-0176, FORMAL ENFORCEMENT ACTION Business SIC classification: GENERAL AUTOMOTIVE REPAIR SHOPS
AT&T (RR in MINDEN, IA)
(Resource Conservation and Recovery Act (tracking hazardous waste))
POTTAWATTAMIE COUNTY ENGRS OFF (E SIDE OF L66-9 MI S OF MINDEN in MINDEN, IA)
Small Quantity Generators, between 100 kg and 1000 kg of hazardous waste/month (Resource Conservation and Recovery Act (tracking hazardous waste)) Business NAICS classification: GENERAL AUTOMOTIVE REPAIR.
Housing units lacking complete kitchen facilities: 0.2%
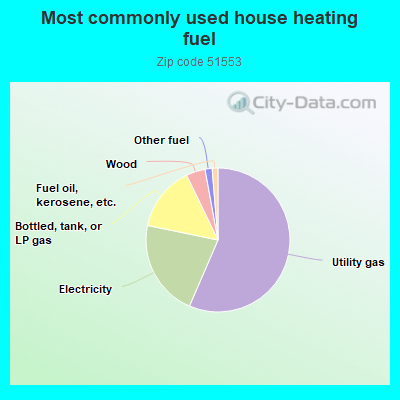
56.9%Utility gas
21.9%Electricity
14.7%Bottled, tank, or LP gas
4.3%Wood
1.6%Other fuel
1.3%Fuel oil, kerosene, etc.
Population in 1990: 917. Population change in the 1990s: +39 (+4.3%).
Place of birth for U.S.-born residents:
This state: 736
Northeast: 7
Midwest: 303
South: 21
West: 12
66% of the 51553 zip code residents lived in the same house 5 years ago. Out of people who lived in different houses, 74% lived in this county. Out of people who lived in different counties, 50% lived in Iowa.
99% of the 51553 zip code residents lived in the same house 1 year ago. Out of people who lived in different houses, 75% moved from this county. Out of people who lived in different houses, 62% moved from different county within same state.
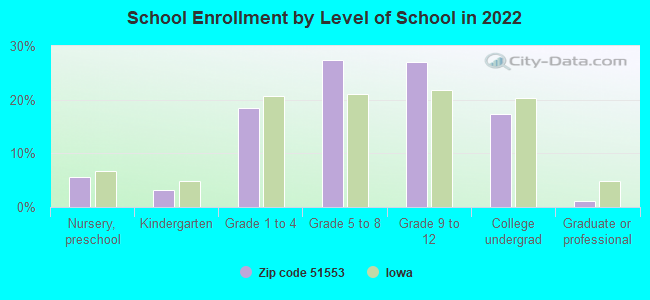
Private vs. public school enrollment:
Students in private schools in grades 1 to 8 (elementary and middle school): 2
Here:
2.2%
Iowa:
10.6%
Students in private schools in grades 9 to 12 (high school):
Here:
0.0%
Iowa:
7.9%
Students in private undergraduate colleges: 14
Here:
30.0%
Iowa:
23.9%
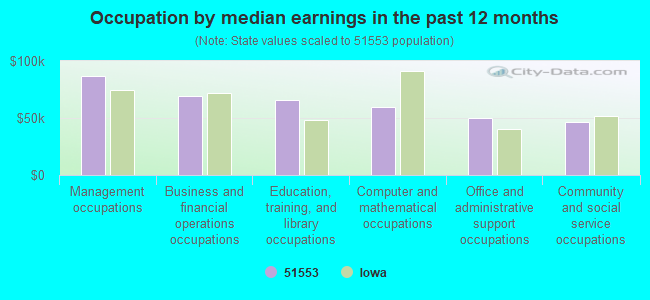
Occupation by median earnings in the past 12 months ($)
87,194Management occupations
68,883Business and financial operations occupations
65,703Education, training, and library occupations
59,676Computer and mathematical occupations
49,803Office and administrative support occupations
46,451Community and social service occupations
Top industries in this zip code by the number of employees in 2005:
Accommodation and Food Services: Full-Service Restaurants (10-19 employees: 1 establishment)
Construction: Roofing Contractors (5-9: 1)
Construction: Masonry Contractors (1-4: 1)
Fatal accident statistics in 2014:
Fatal accident count: 1
Vehicles involved in fatal accidents: 2
Fatal accidents caused by drunken drivers: 0
Fatalities: 1
Persons involved in fatal accidents: 3
Pedestrians involved in fatal accidents: 0
Fatal accident statistics in 2013:
Fatal accident count: 1
Vehicles involved in fatal accidents: 1
Fatal accidents caused by drunken drivers: 0
Fatalities: 1
Persons involved in fatal accidents: 1
Pedestrians involved in fatal accidents: 0
Home Mortgage Disclosure Act Aggregated Statistics For Year 2009 (Based on 4 partial tracts)
A) FHA, FSA/RHS & VA Home Purchase Loans
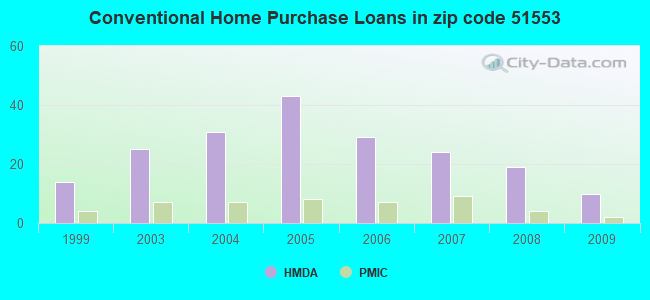
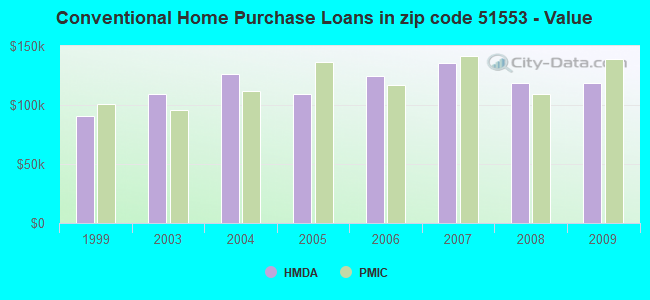
B) Conventional Home Purchase Loans
C) Refinancings
D) Home Improvement Loans
E) Loans on Dwellings For 5+ Families
F) Non-occupant Loans on < 5 Family Dwellings (A B C & D)
G) Loans On Manufactured Home Dwelling (A B C & D)
Number
Average Value
Number
Average Value
Number
Average Value
Number
Average Value
Number
Average Value
Number
Average Value
Number
Average Value
LOANS ORIGINATED
10
$126,978
10
$118,900
65
$160,976
9
$30,469
1
$141,950
3
$57,877
0
$0
APPLICATIONS APPROVED, NOT ACCEPTED
0
$0
0
$0
10
$144,895
0
$0
0
$0
1
$45,470
0
$0
APPLICATIONS DENIED
4
$108,132
2
$119,610
27
$154,811
2
$30,365
0
$0
0
$0
1
$61,660
APPLICATIONS WITHDRAWN
0
$0
2
$79,595
8
$154,610
0
$0
0
$0
0
$0
0
$0
FILES CLOSED FOR INCOMPLETENESS
0
$0
0
$0
1
$209,820
0
$0
0
$0
0
$0
0
$0
Aggregated Statistics For Year 2008 (Based on 4 partial tracts)
A) FHA, FSA/RHS & VA Home Purchase Loans
B) Conventional Home Purchase Loans
C) Refinancings
D) Home Improvement Loans
F) Non-occupant Loans on < 5 Family Dwellings (A B C & D)
Number
Average Value
Number
Average Value
Number
Average Value
Number
Average Value
Number
Average Value
LOANS ORIGINATED
6
$154,018
19
$118,541
39
$123,392
13
$17,338
11
$80,785
APPLICATIONS APPROVED, NOT ACCEPTED
0
$0
0
$0
4
$110,568
1
$56,700
0
$0
APPLICATIONS DENIED
0
$0
1
$152,540
16
$146,810
2
$24,220
1
$98,000
APPLICATIONS WITHDRAWN
1
$183,910
1
$106,190
6
$143,648
1
$66,460
0
$0
FILES CLOSED FOR INCOMPLETENESS
0
$0
0
$0
2
$149,935
0
$0
0
$0
Aggregated Statistics For Year 2007 (Based on 4 partial tracts)
A) FHA, FSA/RHS & VA Home Purchase Loans
B) Conventional Home Purchase Loans
C) Refinancings
D) Home Improvement Loans
F) Non-occupant Loans on < 5 Family Dwellings (A B C & D)
G) Loans On Manufactured Home Dwelling (A B C & D)
Number
Average Value
Number
Average Value
Number
Average Value
Number
Average Value
Number
Average Value
Number
Average Value
LOANS ORIGINATED
4
$142,818
24
$135,222
40
$112,420
15
$28,745
4
$68,200
1
$39,710
APPLICATIONS APPROVED, NOT ACCEPTED
0
$0
4
$114,818
10
$126,457
1
$16,240
0
$0
0
$0
APPLICATIONS DENIED
0
$0
8
$91,491
17
$132,911
4
$59,108
2
$160,585
1
$70,980
APPLICATIONS WITHDRAWN
0
$0
1
$181,890
8
$124,508
1
$11,140
0
$0
0
$0
FILES CLOSED FOR INCOMPLETENESS
0
$0
1
$121,990
5
$138,094
0
$0
0
$0
0
$0
Aggregated Statistics For Year 2006 (Based on 4 partial tracts)
A) FHA, FSA/RHS & VA Home Purchase Loans
B) Conventional Home Purchase Loans
C) Refinancings
D) Home Improvement Loans
F) Non-occupant Loans on < 5 Family Dwellings (A B C & D)
Number
Average Value
Number
Average Value
Number
Average Value
Number
Average Value
Number
Average Value
LOANS ORIGINATED
2
$74,975
29
$124,805
46
$108,578
19
$36,936
7
$126,740
APPLICATIONS APPROVED, NOT ACCEPTED
0
$0
1
$23,660
9
$114,454
1
$38,770
0
$0
APPLICATIONS DENIED
0
$0
3
$107,390
25
$130,411
11
$36,082
1
$89,550
APPLICATIONS WITHDRAWN
0
$0
2
$148,295
11
$133,672
4
$72,192
0
$0
FILES CLOSED FOR INCOMPLETENESS
0
$0
0
$0
4
$192,008
0
$0
0
$0
Aggregated Statistics For Year 2005 (Based on 4 partial tracts)
A) FHA, FSA/RHS & VA Home Purchase Loans
B) Conventional Home Purchase Loans
C) Refinancings
D) Home Improvement Loans
F) Non-occupant Loans on < 5 Family Dwellings (A B C & D)
G) Loans On Manufactured Home Dwelling (A B C & D)
Number
Average Value
Number
Average Value
Number
Average Value
Number
Average Value
Number
Average Value
Number
Average Value
LOANS ORIGINATED
2
$104,560
43
$109,728
53
$120,368
11
$33,825
2
$83,465
0
$0
APPLICATIONS APPROVED, NOT ACCEPTED
0
$0
2
$101,475
6
$89,528
1
$92,580
0
$0
0
$0
APPLICATIONS DENIED
0
$0
8
$69,042
34
$102,666
7
$38,344
0
$0
1
$58,560
APPLICATIONS WITHDRAWN
0
$0
4
$85,132
20
$115,195
0
$0
0
$0
0
$0
FILES CLOSED FOR INCOMPLETENESS
0
$0
3
$118,040
6
$130,200
1
$38,520
0
$0
0
$0
Aggregated Statistics For Year 2004 (Based on 4 partial tracts)
A) FHA, FSA/RHS & VA Home Purchase Loans
B) Conventional Home Purchase Loans
C) Refinancings
D) Home Improvement Loans
E) Loans on Dwellings For 5+ Families
F) Non-occupant Loans on < 5 Family Dwellings (A B C & D)
Number
Average Value
Number
Average Value
Number
Average Value
Number
Average Value
Number
Average Value
Number
Average Value
LOANS ORIGINATED
3
$143,083
31
$126,548
64
$118,427
15
$32,107
1
$190,370
6
$68,553
APPLICATIONS APPROVED, NOT ACCEPTED
0
$0
2
$76,300
12
$118,382
1
$65,210
0
$0
0
$0
APPLICATIONS DENIED
0
$0
6
$73,578
32
$107,562
6
$22,240
0
$0
1
$145,220
APPLICATIONS WITHDRAWN
0
$0
4
$107,445
10
$103,867
1
$192,700
0
$0
0
$0
FILES CLOSED FOR INCOMPLETENESS
0
$0
0
$0
8
$106,236
0
$0
0
$0
0
$0
Aggregated Statistics For Year 2003 (Based on 4 partial tracts)
A) FHA, FSA/RHS & VA Home Purchase Loans
B) Conventional Home Purchase Loans
C) Refinancings
D) Home Improvement Loans
E) Loans on Dwellings For 5+ Families
F) Non-occupant Loans on < 5 Family Dwellings (A B C & D)
Number
Average Value
Number
Average Value
Number
Average Value
Number
Average Value
Number
Average Value
Number
Average Value
LOANS ORIGINATED
4
$91,900
25
$109,216
124
$105,704
17
$19,095
1
$91,870
5
$39,586
APPLICATIONS APPROVED, NOT ACCEPTED
0
$0
2
$147,915
14
$104,486
1
$23,620
0
$0
0
$0
APPLICATIONS DENIED
1
$94,190
4
$63,992
33
$100,225
6
$15,707
0
$0
0
$0
APPLICATIONS WITHDRAWN
0
$0
3
$89,277
16
$91,114
0
$0
0
$0
0
$0
FILES CLOSED FOR INCOMPLETENESS
0
$0
0
$0
6
$123,365
0
$0
0
$0
0
$0
Aggregated Statistics For Year 1999 (Based on 2 partial tracts)
A) FHA, FSA/RHS & VA Home Purchase Loans
B) Conventional Home Purchase Loans
C) Refinancings
D) Home Improvement Loans
F) Non-occupant Loans on < 5 Family Dwellings (A B C & D)


+$5,756
-$74
 Nearest zip codes: 51559, 51570, 51548, 51563, 51576, 51560.