Estimated zip code population in 2022: 977 Zip code population in 2010: 1,039 Zip code population in 2000: 1,146
Houses and condos: 510 Renter-occupied apartments: 141
% of renters here:
30%
State:
28%
March 2022 cost of living index in zip code 51570: 83.3 (low, U.S. average is 100)
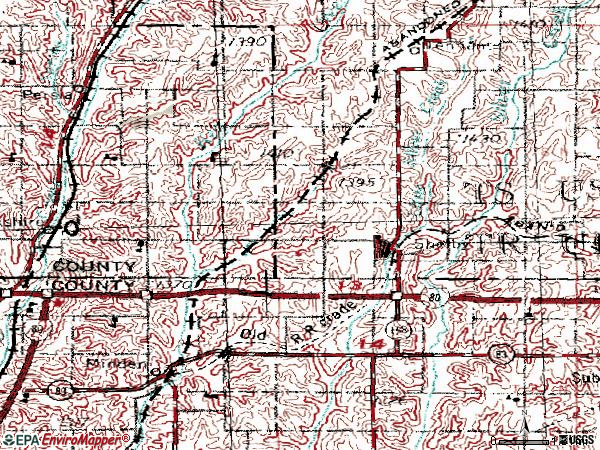
Land area: 64.3 sq. mi. Water area: 0.1 sq. mi.
Population density: 15 people per square mile
(very low).
OSM Map
General Map
Google Map
MSN Map
OSM Map
General Map
Google Map
MSN Map
OSM Map
General Map
Google Map
MSN Map
OSM Map
General Map
Google Map
MSN Map
Please wait while loading the map...
Real estate property taxes paid for housing units in 2022:
This zip code:
1.1% ($1,899)
Iowa:
1.4% ($2,724)
Median real estate property taxes paid for housing units with mortgages in 2022: $2,068 (1.0%) Median real estate property taxes paid for housing units with no mortgage in 2022: $1,493 (1.4%)
Averages for the 2020 tax year for zip code 51570, filed in 2021:
Average Adjusted Gross Income (AGI) in 2020: $59,076 (Individual Income Tax Returns)
Here:
$59,076
State:
$71,087
Salary/wage: $52,316 (reported on 81.5% of returns)
Here:
$52,316
State:
$57,361
(% of AGI for various income ranges: 1244.5% for AGIs below $25k, 3880.0% for AGIs $25k-50k, 6668.0% for AGIs $50k-75k, 9182.0% for AGIs $75k-100k, 16408.3% for AGIs $100k-200k)
Taxable interest for individuals: $1,006 (reported on 29.6% of returns)
This zip code:
$1,006
Iowa:
$1,633
(% of AGI for various income ranges: 7.3% for AGIs below $25k, 20.0% for AGIs $25k-50k, 90.0% for AGIs $50k-75k, 42.0% for AGIs $75k-100k, 111.7% for AGIs $100k-200k)
Ordinary dividends: $1,133 (reported on 16.7% of returns)
Here:
$1,133
State:
$5,432
(% of AGI for various income ranges: 26.4% for AGIs below $25k, 56.0% for AGIs $50k-75k, 75.0% for AGIs $100k-200k)
Net capital gain/loss in AGI: +$3,850 (reported on 14.8% of returns)
Here:
+$3,850
State:
+$15,243
(% of AGI for various income ranges: 280.0% for AGIs $50k-75k, 280.0% for AGIs $100k-200k)
Profit/loss from business: +$8,962 (reported on 14.8% of returns)
Here:
+$8,962
State:
+$11,763
(% of AGI for various income ranges: 484.0% for AGIs $25k-50k, 466.0% for AGIs $75k-100k)
Taxable individual retirement arrangement distribution: $12,375 (reported on 7.4% of returns)
51570:
$12,375
Iowa:
$17,324
(% of AGI for various income ranges: 104.5% for AGIs below $25k, 760.0% for AGIs $50k-75k)
Earned income credit: $2,178 (reported on 16.7% of returns)
Here:
$2,178
State:
$2,195
(% of AGI for various income ranges: 105.5% for AGIs below $25k, 80.0% for AGIs $25k-50k)
Percentage of individuals using paid preparers for their 2020 taxes: 96.3%
Here:
96%
State:
95%
(% for various income ranges: 93.8% for AGIs below $25k, 100.0% for AGIs $25k-50k, 100.0% for AGIs $50k-75k, 100.0% for AGIs $75k-100k, 90.0% for AGIs $100k-200k)
Averages for the 2012 tax year for zip code 51570, filed in 2013:
Average Adjusted Gross Income (AGI) in 2012: $55,706 (Individual Income Tax Returns)
Here:
$55,706
State:
$58,860
Salary/wage: $39,012 (reported on 85.1% of returns)
Here:
$39,012
State:
$46,659
(% of AGI for various income ranges: 78.4% for AGIs below $25k, 76.4% for AGIs $25k-50k, 68.1% for AGIs $50k-75k, 73.5% for AGIs $75k-100k, 39.2% for AGIs $100k-200k)
Taxable interest for individuals: $1,167 (reported on 38.3% of returns)
This zip code:
$1,167
Iowa:
$1,537
(% of AGI for various income ranges: 1.4% for AGIs below $25k, 0.3% for AGIs $25k-50k, 1.1% for AGIs $50k-75k, 0.9% for AGIs $75k-100k, 0.7% for AGIs $100k-200k)
Ordinary dividends: $8,378 (reported on 19.1% of returns)
Here:
$8,378
State:
$4,542
(% of AGI for various income ranges: 0.7% for AGIs $25k-50k, 0.9% for AGIs $50k-75k, 6.6% for AGIs $100k-200k)
Net capital gain/loss in AGI: +$1,983 (reported on 12.8% of returns)
Here:
+$1,983
State:
+$11,802
(% of AGI for various income ranges: 0.4% for AGIs $50k-75k, 1.0% for AGIs $100k-200k)
Profit/loss from business: +$5,933 (reported on 12.8% of returns)
Here:
+$5,933
State:
+$10,509
Taxable individual retirement arrangement distribution: $6,325 (reported on 8.5% of returns)
51570:
$6,325
Iowa:
$11,773
Total itemized deductions: $16,085 (18% of AGI, reported on 27.7% of returns)
Here:
$16,085
State:
$21,278
Here:
18.3% of AGI
State:
18.9% of AGI
(% of AGI for various income ranges: 24.6% for AGIs below $25k, 7.0% for AGIs $50k-75k, 8.5% for AGIs $75k-100k, 7.6% for AGIs $100k-200k)
Charity contributions: $2,112 (reported on 17.0% of returns)
Here:
$2,112
State:
$4,044
(% of AGI for various income ranges: 1.3% for AGIs below $25k, 1.4% for AGIs $50k-75k, 0.7% for AGIs $100k-200k)
Taxes paid: $6,200 (reported on 27.7% of returns)
51570:
$6,200
State:
$8,846
(% of AGI for various income ranges: 5.5% for AGIs below $25k, 2.2% for AGIs $50k-75k, 2.7% for AGIs $75k-100k, 4.3% for AGIs $100k-200k)
Earned income credit: $1,638 (reported on 17.0% of returns)
Here:
$1,638
State:
$2,098
(% of AGI for various income ranges: 3.7% for AGIs below $25k, 1.4% for AGIs $25k-50k)
Percentage of individuals using paid preparers for their 2012 taxes: 68.1%
Here:
68%
State:
65%
(% for various income ranges: 64.7% for AGIs below $25k, 60.0% for AGIs $25k-50k, 75.0% for AGIs $50k-75k, 66.7% for AGIs $75k-100k, 83.3% for AGIs $100k-200k)
Averages for the 2004 tax year for zip code 51570, filed in 2005:
Average Adjusted Gross Income (AGI) in 2004: $37,759 (Individual Income Tax Returns)
Here:
$37,759
State:
$43,875
Salary/wage: $34,224 (reported on 82.8% of returns)
Here:
$34,224
State:
$38,265
(% of AGI for various income ranges: 140.2% for AGIs below $10k, 66.0% for AGIs $10k-25k, 73.1% for AGIs $25k-50k, 83.8% for AGIs $50k-75k, 74.5% for AGIs $75k-100k, 58.4% for AGIs over 100k)
Taxable interest for individuals: $1,266 (reported on 49.0% of returns)
This zip code:
$1,266
Iowa:
$1,768
(% of AGI for various income ranges: 11.2% for AGIs below $10k, 3.7% for AGIs $10k-25k, 2.3% for AGIs $25k-50k, 0.8% for AGIs $50k-75k, 1.0% for AGIs $75k-100k, 0.3% for AGIs over 100k)
Taxable dividends: $886 (reported on 25.2% of returns)
Here:
$886
State:
$2,510
(% of AGI for various income ranges: 3.3% for AGIs below $10k, 3.2% for AGIs $10k-25k, 0.4% for AGIs $25k-50k, 0.2% for AGIs $50k-75k, 0.2% for AGIs $75k-100k)
Profit/loss from business: +$6,242 (reported on 14.6% of returns)
Here:
+$6,242
State:
+$8,574
Profit/loss from farming: +$5,750 (reported on 16.8% of returns)
Here:
+$5,750
State:
-$74
(% of AGI for various income ranges: 4.2% for AGIs $10k-25k, 5.3% for AGIs $25k-50k, -0.6% for AGIs $50k-75k, 4.0% for AGIs $75k-100k)
IRA payment deduction: $3,421 (reported on 4.2% of returns)
51570:
$3,421
Iowa:
$2,970
Total itemized deductions: $14,211 (25% of AGI, reported on 28.3% of returns)
Here:
$14,211
State:
$16,976
Here:
25.0% of AGI
State:
20.8% of AGI
(% of AGI for various income ranges: 13.6% for AGIs $10k-25k, 9.7% for AGIs $25k-50k, 10.0% for AGIs $50k-75k, 11.5% for AGIs $75k-100k, 11.8% for AGIs over 100k)
Charity contributions deductions: $1,486 (2% of AGI, reported on 23.2% of returns)
Here:
$1,486
State:
$3,089
Here:
2.4% of AGI
State:
3.6% of AGI
(% of AGI for various income ranges: 0.6% for AGIs $10k-25k, 1.0% for AGIs $25k-50k, 0.7% for AGIs $50k-75k, 1.4% for AGIs $75k-100k, 0.7% for AGIs over 100k)
Total tax: $4,357 (reported on 75.5% of returns)
51570:
$4,357
State:
$6,177
(% of AGI for various income ranges: 4.2% for AGIs below $10k, 5.0% for AGIs $10k-25k, 7.1% for AGIs $25k-50k, 8.1% for AGIs $50k-75k, 10.6% for AGIs $75k-100k, 15.2% for AGIs over 100k)
Earned income credit: $1,745 (reported on 10.4% of returns)
Here:
$1,745
State:
$1,540
Percentage of individuals using paid preparers for their 2004 taxes: 78.1%
Here:
78%
State:
70%
(% for various income ranges: 67.5% for AGIs below $10k, 81.8% for AGIs $10k-25k, 75.6% for AGIs $25k-50k, 87.8% for AGIs $50k-75k, 76.3% for AGIs $75k-100k, 87.5% for AGIs over 100k)
Household received Food Stamps/SNAP in the past 12 months: 51 Household did not receive Food Stamps/SNAP in the past 12 months: 426
Women who had a birth in the past 12 months: 10 (8 now married, 1 unmarried) Women who did not have a birth in the past 12 months: 269 (116 now married, 153 unmarried)
Housing units in zip code 51570 with a mortgage: 218 (3 second mortgage, 1 home equity loan, 1 both second mortgage and home equity loan) Houses without a mortgage: 9
Median monthly owner costs for units with a mortgage: $1,384 Median monthly owner costs for units without a mortgage: $512
Residents with income below the poverty level in 2022:
This zip code:
8.6%
Whole state:
11.0%
Residents with income below 50% of the poverty level in 2022:
This zip code:
4.1%
Whole state:
5.5%
Median number of rooms in houses and condos:
Here:
6.9
State:
6.8
Median number of rooms in apartments:
Here:
3.7
State:
4.2
Notable locations in this zip code not listed on our city pages
Notable locations in zip code 51570: Carstens 1880 Farmstead (A), Shelby Elevator (B), Shelby Fire and Rescue (C), Shelby City Hall (D). Display/hide their locations on the map
Churches in zip code 51570 include: First Presbyterian Church (A), Shelby United Methodist Church (B), United Lutheran Church (C). Display/hide their locations on the map
In group quarters: 10 (-1 institutionalized population)
Size of family households: 178 2-persons, 33 3-persons, 25 4-persons, 34 5-persons, 3 6-persons
Size of nonfamily households: 162 1-person, 40 2-persons, 2 3-persons
128 married couples with children.
35 single-parent households (2 men, 33 women).
97.6% of residents of 51570 zip code speak English at home.
1.5% of residents speak Spanish at home (50% very well, 14% well, 21% not well, 14% not at all).
0.6% of residents speak other Indo-European language at home (100% very well).
Foreign born population: 3 (0.3%) (34.1% of them are naturalized citizens)
This zip code:
0.3%
Whole state:
6.0%
67%Honduras
40%German
22%American
9%Irish
3%European
3%Danish
3%Polish
2%English
Year of entry for the foreign-born population
102010 or later
12000 to 2009
01990 to 1999
4Before 1990
Facilities with environmental interests located in this zip code:
A-H-S-T MIDDLE SCHOOL (304 WESTERN AVE in SHELBY, IA)
(National Center for Education Statistics) - STATE ID-780441 109 Organizations: A-H-S-T COMM SCHOOL DISTRICT (SCHOOL DISTRICT)
SHELBY SEWER TREATMENT PLANT C/O CITY HALL (419 EAST STREET in SHELBY, IA)
National Pollutant Discharge Elimination System NON-MAJOR (Tracking pollutant discharge elimination systems) - permit Business SIC classification: SEWERAGE SYSTEMS Organizations: CITY OF SHELBY (CONTACT/OWNER)
Alternative names: SHELBY CITY OF STP
DOUGS AUTO DIESEL INCORPORATED (33300 385TH STREET in SHELBY, IA)
Conditionally Exempt Small Quantity Generators, less than 100 kg/month of hazardous waste (Resource Conservation and Recovery Act (tracking hazardous waste)) Business NAICS classification: GENERAL AUTOMOTIVE REPAIR. Organizations: DOUGLASS BLUMER (CONTACT/OPERATOR)
Alternative names: SHELBY TRUCK & TRAILER
SHELBY ELECTRIC DEPARTMENT (401 SHELBY in SHELBY, IA)
COMPLIANCE ACTIVITY (Tracking inspections of insecticide, fungicide, and rodenticide, and toxic substances) Business SIC classification: ELECTRIC SERVICES
Housing units lacking complete plumbing facilities: 0.5% Housing units lacking complete kitchen facilities: 2.0%
55.9%Utility gas
27.2%Electricity
15.5%Bottled, tank, or LP gas
1.7%Other fuel
Population in 1990: 941. Population change in the 1990s: +205 (+21.8%).
Place of birth for U.S.-born residents:
This state: 559
Midwest: 315
South: 46
West: 32
66% of the 51570 zip code residents lived in the same house 5 years ago. Out of people who lived in different houses, 37% lived in this county. Out of people who lived in different counties, 50% lived in Iowa.
89% of the 51570 zip code residents lived in the same house 1 year ago. Out of people who lived in different houses, 28% moved from this county. Out of people who lived in different houses, 9% moved from different county within same state. Out of people who lived in different houses, 59% moved from different state. Out of people who lived in different houses, 3% moved from abroad.
Private vs. public school enrollment:
Students in private schools in grades 1 to 8 (elementary and middle school):
Here:
0.0%
Iowa:
10.6%
Students in private schools in grades 9 to 12 (high school):
Here:
0.0%
Iowa:
7.9%
Students in private undergraduate colleges:
Here:
0.0%
Iowa:
23.9%
Occupation by median earnings in the past 12 months ($)
100,507Computer and mathematical occupations
80,431Construction and extraction occupations
80,288Architecture and engineering occupations
68,326Installation, maintenance, and repair occupations
60,208Transportation occupations
54,479Production occupations
Top industries in this zip code by the number of employees in 2005:
Health Care and Social Assistance: Residential Mental Retardation Facilities (10-19 employees: 2 establishments, 5-9 employees: 1 establishment)
Professional, Scientific, and Technical Services: Veterinary Services (10-19: 1)
Accommodation and Food Services: Full-Service Restaurants (10-19: 1)
Accommodation and Food Services: Hotels (except Casino Hotels) and Motels (5-9: 1)
Other Services (except Public Administration): Religious Organizations (5-9: 1)
Finance and Insurance: Commercial Banking (5-9: 1)
Other Services (except Public Administration): General Automotive Repair (1-4: 1)
Accommodation and Food Services: Limited-Service Restaurants (1-4: 1)
People in group quarters in 2010:
16 people in group homes intended for adults
People in group quarters in 2000:
54 people in other group homes
Fatal accident statistics in 2011:
Fatal accident count: 2
Vehicles involved in fatal accidents: 2
Fatal accidents caused by drunken drivers: 0
Fatalities: 2
Persons involved in fatal accidents: 2
Pedestrians involved in fatal accidents: 2
Home Mortgage Disclosure Act Aggregated Statistics For Year 2009 (Based on 2 partial tracts)
A) FHA, FSA/RHS & VA Home Purchase Loans
B) Conventional Home Purchase Loans
C) Refinancings
D) Home Improvement Loans
F) Non-occupant Loans on < 5 Family Dwellings (A B C & D)
Number
Average Value
Number
Average Value
Number
Average Value
Number
Average Value
Number
Average Value
LOANS ORIGINATED
2
$92,950
3
$110,367
14
$133,212
2
$49,020
1
$83,150
APPLICATIONS APPROVED, NOT ACCEPTED
0
$0
0
$0
1
$120,630
0
$0
0
$0
APPLICATIONS DENIED
0
$0
0
$0
6
$141,805
0
$0
0
$0
APPLICATIONS WITHDRAWN
0
$0
0
$0
1
$87,860
0
$0
0
$0
FILES CLOSED FOR INCOMPLETENESS
0
$0
0
$0
0
$0
0
$0
0
$0
Aggregated Statistics For Year 2008 (Based on 2 partial tracts)
A) FHA, FSA/RHS & VA Home Purchase Loans
B) Conventional Home Purchase Loans
C) Refinancings
D) Home Improvement Loans
F) Non-occupant Loans on < 5 Family Dwellings (A B C & D)
Number
Average Value
Number
Average Value
Number
Average Value
Number
Average Value
Number
Average Value
LOANS ORIGINATED
1
$200,790
6
$88,400
10
$114,569
4
$21,718
4
$62,360
APPLICATIONS APPROVED, NOT ACCEPTED
0
$0
0
$0
1
$59,320
0
$0
0
$0
APPLICATIONS DENIED
0
$0
0
$0
5
$106,032
1
$6,450
0
$0
APPLICATIONS WITHDRAWN
0
$0
0
$0
2
$115,910
0
$0
0
$0
FILES CLOSED FOR INCOMPLETENESS
0
$0
0
$0
0
$0
0
$0
0
$0
Aggregated Statistics For Year 2007 (Based on 2 partial tracts)
A) FHA, FSA/RHS & VA Home Purchase Loans
B) Conventional Home Purchase Loans
C) Refinancings
D) Home Improvement Loans
F) Non-occupant Loans on < 5 Family Dwellings (A B C & D)
Number
Average Value
Number
Average Value
Number
Average Value
Number
Average Value
Number
Average Value
LOANS ORIGINATED
1
$160,830
6
$99,735
9
$114,007
4
$28,295
1
$53,860
APPLICATIONS APPROVED, NOT ACCEPTED
0
$0
1
$125,840
2
$117,895
0
$0
0
$0
APPLICATIONS DENIED
0
$0
2
$78,185
5
$132,240
1
$75,450
0
$0
APPLICATIONS WITHDRAWN
0
$0
1
$97,290
3
$119,467
0
$0
0
$0
FILES CLOSED FOR INCOMPLETENESS
0
$0
0
$0
1
$110,700
0
$0
0
$0
Aggregated Statistics For Year 2006 (Based on 2 partial tracts)
A) FHA, FSA/RHS & VA Home Purchase Loans
B) Conventional Home Purchase Loans
C) Refinancings
D) Home Improvement Loans
F) Non-occupant Loans on < 5 Family Dwellings (A B C & D)
Number
Average Value
Number
Average Value
Number
Average Value
Number
Average Value
Number
Average Value
LOANS ORIGINATED
1
$54,110
7
$106,407
11
$95,309
6
$32,390
2
$86,250
APPLICATIONS APPROVED, NOT ACCEPTED
0
$0
0
$0
3
$108,133
0
$0
0
$0
APPLICATIONS DENIED
0
$0
1
$82,400
8
$115,071
4
$25,255
1
$47,900
APPLICATIONS WITHDRAWN
0
$0
0
$0
3
$166,707
2
$75,455
0
$0
FILES CLOSED FOR INCOMPLETENESS
0
$0
0
$0
0
$0
0
$0
0
$0
Aggregated Statistics For Year 2005 (Based on 2 partial tracts)
B) Conventional Home Purchase Loans
C) Refinancings
D) Home Improvement Loans
F) Non-occupant Loans on < 5 Family Dwellings (A B C & D)
Number
Average Value
Number
Average Value
Number
Average Value
Number
Average Value
LOANS ORIGINATED
12
$100,935
13
$112,588
5
$31,026
1
$39,460
APPLICATIONS APPROVED, NOT ACCEPTED
1
$62,050
2
$59,195
0
$0
0
$0
APPLICATIONS DENIED
2
$51,625
9
$92,882
2
$48,770
0
$0
APPLICATIONS WITHDRAWN
1
$46,660
5
$114,024
0
$0
0
$0
FILES CLOSED FOR INCOMPLETENESS
0
$0
1
$108,220
0
$0
0
$0
Aggregated Statistics For Year 2004 (Based on 2 partial tracts)
A) FHA, FSA/RHS & VA Home Purchase Loans
B) Conventional Home Purchase Loans
C) Refinancings
D) Home Improvement Loans
F) Non-occupant Loans on < 5 Family Dwellings (A B C & D)
Number
Average Value
Number
Average Value
Number
Average Value
Number
Average Value
Number
Average Value
LOANS ORIGINATED
1
$111,440
7
$88,289
17
$100,930
4
$35,990
2
$65,400
APPLICATIONS APPROVED, NOT ACCEPTED
0
$0
0
$0
3
$110,450
0
$0
0
$0
APPLICATIONS DENIED
0
$0
2
$68,005
9
$89,490
2
$21,095
0
$0
APPLICATIONS WITHDRAWN
0
$0
0
$0
3
$119,550
0
$0
0
$0
FILES CLOSED FOR INCOMPLETENESS
0
$0
0
$0
2
$134,650
0
$0
0
$0
Aggregated Statistics For Year 2003 (Based on 2 partial tracts)
A) FHA, FSA/RHS & VA Home Purchase Loans
B) Conventional Home Purchase Loans
C) Refinancings
D) Home Improvement Loans
E) Loans on Dwellings For 5+ Families
F) Non-occupant Loans on < 5 Family Dwellings (A B C & D)
Number
Average Value
Number
Average Value
Number
Average Value
Number
Average Value
Number
Average Value
Number
Average Value
LOANS ORIGINATED
2
$85,505
6
$89,145
29
$95,968
3
$21,180
1
$49,140
1
$49,640
APPLICATIONS APPROVED, NOT ACCEPTED
0
$0
0
$0
4
$106,042
0
$0
0
$0
0
$0
APPLICATIONS DENIED
0
$0
1
$54,110
8
$97,729
2
$17,375
0
$0
0
$0
APPLICATIONS WITHDRAWN
0
$0
1
$41,950
3
$79,753
0
$0
0
$0
0
$0
FILES CLOSED FOR INCOMPLETENESS
0
$0
0
$0
2
$106,850
0
$0
0
$0
0
$0
Aggregated Statistics For Year 1999 (Based on 1 partial tract)
A) FHA, FSA/RHS & VA Home Purchase Loans
B) Conventional Home Purchase Loans
C) Refinancings
D) Home Improvement Loans
F) Non-occupant Loans on < 5 Family Dwellings (A B C & D)


+$5,750
-$74
(% of AGI for various income ranges: 4.2% for AGIs $10k-25k, 5.3% for AGIs $25k-50k, -0.6% for AGIs $50k-75k, 4.0% for AGIs $75k-100k)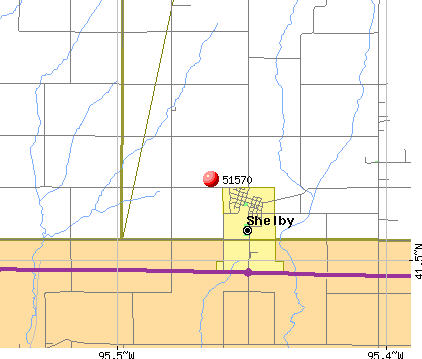 Nearest zip codes: 51521, 51563, 51565, 51553, 51536, 51559.