Estimated zip code population in 2022: 7,263 Zip code population in 2010: 6,168 Zip code population in 2000: 6,090
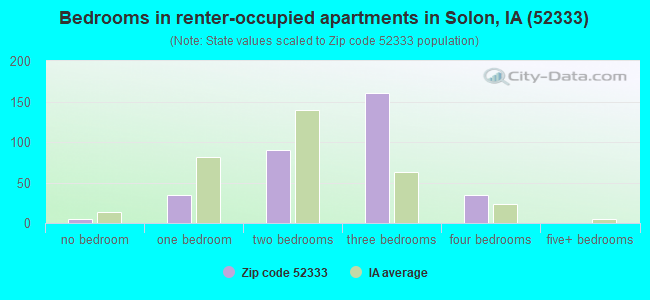
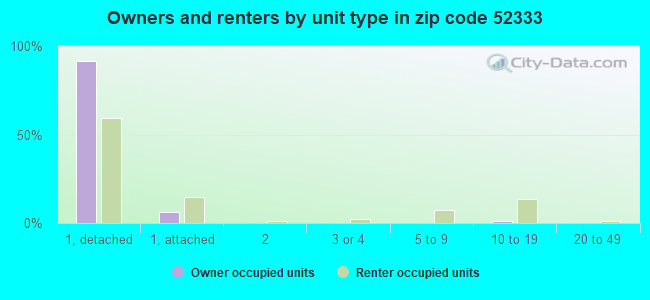
Houses and condos: 2,897 Renter-occupied apartments: 330
% of renters here:
12%
State:
28%
March 2022 cost of living index in zip code 52333: 85.2 (less than average, U.S. average is 100)
Land area: 86.2 sq. mi. Water area: 4.3 sq. mi.
Population density: 84 people per square mile
(very low).
OSM Map
General Map
Google Map
MSN Map
OSM Map
General Map
Google Map
MSN Map
OSM Map
General Map
Google Map
MSN Map
OSM Map
General Map
Google Map
MSN Map
Please wait while loading the map...
Real estate property taxes paid for housing units in 2022:
This zip code:
1.3% ($4,598)
Iowa:
1.4% ($2,724)
Median real estate property taxes paid for housing units with mortgages in 2022: $4,867 (1.3%) Median real estate property taxes paid for housing units with no mortgage in 2022: $4,010 (1.2%)
Business Search- 14 Million verified businesses
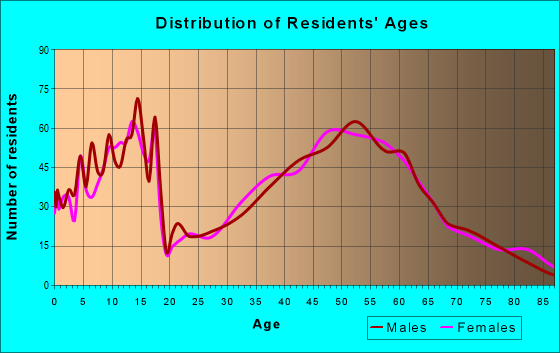
Males: 3,397
(46.8%)
Females: 3,865
(53.2%)
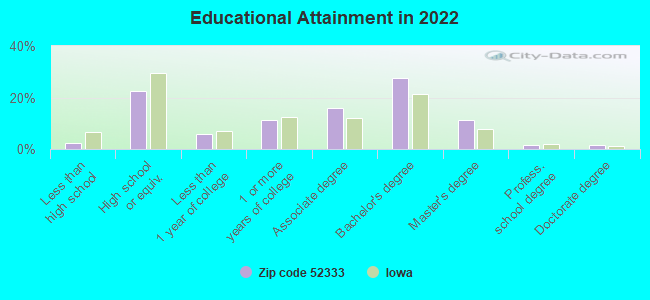
For population 25 years and over in 52333:
High school or higher: 99.2%
Bachelor's degree or higher: 42.5%
Graduate or professional degree: 14.6%
Unemployed: 2.6%
Mean travel time to work (commute): 23.0 minutes
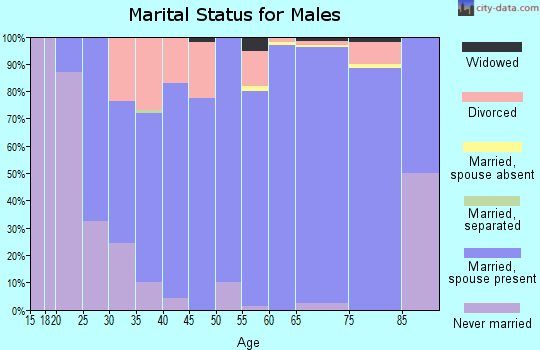
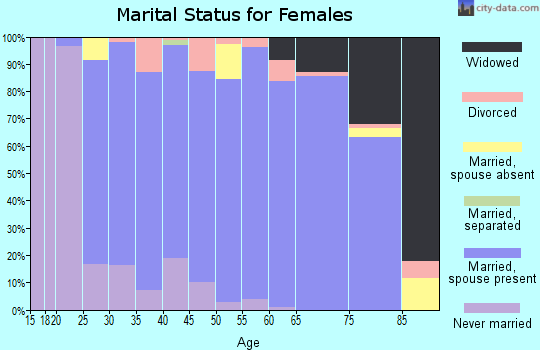
For population 15 years and over in 52333:
Never married: 23.7%
Now married: 62.9%
Separated: 0.8%
Widowed: 4.4%
Divorced: 8.2%
Zip code 52333 compared to state average:
Median household income above state average.
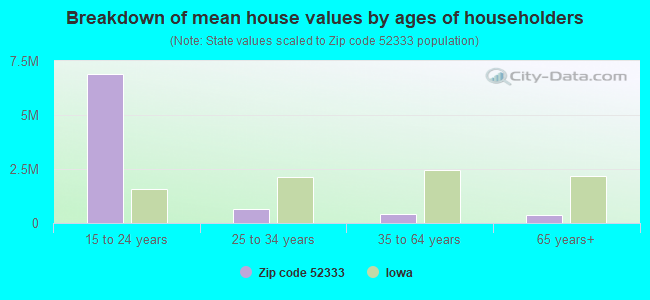
Median house value above state average.
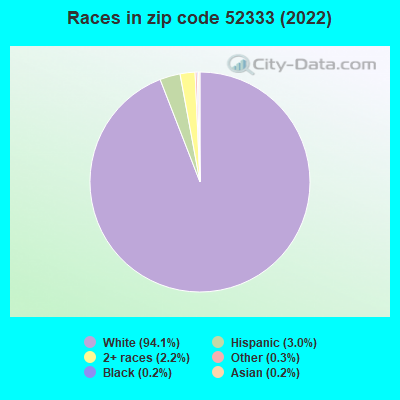
Black race population percentage significantly below state average.
Hispanic race population percentage below state average.
Median age above state average.
Foreign-born population percentage significantly below state average.
Renting percentage significantly below state average.
Length of stay since moving in significantly above state average.
Estimated median house/condo value in 2022: $356,731
52333:
$356,731
Iowa:
$194,600
According to our research of Iowa and other state lists, there was 1 registered sex offender living in 52333 zip code as of May 17, 2024. The ratio of all residents to sex offenders in zip code 52333 is 6,724 to 1. The ratio of registered sex offenders to all residents in this zip code is much lower than the state average.
Median resident age:
This zip code:
46.1 years
Iowa median age:
38.9 years
Average household size:
This zip code:
2.6 people
Iowa:
2.3 people
Averages for the 2020 tax year for zip code 52333, filed in 2021:
Average Adjusted Gross Income (AGI) in 2020: $126,066 (Individual Income Tax Returns)
Here:
$126,066
State:
$71,087
Salary/wage: $86,904 (reported on 82.8% of returns)
Here:
$86,904
State:
$57,361
(% of AGI for various income ranges: 1220.7% for AGIs below $25k, 3362.5% for AGIs $25k-50k, 5639.4% for AGIs $50k-75k, 8460.7% for AGIs $75k-100k, 17888.4% for AGIs $100k-200k, 67480.8% for AGIs over 200k)
Taxable interest for individuals: $1,951 (reported on 57.0% of returns)
This zip code:
$1,951
Iowa:
$1,633
(% of AGI for various income ranges: 48.4% for AGIs below $25k, 61.0% for AGIs $25k-50k, 95.8% for AGIs $50k-75k, 103.7% for AGIs $75k-100k, 161.9% for AGIs $100k-200k, 1533.3% for AGIs over 200k)
Ordinary dividends: $6,636 (reported on 35.0% of returns)
Here:
$6,636
State:
$5,432
(% of AGI for various income ranges: 72.9% for AGIs below $25k, 65.8% for AGIs $25k-50k, 157.7% for AGIs $50k-75k, 250.4% for AGIs $75k-100k, 331.9% for AGIs $100k-200k, 3568.3% for AGIs over 200k)
Net capital gain/loss in AGI: +$22,756 (reported on 30.1% of returns)
Here:
+$22,756
State:
+$15,243
(% of AGI for various income ranges: 25.8% for AGIs below $25k, 101.2% for AGIs $25k-50k, 159.7% for AGIs $50k-75k, 356.7% for AGIs $75k-100k, 630.8% for AGIs $100k-200k, 15003.3% for AGIs over 200k)
Profit/loss from business: +$21,047 (reported on 15.8% of returns)
Here:
+$21,047
State:
+$11,763
(% of AGI for various income ranges: 84.7% for AGIs below $25k, 124.2% for AGIs $25k-50k, 236.8% for AGIs $50k-75k, 271.1% for AGIs $75k-100k, 570.0% for AGIs $100k-200k, 4748.3% for AGIs over 200k)
Taxable individual retirement arrangement distribution: $25,093 (reported on 12.9% of returns)
52333:
$25,093
Iowa:
$17,324
(% of AGI for various income ranges: 73.3% for AGIs below $25k, 188.0% for AGIs $25k-50k, 277.7% for AGIs $50k-75k, 712.2% for AGIs $75k-100k, 873.5% for AGIs $100k-200k, 1675.0% for AGIs over 200k)
Self-employed (Keogh) retirement plans: $21,780 (reported on 1.4% of returns)
52333:
$21,780
Iowa:
$22,144
(% of AGI for various income ranges: 74.4% for AGIs below $25k, 628.3% for AGIs over 200k)
Total itemized deductions: $36,960 (reported on 14.3% of returns)
Here:
$36,960
State:
$33,775
(% of AGI for various income ranges: 293.0% for AGIs $25k-50k, 539.7% for AGIs $50k-75k, 641.5% for AGIs $75k-100k, 906.9% for AGIs $100k-200k, 6900.0% for AGIs over 200k)
Charity contributions: $16,512 (reported on 9.7% of returns)
Here:
$16,512
State:
$13,075
(% of AGI for various income ranges: 32.6% for AGIs $50k-75k, 91.1% for AGIs $75k-100k, 172.1% for AGIs $100k-200k, 3500.0% for AGIs over 200k)
Taxes paid: $8,663 (reported on 12.3% of returns)
52333:
$8,663
State:
$7,704
(% of AGI for various income ranges: 30.7% for AGIs below $25k, 122.9% for AGIs $50k-75k, 153.7% for AGIs $75k-100k, 218.9% for AGIs $100k-200k, 1195.0% for AGIs over 200k)
Earned income credit: $1,653 (reported on 4.3% of returns)
Here:
$1,653
State:
$2,195
(% of AGI for various income ranges: 30.7% for AGIs below $25k, 27.5% for AGIs $25k-50k)
Percentage of individuals using paid preparers for their 2020 taxes: 94.8%
Here:
95%
State:
95%
(% for various income ranges: 91.4% for AGIs below $25k, 94.3% for AGIs $25k-50k, 95.3% for AGIs $50k-75k, 95.0% for AGIs $75k-100k, 96.2% for AGIs $100k-200k, 97.3% for AGIs over 200k)
Averages for the 2012 tax year for zip code 52333, filed in 2013:
Average Adjusted Gross Income (AGI) in 2012: $96,245 (Individual Income Tax Returns)
Here:
$96,245
State:
$58,860
Salary/wage: $70,043 (reported on 85.2% of returns)
Here:
$70,043
State:
$46,659
(% of AGI for various income ranges: 76.0% for AGIs below $25k, 72.6% for AGIs $25k-50k, 71.2% for AGIs $50k-75k, 76.1% for AGIs $75k-100k, 78.3% for AGIs $100k-200k, 37.9% for AGIs over 200k)
Taxable interest for individuals: $1,784 (reported on 60.0% of returns)
This zip code:
$1,784
Iowa:
$1,537
(% of AGI for various income ranges: 3.5% for AGIs below $25k, 1.5% for AGIs $25k-50k, 1.6% for AGIs $50k-75k, 1.3% for AGIs $75k-100k, 0.8% for AGIs $100k-200k, 1.0% for AGIs over 200k)
Ordinary dividends: $9,427 (reported on 36.1% of returns)
Here:
$9,427
State:
$4,542
(% of AGI for various income ranges: 2.2% for AGIs below $25k, 1.8% for AGIs $25k-50k, 1.4% for AGIs $50k-75k, 1.3% for AGIs $75k-100k, 1.2% for AGIs $100k-200k, 7.3% for AGIs over 200k)
Net capital gain/loss in AGI: +$22,866 (reported on 26.2% of returns)
Here:
+$22,866
State:
+$11,802
(% of AGI for various income ranges: 0.8% for AGIs $25k-50k, 1.0% for AGIs $50k-75k, 0.8% for AGIs $75k-100k, 1.4% for AGIs $100k-200k, 15.0% for AGIs over 200k)
Profit/loss from business: +$19,706 (reported on 16.4% of returns)
Here:
+$19,706
State:
+$10,509
(% of AGI for various income ranges: 5.3% for AGIs below $25k, 4.6% for AGIs $25k-50k, 1.7% for AGIs $50k-75k, 2.6% for AGIs $75k-100k, 2.9% for AGIs $100k-200k, 4.0% for AGIs over 200k)
Taxable individual retirement arrangement distribution: $17,249 (reported on 13.4% of returns)
52333:
$17,249
Iowa:
$11,773
(% of AGI for various income ranges: 2.7% for AGIs below $25k, 3.1% for AGIs $25k-50k, 3.5% for AGIs $50k-75k, 3.1% for AGIs $75k-100k, 2.7% for AGIs $100k-200k, 1.5% for AGIs over 200k)
Self-employment retirement plans: $19,360 (reported on 1.6% of returns)
52333:
$19,360
Iowa:
$18,614
Total itemized deductions: $24,864 (17% of AGI, reported on 53.4% of returns)
Here:
$24,864
State:
$21,278
Here:
16.8% of AGI
State:
18.9% of AGI
(% of AGI for various income ranges: 15.1% for AGIs below $25k, 15.4% for AGIs $25k-50k, 14.6% for AGIs $50k-75k, 15.3% for AGIs $75k-100k, 15.9% for AGIs $100k-200k, 10.9% for AGIs over 200k)
Charity contributions: $3,767 (reported on 44.6% of returns)
Here:
$3,767
State:
$4,044
(% of AGI for various income ranges: 0.7% for AGIs below $25k, 0.9% for AGIs $25k-50k, 1.2% for AGIs $50k-75k, 1.4% for AGIs $75k-100k, 1.8% for AGIs $100k-200k, 2.2% for AGIs over 200k)
Taxes paid: $11,932 (reported on 53.4% of returns)
52333:
$11,932
State:
$8,846
(% of AGI for various income ranges: 2.8% for AGIs below $25k, 4.4% for AGIs $25k-50k, 5.8% for AGIs $50k-75k, 6.3% for AGIs $75k-100k, 7.9% for AGIs $100k-200k, 6.6% for AGIs over 200k)
Earned income credit: $1,440 (reported on 4.9% of returns)
Here:
$1,440
State:
$2,098
(% of AGI for various income ranges: 1.5% for AGIs below $25k, 0.5% for AGIs $25k-50k)
Percentage of individuals using paid preparers for their 2012 taxes: 61.3%
Here:
61%
State:
65%
(% for various income ranges: 49.4% for AGIs below $25k, 60.0% for AGIs $25k-50k, 67.4% for AGIs $50k-75k, 63.6% for AGIs $75k-100k, 64.8% for AGIs $100k-200k, 80.0% for AGIs over 200k)
Averages for the 2004 tax year for zip code 52333, filed in 2005:
Average Adjusted Gross Income (AGI) in 2004: $65,009 (Individual Income Tax Returns)
Here:
$65,009
State:
$43,875
Salary/wage: $55,823 (reported on 86.1% of returns)
Here:
$55,823
State:
$38,265
(% of AGI for various income ranges: 110.4% for AGIs below $10k, 67.5% for AGIs $10k-25k, 78.0% for AGIs $25k-50k, 81.5% for AGIs $50k-75k, 84.0% for AGIs $75k-100k, 66.0% for AGIs over 100k)
Taxable interest for individuals: $1,483 (reported on 64.1% of returns)
This zip code:
$1,483
Iowa:
$1,768
(% of AGI for various income ranges: 11.4% for AGIs below $10k, 5.6% for AGIs $10k-25k, 2.2% for AGIs $25k-50k, 1.2% for AGIs $50k-75k, 0.7% for AGIs $75k-100k, 1.2% for AGIs over 100k)
Taxable dividends: $2,185 (reported on 40.0% of returns)
Here:
$2,185
State:
$2,510
(% of AGI for various income ranges: 3.3% for AGIs below $10k, 2.6% for AGIs $10k-25k, 0.8% for AGIs $25k-50k, 1.0% for AGIs $50k-75k, 0.9% for AGIs $75k-100k, 1.6% for AGIs over 100k)
Net capital gain/loss: +$7,887 (reported on 31.8% of returns)
Here:
+$7,887
State:
+$6,139
(% of AGI for various income ranges: -1.9% for AGIs below $10k, 1.3% for AGIs $10k-25k, 1.0% for AGIs $25k-50k, 0.8% for AGIs $50k-75k, 0.5% for AGIs $75k-100k, 7.2% for AGIs over 100k)
Profit/loss from business: +$12,687 (reported on 16.3% of returns)
Here:
+$12,687
State:
+$8,574
(% of AGI for various income ranges: -5.3% for AGIs below $10k, 4.8% for AGIs $10k-25k, 3.3% for AGIs $25k-50k, 3.0% for AGIs $50k-75k, 2.9% for AGIs $75k-100k, 3.4% for AGIs over 100k)
IRA payment deduction: $3,244 (reported on 2.9% of returns)
52333:
$3,244
Iowa:
$2,970
Self-employed pension: $14,211 (reported on 1.4% of returns)
Here:
$14,211
Iowa:
$11,928
Total itemized deductions: $19,816 (20% of AGI, reported on 53.2% of returns)
Here:
$19,816
State:
$16,976
Here:
20.2% of AGI
State:
20.8% of AGI
(% of AGI for various income ranges: 14.3% for AGIs below $10k, 16.1% for AGIs $10k-25k, 14.9% for AGIs $25k-50k, 16.7% for AGIs $50k-75k, 17.4% for AGIs $75k-100k, 15.9% for AGIs over 100k)
Charity contributions deductions: $2,679 (3% of AGI, reported on 47.5% of returns)
Here:
$2,679
State:
$3,089
Here:
2.7% of AGI
State:
3.6% of AGI
(% of AGI for various income ranges: 0.7% for AGIs below $10k, 1.7% for AGIs $10k-25k, 1.3% for AGIs $25k-50k, 1.7% for AGIs $50k-75k, 1.7% for AGIs $75k-100k, 2.3% for AGIs over 100k)
Total tax: $9,588 (reported on 83.7% of returns)
52333:
$9,588
State:
$6,177
(% of AGI for various income ranges: 3.6% for AGIs below $10k, 5.0% for AGIs $10k-25k, 7.3% for AGIs $25k-50k, 7.9% for AGIs $50k-75k, 9.5% for AGIs $75k-100k, 17.0% for AGIs over 100k)
Earned income credit: $1,250 (reported on 4.7% of returns)
Here:
$1,250
State:
$1,540
Percentage of individuals using paid preparers for their 2004 taxes: 64.2%
Here:
64%
State:
70%
(% for various income ranges: 53.4% for AGIs below $10k, 61.9% for AGIs $10k-25k, 65.1% for AGIs $25k-50k, 68.4% for AGIs $50k-75k, 68.3% for AGIs $75k-100k, 67.5% for AGIs over 100k)
Household received Food Stamps/SNAP in the past 12 months: 117 Household did not receive Food Stamps/SNAP in the past 12 months: 2,683
Women who had a birth in the past 12 months: 15 (15 now married, 0 unmarried) Women who did not have a birth in the past 12 months: 1,633 (709 now married, 924 unmarried)
Housing units in zip code 52333 with a mortgage: 1,644 (351 second mortgage, 15 home equity loan, 285 both second mortgage and home equity loan) Median monthly owner costs for units with a mortgage: $1,944 Median monthly owner costs for units without a mortgage: $662
Residents with income below the poverty level in 2022:
This zip code:
2.9%
Whole state:
11.0%
Residents with income below 50% of the poverty level in 2022:
This zip code:
0.5%
Whole state:
5.5%
Median number of rooms in houses and condos:
Here:
7.2
State:
6.8
Median number of rooms in apartments:
Here:
5.8
State:
4.2
Notable locations in this zip code not listed on our city pages
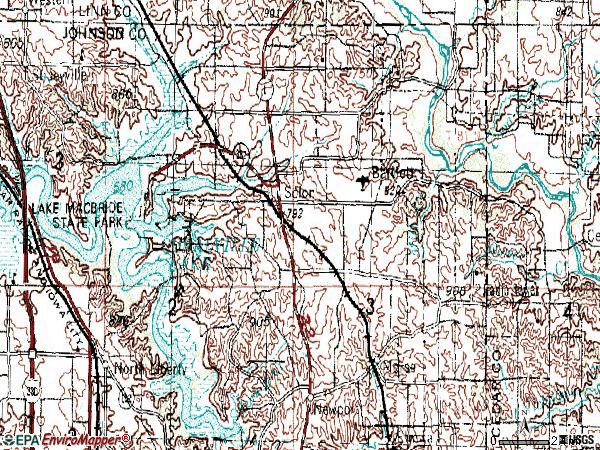
Notable locations in zip code 52333: Sandy Beach Campground (A), Sugar Bottom Campground (B), Lake MacBride Golf Course (C), Solon City Hall (D), Solon Public Library (E), Solon Volunteer Fire Department (F). Display/hide their locations on the map
Churches in zip code 52333 include: Solon United Methodist Church (A), Saint Bridget Church (B), Saint Marys Church (C), Saints Peter and Paul Church (D). Display/hide their locations on the map
Cemeteries: Oakland Cemetery (1), Sutiff Cemetery (2), Evergreen Cemetery (3), Saint Bridgets Cemetery (4), Sulek Cemetery (5), Saint Marys Cemetery (6), Saint Peter and Pauls Catholic Cemetery (7). Display/hide their locations on the map
Parks in zip code 52333 include: Sandy Beach Public Use Area (1), Sugar Bottoms Public Use Area (2), Lake Macbride State Park (3). Display/hide their locations on the map
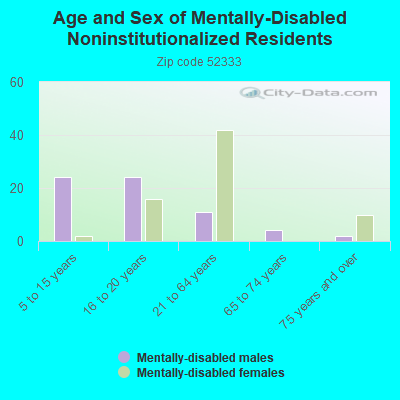
In group quarters: 84 (-1 institutionalized population)
Size of family households: 1,025 2-persons, 388 3-persons, 464 4-persons, 152 5-persons, 24 6-persons, 12 7-or-more-persons
Size of nonfamily households: 591 1-person, 65 2-persons, 38 3-persons
1,155 married couples with children.
287 single-parent households (111 men, 176 women).
95.6% of residents of 52333 zip code speak English at home.
3.7% of residents speak Spanish at home (95% very well, 1% well, 2% not well, 2% not at all).
0.9% of residents speak other Indo-European language at home (70% very well, 30% not well).
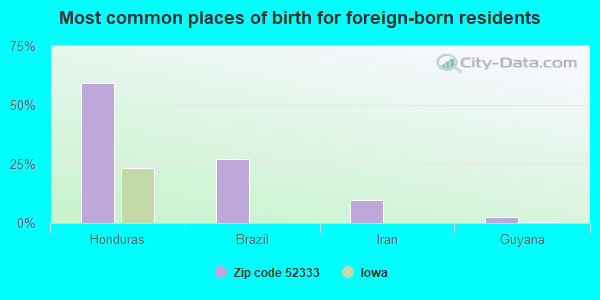
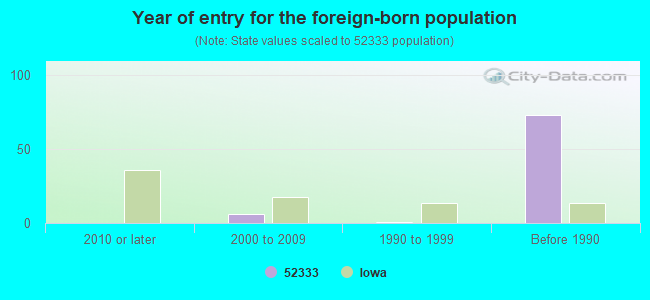
Foreign born population: 87 (1.2%) (100.0% of them are naturalized citizens)
This zip code:
1.2%
Whole state:
6.0%
59%Honduras
27%Brazil
10%Iran
2%Guyana
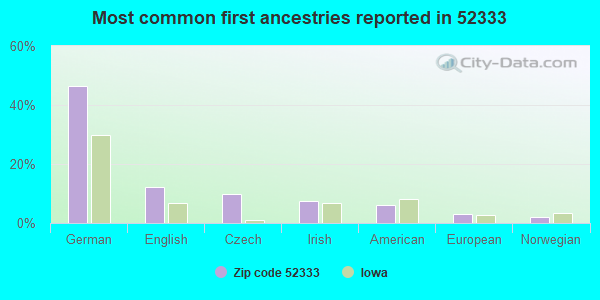
46%German
12%English
10%Czech
7%Irish
6%American
3%European
2%Norwegian
Year of entry for the foreign-born population
02010 or later
62000 to 2009
11990 to 1999
73Before 1990
Facilities with environmental interests located in this zip code:
SOLON HIGH SCHOOL (600 W. 5TH STREET in SOLON, IA)
(National Center for Education Statistics) - STATE ID-526093 172 Conditionally Exempt Small Quantity Generators, less than 100 kg/month of hazardous waste (Resource Conservation and Recovery Act (tracking hazardous waste)) Organizations: SOLON COMMUNITY SCHOOL DISTRICT (CONTACT/OPERATOR)
, SOLON COMM SCHOOL DISTRICT (SCHOOL DISTRICT)
SOLON MIDDLE SCHOOL (313 SOUTH IOWA STREET in SOLON, IA)
(National Center for Education Statistics) - STATE ID-526093 209 Organizations: SOLON COMM SCHOOL DISTRICT (SCHOOL DISTRICT)
COTTAGE RESERVE CORPORATION (3779 COTTAGE RESERVE ROAD NE in SOLON, IA)
National Pollutant Discharge Elimination System NON-MAJOR (Tracking pollutant discharge elimination systems) - permit Business SIC classification: REAL ESTATE AGENTS AND MANAGERS
SOLON CITY OF STP (CITY CLERK in SOLON, IA)
National Pollutant Discharge Elimination System NON-MAJOR (Tracking pollutant discharge elimination systems) - permit Business SIC classification: SEWERAGE SYSTEMS Organizations: CITY OF SOLON (CONTACT/OWNER)
Alternative names: SALON CITY OF WWTP
SOLON COMM SCHOOLS (403 S IOWA ST in SOLON, IA)
COMPLIANCE ACTIVITY (Tracking inspections of insecticide, fungicide, and rodenticide, and toxic substances) Alternative names: SOLON COMM SCHOOL DIST, SOLON CSD
AMOCO FERTILIZER PLANT-FORMER SITE OF (W OF RTE 1 S EDGE OF TWN in SOLON, IA)
(Resource Conservation and Recovery Act (tracking hazardous waste))
AT&T (RR in SOLON, IA)
(Resource Conservation and Recovery Act (tracking hazardous waste))
SOLON FEED MILL INC (310 S DUBUQUE ST in SOLON, IA)
AIR MINOR (AIRS/AFS) Business SIC classification: PREPARED FEEDS AND FEED INGREDIENTS FOR ANIMALS AND FOWLS, EXCEPT DOGS AND CATS
Housing units lacking complete plumbing facilities: 0.5%
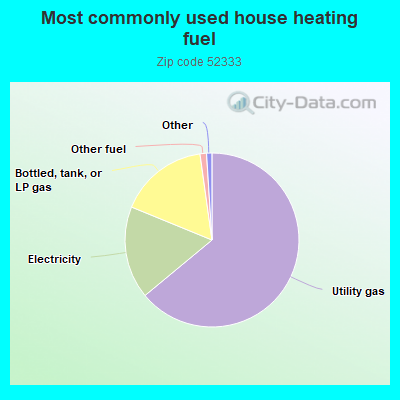
64.0%Utility gas
17.2%Electricity
16.6%Bottled, tank, or LP gas
1.2%Other fuel
Population in 1990: 2,894. Population change in the 1990s: +3,196 (+110.4%).
Place of birth for U.S.-born residents:
This state: 5,999
Northeast: 88
Midwest: 821
South: 154
West: 99
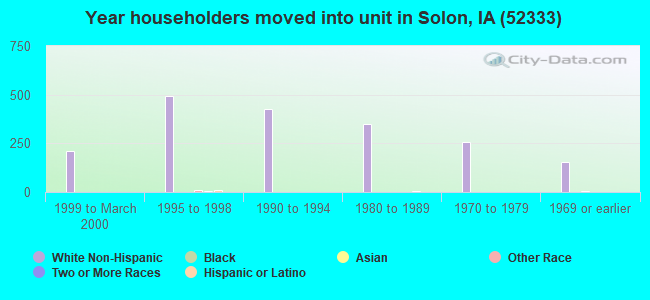
55% of the 52333 zip code residents lived in the same house 5 years ago. Out of people who lived in different houses, 39% lived in this county. Out of people who lived in different counties, 50% lived in Iowa.
96% of the 52333 zip code residents lived in the same house 1 year ago. Out of people who lived in different houses, 49% moved from this county. Out of people who lived in different houses, 47% moved from different county within same state. Out of people who lived in different houses, 5% moved from different state. Out of people who lived in different houses, 7% moved from abroad.
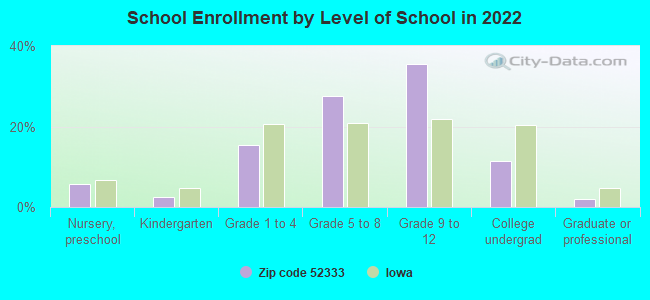
Private vs. public school enrollment:
Students in private schools in grades 1 to 8 (elementary and middle school): 51
Here:
6.6%
Iowa:
10.6%
Students in private schools in grades 9 to 12 (high school):
Here:
0.0%
Iowa:
7.9%
Students in private undergraduate colleges: 42
Here:
19.8%
Iowa:
23.9%
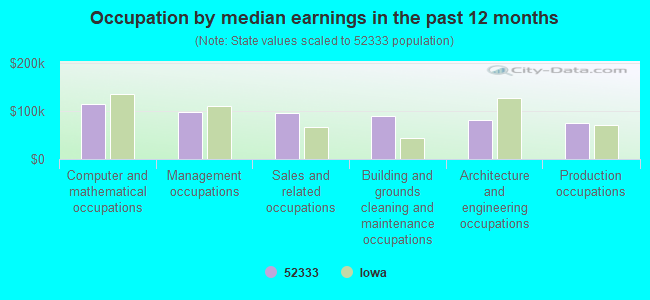
Occupation by median earnings in the past 12 months ($)
114,041Computer and mathematical occupations
97,935Management occupations
94,889Sales and related occupations
88,740Building and grounds cleaning and maintenance occupations
81,787Architecture and engineering occupations
74,492Production occupations
Companies with federal contracts located in this zip code:
RUZICKA'S MEAT PROCESSING INC (301 N DUBUQUE ST in SOLON, IA; small business) : $10,330 in 4 contractsfrom 2004 to 2005
$3,740 with Army for Food Services. Signed on 2005-06-01. Completion date: 2005-06-18.
$3,360, same as above.Signed on 2005-01-19. Completion date: 2005-01-19.
$2,736, same as above.Signed on 2004-02-26. Completion date: 2004-02-25.
$494, same as above.Signed on 2004-03-04. Completion date: 2004-02-25.
Top industries in this zip code by the number of employees in 2005:
Health Care and Social Assistance: Nursing Care Facilities (50-99 employees: 1 establishment)
Construction: New Single-Family Housing Construction (except Operative Builders) (20-49: 1, 5-9: 3, 1-4: 4)
Construction: Poured Concrete Foundation and Structure Contractors (20-49: 1, 1-4: 1)
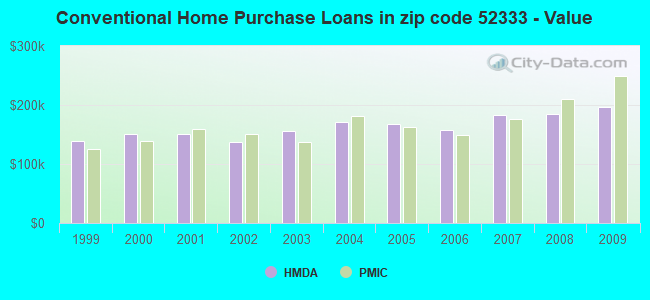
Detailed PMIC statistics for the following Tracts:0101.00
, 0102.00
2002 - 2018 National Fire Incident Reporting System (NFIRS) incidents
Based on the data from the years 2002 - 2018 the average number of fire incidents per year is 22. The highest number of fire incidents - 53 took place in 2003, and the least - 1 in 2007. The data has an increasing trend.
When looking into fire subcategories, the most reports belonged to: Outside Fires (46.1%), and Structure Fires (38.9%).
Fire incident types reported to NFIRS in Zip Code 52333


 Nearest zip codes: 52227, 52245, 52314, 52317, 52241, 52242.


 Based on the data from the years 2002 - 2018 the average number of fire incidents per year is 22. The highest number of fire incidents - 53 took place in 2003, and the least - 1 in 2007. The data has an increasing trend.
 When looking into fire subcategories, the most reports belonged to: Outside Fires (46.1%), and Structure Fires (38.9%).