Estimated zip code population in 2022: 890 Zip code population in 2010: 946 Zip code population in 2000: 993
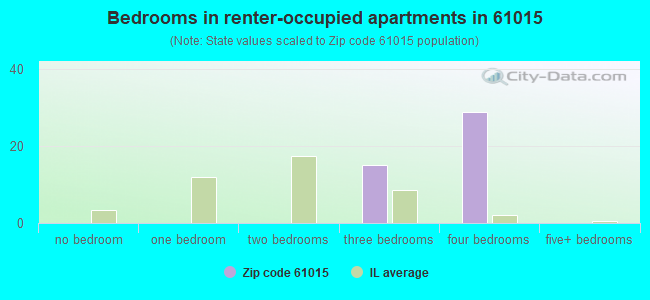
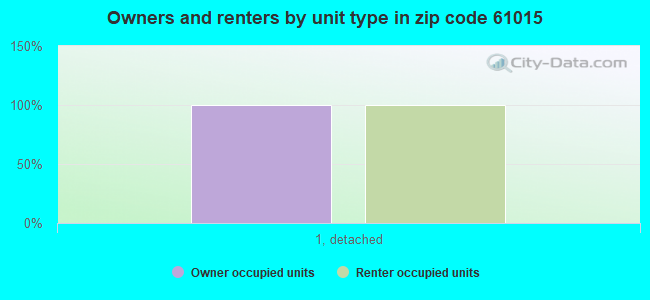
Houses and condos: 367 Renter-occupied apartments: 47
% of renters here:
15%
State:
33%
March 2022 cost of living index in zip code 61015: 83.6 (less than average, U.S. average is 100)
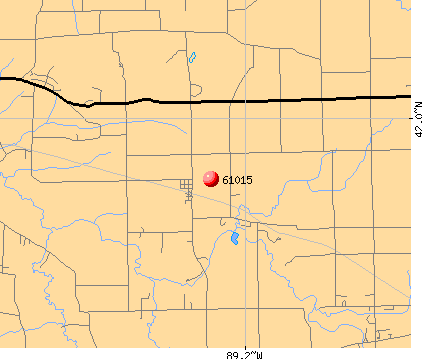
Land area: 41.0 sq. mi. Water area: 0.1 sq. mi.
Population density: 22 people per square mile
(very low).
OSM Map
General Map
Google Map
MSN Map
OSM Map
General Map
Google Map
MSN Map
OSM Map
General Map
Google Map
MSN Map
OSM Map
General Map
Google Map
MSN Map
Please wait while loading the map...
Real estate property taxes paid for housing units in 2022:
This zip code:
1.8% ($4,038)
Illinois:
2.0% ($4,912)
Median real estate property taxes paid for housing units with mortgages in 2022: $4,077 (1.7%) Median real estate property taxes paid for housing units with no mortgage in 2022: $3,689 (2.3%)
Business Search- 14 Million verified businesses
Males: 413
(46.4%)
Females: 477
(53.6%)
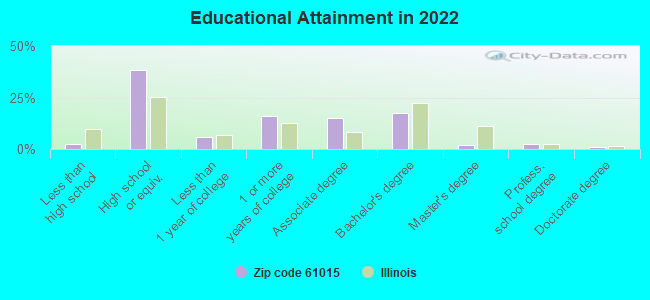
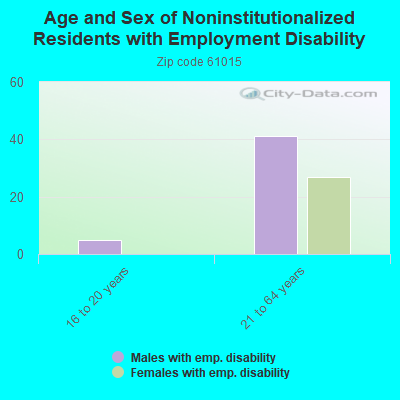
For population 25 years and over in 61015:
High school or higher: 97.4%
Bachelor's degree or higher: 22.5%
Graduate or professional degree: 5.3%
Unemployed: 2.5%
Mean travel time to work (commute): 33.8 minutes
For population 15 years and over in 61015:
Never married: 23.1%
Now married: 62.3%
Separated: 0.0%
Widowed: 6.1%
Divorced: 8.6%
Zip code 61015 compared to state average:
Unemployed percentage below state average.
Black race population percentage significantly below state average.
Hispanic race population percentage significantly below state average.
Foreign-born population percentage significantly below state average.
Renting percentage below state average.
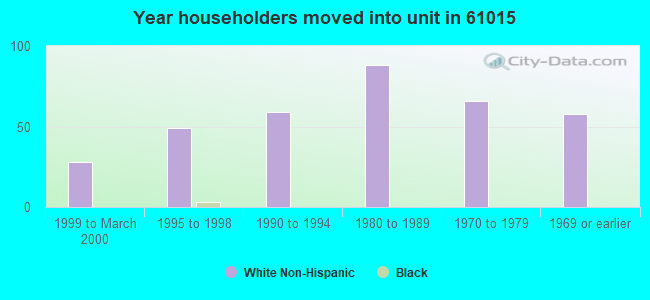
Length of stay since moving in significantly above state average.
Number of rooms per house above state average.
Number of college students below state average.
Percentage of population with a bachelor's degree or higher below state average.
Estimated median house/condo value in 2022: $226,451
61015:
$226,451
Illinois:
$251,600
According to our research of Illinois and other state lists, there was 1 registered sex offender living in 61015 zip code as of May 28, 2024. The ratio of all residents to sex offenders in zip code 61015 is 791 to 1. The ratio of registered sex offenders to all residents in this zip code is near the state average.
Median resident age:
This zip code:
37.2 years
Illinois median age:
39.1 years
Average household size:
This zip code:
2.8 people
Illinois:
2.4 people
Averages for the 2020 tax year for zip code 61015, filed in 2021:
Average Adjusted Gross Income (AGI) in 2020: $80,213 (Individual Income Tax Returns)
Here:
$80,213
State:
$82,626
Salary/wage: $60,103 (reported on 78.7% of returns)
Here:
$60,103
State:
$66,640
(% of AGI for various income ranges: 1113.8% for AGIs below $25k, 3841.4% for AGIs $25k-50k, 6053.3% for AGIs $50k-75k, 10200.0% for AGIs $75k-100k, 17094.3% for AGIs $100k-200k)
Taxable interest for individuals: $710 (reported on 44.7% of returns)
This zip code:
$710
Illinois:
$2,376
(% of AGI for various income ranges: 12.5% for AGIs below $25k, 11.4% for AGIs $25k-50k, 11.7% for AGIs $50k-75k, 36.7% for AGIs $75k-100k, 128.6% for AGIs $100k-200k)
Ordinary dividends: $2,567 (reported on 25.5% of returns)
Here:
$2,567
State:
$9,061
(% of AGI for various income ranges: 55.7% for AGIs $25k-50k, 65.0% for AGIs $50k-75k, 328.6% for AGIs $100k-200k)
Net capital gain/loss in AGI: +$10,950 (reported on 21.3% of returns)
Here:
+$10,950
State:
+$31,684
(% of AGI for various income ranges: 13.8% for AGIs below $25k, 36.7% for AGIs $50k-75k, 1517.1% for AGIs $100k-200k)
Profit/loss from business: +$9,633 (reported on 12.8% of returns)
Here:
+$9,633
State:
+$12,175
(% of AGI for various income ranges: 350.0% for AGIs $25k-50k, 475.7% for AGIs $100k-200k)
Taxable individual retirement arrangement distribution: $18,114 (reported on 14.9% of returns)
61015:
$18,114
Illinois:
$21,613
(% of AGI for various income ranges: 724.3% for AGIs $25k-50k, 1087.1% for AGIs $100k-200k)
Total itemized deductions: $40,750 (reported on 4.3% of returns)
Here:
$40,750
State:
$34,948
(% of AGI for various income ranges: 1358.3% for AGIs $50k-75k)
Taxes paid: $8,250 (reported on 4.3% of returns)
61015:
$8,250
State:
$8,563
(% of AGI for various income ranges: 275.0% for AGIs $50k-75k)
Earned income credit: $2,150 (reported on 8.5% of returns)
Here:
$2,150
State:
$2,311
(% of AGI for various income ranges: 107.5% for AGIs below $25k)
Percentage of individuals using paid preparers for their 2020 taxes: 97.9%
Here:
98%
State:
93%
(% for various income ranges: 90.9% for AGIs below $25k, 100.0% for AGIs $25k-50k, 100.0% for AGIs $50k-75k, 100.0% for AGIs $75k-100k, 100.0% for AGIs $100k-200k, 100.0% for AGIs over 200k)
Averages for the 2012 tax year for zip code 61015, filed in 2013:
Average Adjusted Gross Income (AGI) in 2012: $60,219 (Individual Income Tax Returns)
Here:
$60,219
State:
$68,058
Salary/wage: $47,613 (reported on 80.9% of returns)
Here:
$47,613
State:
$55,396
(% of AGI for various income ranges: 67.4% for AGIs below $25k, 73.0% for AGIs $25k-50k, 72.4% for AGIs $50k-75k, 72.2% for AGIs $75k-100k, 55.0% for AGIs $100k-200k)
Taxable interest for individuals: $1,145 (reported on 42.6% of returns)
This zip code:
$1,145
Illinois:
$1,969
(% of AGI for various income ranges: 1.0% for AGIs below $25k, 0.5% for AGIs $25k-50k, 1.2% for AGIs $50k-75k, 0.7% for AGIs $75k-100k, 0.7% for AGIs $100k-200k)
Ordinary dividends: $1,164 (reported on 23.4% of returns)
Here:
$1,164
State:
$7,786
(% of AGI for various income ranges: 1.4% for AGIs below $25k, 0.4% for AGIs $50k-75k, 0.6% for AGIs $100k-200k)
Net capital gain/loss in AGI: +$2,814 (reported on 14.9% of returns)
Here:
+$2,814
State:
+$22,183
Profit/loss from business: +$7,571 (reported on 14.9% of returns)
Here:
+$7,571
State:
+$12,903
(% of AGI for various income ranges: 7.5% for AGIs below $25k, 7.0% for AGIs $25k-50k, 3.0% for AGIs $75k-100k)
Taxable individual retirement arrangement distribution: $13,143 (reported on 14.9% of returns)
61015:
$13,143
Illinois:
$17,929
Total itemized deductions: $19,112 (20% of AGI, reported on 34.0% of returns)
Here:
$19,112
State:
$26,433
Here:
19.5% of AGI
State:
19.2% of AGI
(% of AGI for various income ranges: 13.3% for AGIs $25k-50k, 20.3% for AGIs $50k-75k, 11.0% for AGIs $100k-200k)
Charity contributions: $2,918 (reported on 23.4% of returns)
Here:
$2,918
State:
$4,525
Taxes paid: $7,569 (reported on 34.0% of returns)
61015:
$7,569
State:
$11,968
(% of AGI for various income ranges: 3.9% for AGIs $25k-50k, 7.3% for AGIs $50k-75k, 5.0% for AGIs $100k-200k)
Earned income credit: $1,717 (reported on 12.8% of returns)
Here:
$1,717
State:
$2,349
(% of AGI for various income ranges: 5.9% for AGIs below $25k)
Percentage of individuals using paid preparers for their 2012 taxes: 66.0%
Here:
66%
State:
57%
(% for various income ranges: 53.3% for AGIs below $25k, 63.6% for AGIs $25k-50k, 75.0% for AGIs $50k-75k, 60.0% for AGIs $75k-100k, 87.5% for AGIs $100k-200k)
Averages for the 2004 tax year for zip code 61015, filed in 2005:
Average Adjusted Gross Income (AGI) in 2004: $43,451 (Individual Income Tax Returns)
Here:
$43,451
State:
$54,625
Salary/wage: $38,995 (reported on 85.1% of returns)
Here:
$38,995
State:
$46,811
(% of AGI for various income ranges: 110.2% for AGIs below $10k, 71.7% for AGIs $10k-25k, 79.8% for AGIs $25k-50k, 82.0% for AGIs $50k-75k, 86.5% for AGIs $75k-100k, 55.2% for AGIs over 100k)
Taxable interest for individuals: $757 (reported on 56.4% of returns)
This zip code:
$757
Illinois:
$2,101
(% of AGI for various income ranges: 4.5% for AGIs below $10k, 2.3% for AGIs $10k-25k, 1.3% for AGIs $25k-50k, 0.6% for AGIs $50k-75k, 0.4% for AGIs $75k-100k, 0.9% for AGIs over 100k)
Taxable dividends: $731 (reported on 22.7% of returns)
Here:
$731
State:
$4,306
(% of AGI for various income ranges: 0.7% for AGIs below $10k, 0.4% for AGIs $10k-25k, 0.3% for AGIs $25k-50k, 0.1% for AGIs $50k-75k, 0.1% for AGIs $75k-100k, 1.0% for AGIs over 100k)
Net capital gain/loss: +$1,759 (reported on 16.6% of returns)
Here:
+$1,759
State:
+$17,321
(% of AGI for various income ranges: -0.4% for AGIs $10k-25k, 0.1% for AGIs $25k-50k, 0.0% for AGIs $50k-75k, 1.0% for AGIs $75k-100k, 2.3% for AGIs over 100k)
Profit/loss from business: +$4,025 (reported on 16.6% of returns)
Here:
+$4,025
State:
+$11,771
(% of AGI for various income ranges: 11.0% for AGIs below $10k, 5.1% for AGIs $10k-25k, 2.2% for AGIs $25k-50k, 1.1% for AGIs $50k-75k, 0.9% for AGIs $75k-100k)
IRA payment deduction: $2,100 (reported on 2.1% of returns)
61015:
$2,100
Illinois:
$3,087
Total itemized deductions: $15,777 (22% of AGI, reported on 31.2% of returns)
Here:
$15,777
State:
$20,239
Here:
22.2% of AGI
State:
19.5% of AGI
(% of AGI for various income ranges: 10.7% for AGIs $10k-25k, 11.0% for AGIs $25k-50k, 11.9% for AGIs $50k-75k, 11.2% for AGIs $75k-100k, 12.0% for AGIs over 100k)
Charity contributions deductions: $2,475 (3% of AGI, reported on 24.8% of returns)
Here:
$2,475
State:
$3,719
Here:
3.3% of AGI
State:
3.4% of AGI
(% of AGI for various income ranges: 4.2% for AGIs below $10k, 1.7% for AGIs $25k-50k, 1.1% for AGIs $50k-75k, 1.1% for AGIs $75k-100k, 2.0% for AGIs over 100k)
Total tax: $5,177 (reported on 83.4% of returns)
61015:
$5,177
State:
$9,882
(% of AGI for various income ranges: 3.7% for AGIs below $10k, 4.7% for AGIs $10k-25k, 7.1% for AGIs $25k-50k, 8.2% for AGIs $50k-75k, 10.7% for AGIs $75k-100k, 16.9% for AGIs over 100k)
Earned income credit: $1,400 (reported on 9.5% of returns)
Here:
$1,400
State:
$1,788
Percentage of individuals using paid preparers for their 2004 taxes: 63.4%
Here:
63%
State:
61%
(% for various income ranges: 44.4% for AGIs below $10k, 68.1% for AGIs $10k-25k, 61.2% for AGIs $25k-50k, 68.0% for AGIs $50k-75k, 75.0% for AGIs $75k-100k, 80.6% for AGIs over 100k)
Household received Food Stamps/SNAP in the past 12 months: 1 Household did not receive Food Stamps/SNAP in the past 12 months: 311
Women who had a birth in the past 12 months: 1 (1 now married, 0 unmarried) Women who did not have a birth in the past 12 months: 223 (117 now married, 105 unmarried)
Housing units in zip code 61015 with a mortgage: 203 Median monthly owner costs for units with a mortgage: $1,403 Median monthly owner costs for units without a mortgage: $713
Residents with income below the poverty level in 2022:
This zip code:
0.9%
Whole state:
11.9%
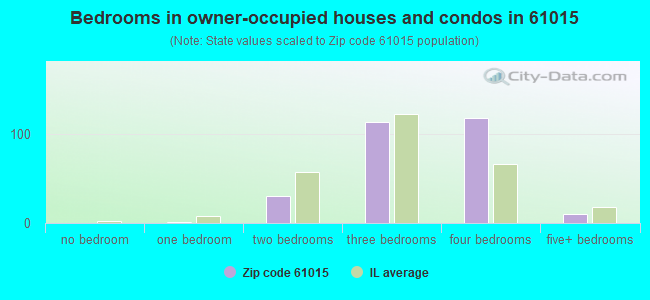
Median number of rooms in houses and condos:
Here:
7.4
State:
6.4
Notable locations in this zip code not listed on our city pages
Size of family households: 61 2-persons, 48 3-persons, 67 4-persons, 32 5-persons, 14 6-persons
Size of nonfamily households: 90 1-person
256 married couples with children.
2 single-parent households (2 men).
99.1% of residents of 61015 zip code speak English at home.
Foreign born population: 0 (0.0%)
:
0.0%
Whole state:
14.4%
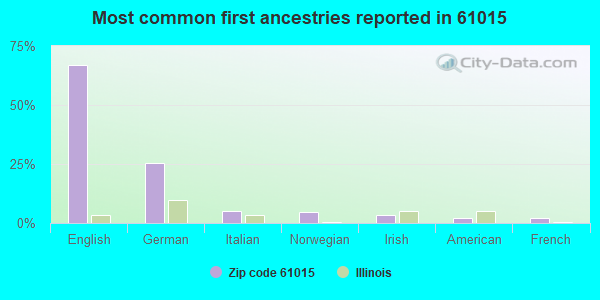
67%English
25%German
5%Italian
5%Norwegian
3%Irish
2%American
2%French
Facilities with environmental interests located in this zip code:
HARDESTY EXCAVATING (4703 EAST FLAGG RD. in CHANA, IL)
STATE MASTER (Illinois EPA Project) - AIR PROGRAM AIR MINOR (AIRS/AFS) Business SIC classification: NONCLASSIFIABLE ESTABLISHMENTS
ROCK RIVER CHALLENGE (PO BOX 91 in CHANA, IL)
(National Center for Education Statistics) - STATE ID-4700000009301 Organizations: LEE/OGLE ROE (SCHOOL DISTRICT)
ADAMS FS INCORPORATED (PO BOX 73 in HONEYCREEK, IL)
AIR MINOR (AIRS/AFS) Business SIC classification: FARM SUPPLIES
Housing units lacking complete plumbing facilities: 2.2% Housing units lacking complete kitchen facilities: 11.5%
71.5%Bottled, tank, or LP gas
13.8%Electricity
10.3%Utility gas
4.2%Fuel oil, kerosene, etc.
1.0%Wood
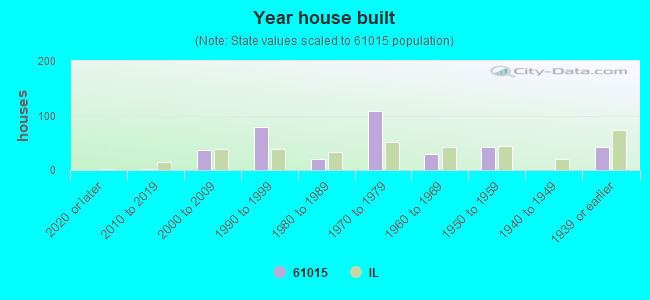
Population in 1990: 1,167.
Place of birth for U.S.-born residents:
This state: 795
Northeast: 2
Midwest: 68
South: 10
West: 10
77% of the 61015 zip code residents lived in the same house 5 years ago. Out of people who lived in different houses, 44% lived in this county. Out of people who lived in different counties, 50% lived in Illinois.
99% of the 61015 zip code residents lived in the same house 1 year ago. Out of people who lived in different houses, 60% moved from different county within same state. Out of people who lived in different houses, 60% moved from different state.
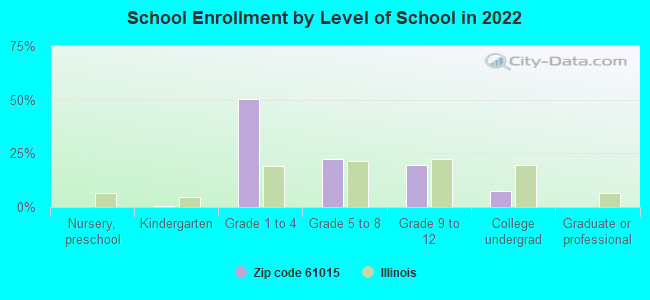
Private vs. public school enrollment:
Students in private schools in grades 1 to 8 (elementary and middle school): 3
Here:
1.6%
Illinois:
13.3%
Students in private schools in grades 9 to 12 (high school): 1
Here:
3.7%
Illinois:
9.9%
Students in private undergraduate colleges:
Here:
0.0%
Illinois:
27.4%
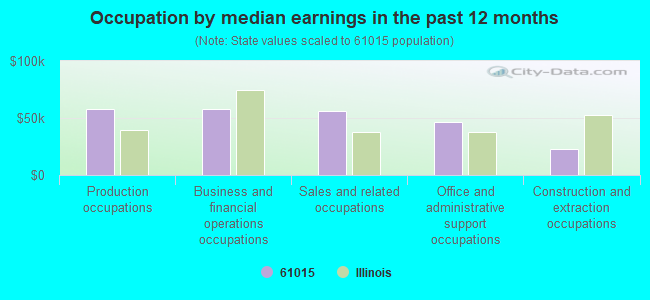
Occupation by median earnings in the past 12 months ($)
58,240Production occupations
57,549Business and financial operations occupations
56,432Sales and related occupations
46,869Office and administrative support occupations
22,473Construction and extraction occupations
Top industries in this zip code by the number of employees in 2005:
Construction: Site Preparation Contractors (10-19 employees: 1 establishment)
Construction: Residential Remodelers (5-9: 1)
Administrative and Support and Waste Management and Remediation Services: Landscaping Services (1-4: 2)
Construction: Electrical Contractors (1-4: 1)
Other Services (except Public Administration): Religious Organizations (1-4: 1)
Wholesale Trade: Farm and Garden Machinery and Equipment Merchant Wholesalers (1-4: 1)
Construction: New Single-Family Housing Construction (except Operative Builders) (1-4: 1)
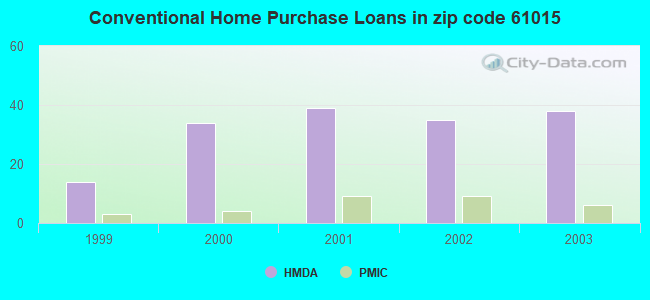
Home Mortgage Disclosure Act Aggregated Statistics For Year 2003 (Based on 2 partial tracts)
A) FHA, FSA/RHS & VA Home Purchase Loans
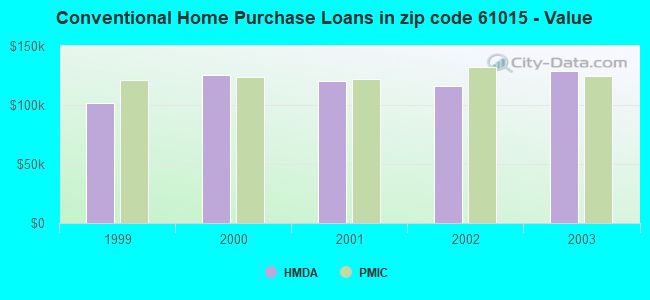
B) Conventional Home Purchase Loans
C) Refinancings
D) Home Improvement Loans
F) Non-occupant Loans on < 5 Family Dwellings (A B C & D)
Number
Average Value
Number
Average Value
Number
Average Value
Number
Average Value
Number
Average Value
LOANS ORIGINATED
1
$173,990
38
$129,049
243
$114,735
6
$26,003
11
$93,572
APPLICATIONS APPROVED, NOT ACCEPTED
0
$0
3
$185,180
14
$151,701
0
$0
1
$101,650
APPLICATIONS DENIED
0
$0
4
$131,910
39
$125,134
3
$14,500
0
$0
APPLICATIONS WITHDRAWN
0
$0
9
$143,573
26
$136,021
0
$0
0
$0
FILES CLOSED FOR INCOMPLETENESS
2
$95,505
0
$0
5
$144,014
0
$0
0
$0
Aggregated Statistics For Year 2002 (Based on 2 partial tracts)
A) FHA, FSA/RHS & VA Home Purchase Loans
B) Conventional Home Purchase Loans
C) Refinancings
D) Home Improvement Loans
F) Non-occupant Loans on < 5 Family Dwellings (A B C & D)
Number
Average Value
Number
Average Value
Number
Average Value
Number
Average Value
Number
Average Value
LOANS ORIGINATED
9
$105,592
35
$115,701
250
$117,792
13
$23,822
10
$82,551
APPLICATIONS APPROVED, NOT ACCEPTED
0
$0
1
$119,150
9
$128,497
1
$29,310
1
$118,670
APPLICATIONS DENIED
0
$0
6
$78,485
29
$114,809
3
$29,943
1
$131,440
APPLICATIONS WITHDRAWN
0
$0
5
$129,736
18
$122,771
0
$0
1
$158,390
FILES CLOSED FOR INCOMPLETENESS
0
$0
0
$0
7
$121,037
0
$0
0
$0
Aggregated Statistics For Year 2001 (Based on 2 partial tracts)
A) FHA, FSA/RHS & VA Home Purchase Loans
B) Conventional Home Purchase Loans
C) Refinancings
D) Home Improvement Loans
F) Non-occupant Loans on < 5 Family Dwellings (A B C & D)
Number
Average Value
Number
Average Value
Number
Average Value
Number
Average Value
Number
Average Value
LOANS ORIGINATED
6
$109,768
39
$120,200
191
$112,202
16
$24,940
11
$88,242
APPLICATIONS APPROVED, NOT ACCEPTED
0
$0
4
$115,835
12
$79,155
0
$0
2
$68,555
APPLICATIONS DENIED
0
$0
6
$89,043
25
$96,584
3
$14,500
0
$0
APPLICATIONS WITHDRAWN
0
$0
5
$98,154
21
$115,476
1
$23,640
2
$124,110
FILES CLOSED FOR INCOMPLETENESS
0
$0
0
$0
7
$110,567
0
$0
0
$0
Aggregated Statistics For Year 2000 (Based on 2 partial tracts)
A) FHA, FSA/RHS & VA Home Purchase Loans
B) Conventional Home Purchase Loans
C) Refinancings
D) Home Improvement Loans
F) Non-occupant Loans on < 5 Family Dwellings (A B C & D)
Number
Average Value
Number
Average Value
Number
Average Value
Number
Average Value
Number
Average Value
LOANS ORIGINATED
7
$106,717
34
$125,334
43
$104,731
21
$21,231
8
$87,409
APPLICATIONS APPROVED, NOT ACCEPTED
0
$0
3
$98,973
6
$75,097
5
$29,880
0
$0
APPLICATIONS DENIED
1
$98,820
5
$81,038
15
$89,107
4
$24,112
1
$63,830
APPLICATIONS WITHDRAWN
0
$0
3
$108,270
14
$82,267
0
$0
1
$64,770
FILES CLOSED FOR INCOMPLETENESS
0
$0
1
$239,710
6
$107,640
0
$0
0
$0
Aggregated Statistics For Year 1999 (Based on 1 partial tract)
A) FHA, FSA/RHS & VA Home Purchase Loans
B) Conventional Home Purchase Loans
C) Refinancings
D) Home Improvement Loans
F) Non-occupant Loans on < 5 Family Dwellings (A B C & D)

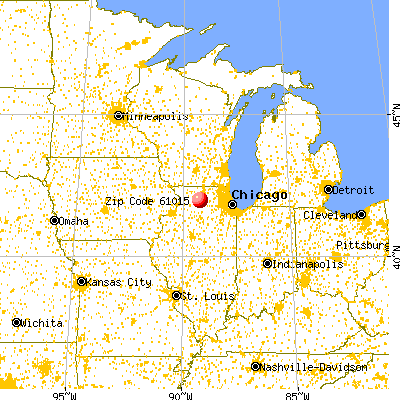


 Nearest zip codes: 61043, 61084, 61006, 61061, 61068, 61020.