Estimated zip code population in 2022: 2,197 Zip code population in 2010: 2,093 Zip code population in 2000: 2,107
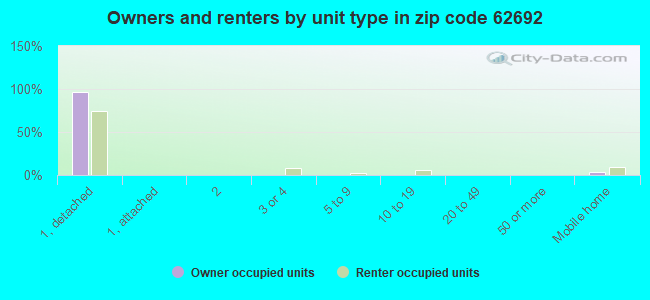
Houses and condos: 953 Renter-occupied apartments: 162
% of renters here:
18%
State:
33%
March 2022 cost of living index in zip code 62692: 84.1 (less than average, U.S. average is 100)
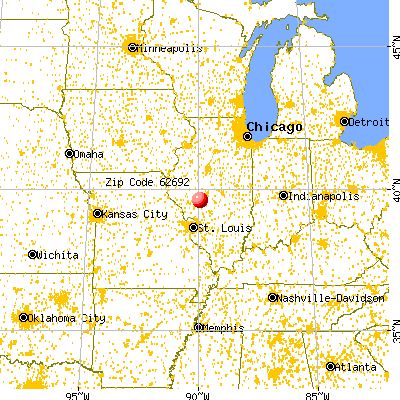
Land area: 87.7 sq. mi. Water area: 0.0 sq. mi.
Population density: 25 people per square mile
(very low).
OSM Map
General Map
Google Map
MSN Map
OSM Map
General Map
Google Map
MSN Map
OSM Map
General Map
Google Map
MSN Map
OSM Map
General Map
Google Map
MSN Map
Please wait while loading the map...
Real estate property taxes paid for housing units in 2022:
This zip code:
1.6% ($1,852)
Illinois:
2.0% ($4,912)
Median real estate property taxes paid for housing units with mortgages in 2022: $1,941 (1.7%) Median real estate property taxes paid for housing units with no mortgage in 2022: $1,615 (1.5%)
Business Search- 14 Million verified businesses
Males: 1,017
(46.3%)
Females: 1,179
(53.7%)
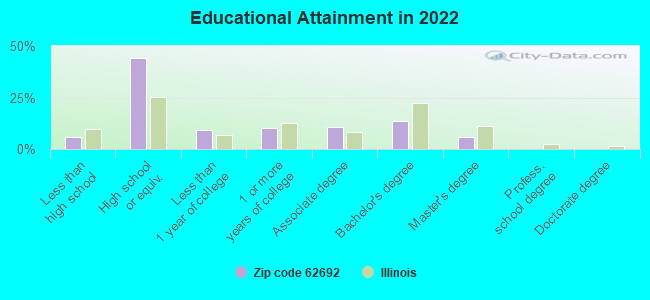
For population 25 years and over in 62692:
High school or higher: 93.2%
Bachelor's degree or higher: 19.8%
Graduate or professional degree: 6.1%
Unemployed: 3.0%
Mean travel time to work (commute): 24.0 minutes
For population 15 years and over in 62692:
Never married: 23.5%
Now married: 54.1%
Separated: 0.0%
Widowed: 4.8%
Divorced: 17.6%
Zip code 62692 compared to state average:
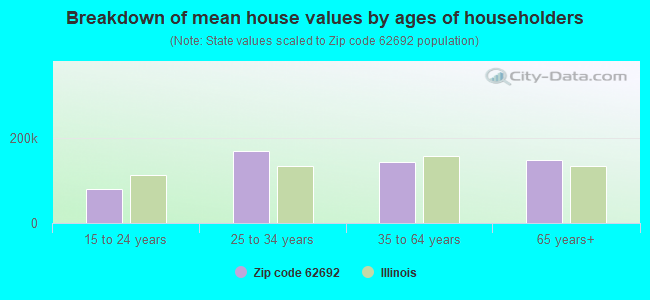
Median house value below state average.
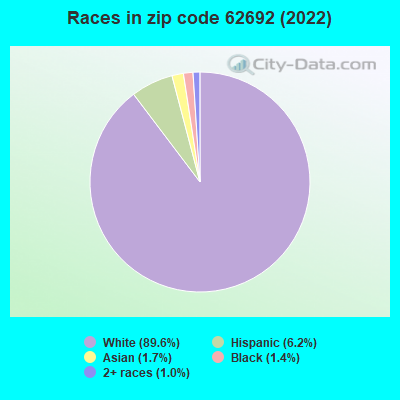
Black race population percentage significantly below state average.
Hispanic race population percentage below state average.
Median age above state average.
Foreign-born population percentage significantly below state average.
Renting percentage below state average.
Length of stay since moving in significantly above state average.
Percentage of population with a bachelor's degree or higher below state average.
Estimated median house/condo value in 2022: $113,646
62692:
$113,646
Illinois:
$251,600
According to our research of Illinois and other state lists, there were 3 registered sex offenders living in 62692 zip code as of June 07, 2024. The ratio of all residents to sex offenders in zip code 62692 is 675 to 1. The ratio of registered sex offenders to all residents in this zip code is near the state average.
Median resident age:
This zip code:
44.1 years
Illinois median age:
39.1 years
Average household size:
This zip code:
2.4 people
Illinois:
2.4 people
Averages for the 2020 tax year for zip code 62692, filed in 2021:
Average Adjusted Gross Income (AGI) in 2020: $60,194 (Individual Income Tax Returns)
Here:
$60,194
State:
$82,626
Salary/wage: $46,835 (reported on 76.3% of returns)
Here:
$46,835
State:
$66,640
(% of AGI for various income ranges: 1182.7% for AGIs below $25k, 3034.0% for AGIs $25k-50k, 5702.5% for AGIs $50k-75k, 7907.1% for AGIs $75k-100k, 17012.5% for AGIs $100k-200k)
Taxable interest for individuals: $1,367 (reported on 37.1% of returns)
This zip code:
$1,367
Illinois:
$2,376
(% of AGI for various income ranges: 17.7% for AGIs below $25k, 36.0% for AGIs $25k-50k, 34.2% for AGIs $50k-75k, 34.3% for AGIs $75k-100k, 238.8% for AGIs $100k-200k)
Ordinary dividends: $3,057 (reported on 14.4% of returns)
Here:
$3,057
State:
$9,061
(% of AGI for various income ranges: 12.7% for AGIs below $25k, 14.5% for AGIs $25k-50k, 107.5% for AGIs $50k-75k, 302.5% for AGIs $100k-200k)
Net capital gain/loss in AGI: +$2,223 (reported on 13.4% of returns)
Here:
+$2,223
State:
+$31,684
(% of AGI for various income ranges: 37.5% for AGIs $50k-75k, 132.9% for AGIs $75k-100k, 198.8% for AGIs $100k-200k)
Profit/loss from business: +$11,446 (reported on 13.4% of returns)
Here:
+$11,446
State:
+$12,175
(% of AGI for various income ranges: 106.4% for AGIs below $25k, 171.0% for AGIs $25k-50k, 249.2% for AGIs $50k-75k, 766.2% for AGIs $100k-200k)
Taxable individual retirement arrangement distribution: $10,320 (reported on 10.3% of returns)
62692:
$10,320
Illinois:
$21,613
(% of AGI for various income ranges: 106.8% for AGIs below $25k, 408.3% for AGIs $50k-75k, 383.8% for AGIs $100k-200k)
Total itemized deductions: $28,350 (reported on 2.1% of returns)
Here:
$28,350
State:
$34,948
(% of AGI for various income ranges: 257.7% for AGIs below $25k)
Earned income credit: $2,300 (reported on 16.5% of returns)
Here:
$2,300
State:
$2,311
(% of AGI for various income ranges: 90.9% for AGIs below $25k, 84.0% for AGIs $25k-50k)
Percentage of individuals using paid preparers for their 2020 taxes: 94.8%
Here:
95%
State:
93%
(% for various income ranges: 93.5% for AGIs below $25k, 95.7% for AGIs $25k-50k, 94.1% for AGIs $50k-75k, 100.0% for AGIs $75k-100k, 92.9% for AGIs $100k-200k, 100.0% for AGIs over 200k)
Averages for the 2012 tax year for zip code 62692, filed in 2013:
Average Adjusted Gross Income (AGI) in 2012: $50,957 (Individual Income Tax Returns)
Here:
$50,957
State:
$68,058
Salary/wage: $38,468 (reported on 79.2% of returns)
Here:
$38,468
State:
$55,396
(% of AGI for various income ranges: 64.8% for AGIs below $25k, 74.7% for AGIs $25k-50k, 67.6% for AGIs $50k-75k, 65.9% for AGIs $75k-100k, 74.8% for AGIs $100k-200k)
Taxable interest for individuals: $1,210 (reported on 39.6% of returns)
This zip code:
$1,210
Illinois:
$1,969
(% of AGI for various income ranges: 3.1% for AGIs below $25k, 0.6% for AGIs $25k-50k, 0.8% for AGIs $50k-75k, 0.6% for AGIs $75k-100k, 1.4% for AGIs $100k-200k)
Ordinary dividends: $1,783 (reported on 17.8% of returns)
Here:
$1,783
State:
$7,786
(% of AGI for various income ranges: 0.9% for AGIs below $25k, 0.9% for AGIs $25k-50k, 0.2% for AGIs $50k-75k, 0.8% for AGIs $75k-100k, 0.8% for AGIs $100k-200k)
Net capital gain/loss in AGI: +$445 (reported on 10.9% of returns)
Here:
+$445
State:
+$22,183
(% of AGI for various income ranges: 0.2% for AGIs $25k-50k, 0.4% for AGIs $100k-200k)
Profit/loss from business: +$6,877 (reported on 12.9% of returns)
Here:
+$6,877
State:
+$12,903
(% of AGI for various income ranges: 7.5% for AGIs below $25k, 1.8% for AGIs $25k-50k, 1.8% for AGIs $50k-75k, 1.8% for AGIs $100k-200k)
Taxable individual retirement arrangement distribution: $11,611 (reported on 8.9% of returns)
62692:
$11,611
Illinois:
$17,929
(% of AGI for various income ranges: 2.8% for AGIs below $25k, 5.0% for AGIs $25k-50k, 4.7% for AGIs $75k-100k)
Total itemized deductions: $16,472 (16% of AGI, reported on 17.8% of returns)
Here:
$16,472
State:
$26,433
Here:
16.0% of AGI
State:
19.2% of AGI
(% of AGI for various income ranges: 6.4% for AGIs $25k-50k, 6.4% for AGIs $50k-75k, 6.3% for AGIs $75k-100k, 10.3% for AGIs $100k-200k)
Charity contributions: $2,920 (reported on 9.9% of returns)
Here:
$2,920
State:
$4,525
(% of AGI for various income ranges: 0.4% for AGIs $25k-50k, 0.6% for AGIs $75k-100k, 1.6% for AGIs $100k-200k)
Taxes paid: $6,378 (reported on 17.8% of returns)
62692:
$6,378
State:
$11,968
(% of AGI for various income ranges: 1.6% for AGIs $25k-50k, 1.6% for AGIs $50k-75k, 2.5% for AGIs $75k-100k, 5.1% for AGIs $100k-200k)
Earned income credit: $2,368 (reported on 18.8% of returns)
Here:
$2,368
State:
$2,349
(% of AGI for various income ranges: 7.1% for AGIs below $25k, 1.1% for AGIs $25k-50k)
Percentage of individuals using paid preparers for their 2012 taxes: 68.3%
Here:
68%
State:
57%
(% for various income ranges: 66.7% for AGIs below $25k, 66.7% for AGIs $25k-50k, 75.0% for AGIs $50k-75k, 63.6% for AGIs $75k-100k, 90.0% for AGIs $100k-200k)
Averages for the 2004 tax year for zip code 62692, filed in 2005:
Average Adjusted Gross Income (AGI) in 2004: $35,057 (Individual Income Tax Returns)
Here:
$35,057
State:
$54,625
Salary/wage: $31,110 (reported on 82.1% of returns)
Here:
$31,110
State:
$46,811
(% of AGI for various income ranges: 141.8% for AGIs below $10k, 70.1% for AGIs $10k-25k, 76.8% for AGIs $25k-50k, 72.0% for AGIs $50k-75k, 79.0% for AGIs $75k-100k, 48.0% for AGIs over 100k)
Taxable interest for individuals: $1,476 (reported on 46.2% of returns)
This zip code:
$1,476
Illinois:
$2,101
(% of AGI for various income ranges: 7.7% for AGIs below $10k, 3.1% for AGIs $10k-25k, 2.3% for AGIs $25k-50k, 2.1% for AGIs $50k-75k, 0.5% for AGIs $75k-100k, 0.8% for AGIs over 100k)
Taxable dividends: $1,191 (reported on 17.6% of returns)
Here:
$1,191
State:
$4,306
(% of AGI for various income ranges: 0.6% for AGIs below $10k, 1.7% for AGIs $10k-25k, 0.6% for AGIs $25k-50k, 0.6% for AGIs $50k-75k, 0.1% for AGIs $75k-100k, 0.4% for AGIs over 100k)
Net capital gain/loss: +$1,269 (reported on 14.3% of returns)
Here:
+$1,269
State:
+$17,321
(% of AGI for various income ranges: -3.5% for AGIs below $10k, 0.8% for AGIs $10k-25k, 0.1% for AGIs $25k-50k, 0.7% for AGIs $50k-75k, -0.1% for AGIs $75k-100k, 2.1% for AGIs over 100k)
Profit/loss from business: +$5,689 (reported on 13.0% of returns)
Here:
+$5,689
State:
+$11,771
(% of AGI for various income ranges: -15.4% for AGIs below $10k, 4.7% for AGIs $10k-25k, 2.2% for AGIs $25k-50k, 2.4% for AGIs $50k-75k, 2.7% for AGIs $75k-100k)
Profit/loss from farming: +$11,349 (reported on 8.5% of returns)
Here:
+$11,349
State:
+$2,327
(% of AGI for various income ranges: -8.0% for AGIs below $10k, -0.9% for AGIs $10k-25k, 1.9% for AGIs $25k-50k, 2.6% for AGIs $50k-75k, 5.0% for AGIs $75k-100k, 7.3% for AGIs over 100k)
IRA payment deduction: $3,269 (reported on 2.6% of returns)
62692:
$3,269
Illinois:
$3,087
Total itemized deductions: $13,565 (23% of AGI, reported on 18.9% of returns)
Here:
$13,565
State:
$20,239
Here:
23.3% of AGI
State:
19.5% of AGI
(% of AGI for various income ranges: 6.9% for AGIs $10k-25k, 8.5% for AGIs $25k-50k, 6.9% for AGIs $50k-75k, 8.1% for AGIs $75k-100k, 5.9% for AGIs over 100k)
Charity contributions deductions: $1,930 (3% of AGI, reported on 14.1% of returns)
Here:
$1,930
State:
$3,719
Here:
3.0% of AGI
State:
3.4% of AGI
(% of AGI for various income ranges: 1.1% for AGIs below $10k, 0.8% for AGIs $25k-50k, 0.7% for AGIs $50k-75k, 0.8% for AGIs $75k-100k, 1.6% for AGIs over 100k)
Total tax: $4,270 (reported on 74.4% of returns)
62692:
$4,270
State:
$9,882
(% of AGI for various income ranges: 1.9% for AGIs below $10k, 4.4% for AGIs $10k-25k, 7.4% for AGIs $25k-50k, 9.0% for AGIs $50k-75k, 10.8% for AGIs $75k-100k, 16.8% for AGIs over 100k)
Earned income credit: $1,662 (reported on 14.0% of returns)
Here:
$1,662
State:
$1,788
Percentage of individuals using paid preparers for their 2004 taxes: 71.6%
Here:
72%
State:
61%
(% for various income ranges: 66.5% for AGIs below $10k, 72.0% for AGIs $10k-25k, 73.3% for AGIs $25k-50k, 73.6% for AGIs $50k-75k, 73.3% for AGIs $75k-100k, 75.9% for AGIs over 100k)
Likely homosexual households (counted as self-reported same-sex unmarried-partner households)
Lesbian couples: 0.2% of all households
Gay men: 0.0% of all households
Household received Food Stamps/SNAP in the past 12 months: 82 Household did not receive Food Stamps/SNAP in the past 12 months: 810
Women who had a birth in the past 12 months: 23 (19 now married, 3 unmarried) Women who did not have a birth in the past 12 months: 490 (199 now married, 290 unmarried)
Housing units in zip code 62692 with a mortgage: 431 (43 second mortgage, 7 home equity loan, 30 both second mortgage and home equity loan) Median monthly owner costs for units with a mortgage: $1,130 Median monthly owner costs for units without a mortgage: $527
Residents with income below the poverty level in 2022:
This zip code:
8.1%
Whole state:
11.9%
Residents with income below 50% of the poverty level in 2022:
This zip code:
5.4%
Whole state:
5.7%
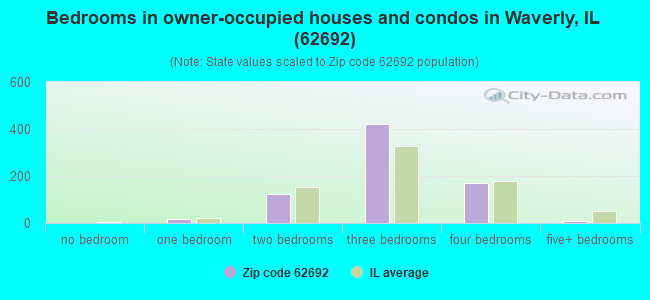
Median number of rooms in houses and condos:
Here:
6.7
State:
6.4
Median number of rooms in apartments:
Here:
4.8
State:
4.1
Notable locations in this zip code not listed on our city pages
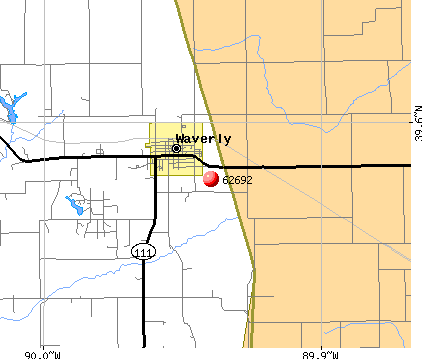
Notable locations in zip code 62692: Stayton Dairy Farm (A), Waverly Public Library (B), Waverly Volunteer Fire Department (C). Display/hide their locations on the map
Churches in zip code 62692 include: Christ Lutheran Church (A), First Baptist Church (B), Saint Sebastian Church (C), Waverly Christian Church (D), Waverly First United Methodist Church (E), New Hope Church (F). Display/hide their locations on the map
Cemeteries: Allis Cemetery (1), Conlee Cemetery (2), East Cemetery (3), Jones Cemetery (4), Little York Cemetery (5), Rogers Cemetery (6), Saint Sebastians Cemetery (7). Display/hide their locations on the map
Size of family households: 220 2-persons, 61 3-persons, 127 4-persons, 91 5-persons, 33 6-persons
Size of nonfamily households: 295 1-person, 58 2-persons, 8 3-persons
304 married couples with children.
52 single-parent households (16 men, 36 women).
99.0% of residents of 62692 zip code speak English at home.
0.7% of residents speak Spanish at home (100% very well).
Foreign born population: 54 (2.5%) (53.9% of them are naturalized citizens)
This zip code:
2.5%
Whole state:
14.4%
76%Bhutan
2%Nicaragua
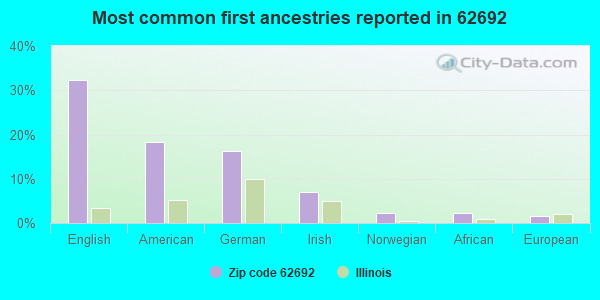
32%English
18%American
16%German
7%Irish
2%Norwegian
2%African
2%European
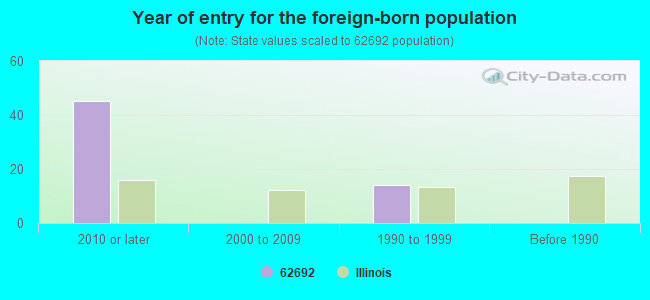
Year of entry for the foreign-born population
452010 or later
02000 to 2009
141990 to 1999
0Before 1990
Facilities with environmental interests located in this zip code:
PANHANDLE EASTERN PIPELINE CO (3302 STATE HIGHWAY 104 in WAVERLY, IL)
STATE MASTER (Illinois EPA Project) - SOLID WASTE PROGRAM, HAZARDOUS WASTE PROGRAM, AIR PROGRAM AIR MAJOR (AIRS/AFS) CRITERIA AND HAZARDOUS AIR POLLUTANT INVENTORY (Inventory of air pollution sources) Large Quantity Generators, more that 1000 kg of hazardous waste/month (Resource Conservation and Recovery Act (tracking hazardous waste)) Business SIC classification: NATURAL GAS TRANSMISSION Business NAICS classification: PIPELINE TRANSPORTATION OF NATURAL GAS. Organizations: PANHANDLE EASTERN PIPELINE CO. (CONTACT/OPERATOR)
Alternative names: PANHANDLE EASTERN PIPE LINE CO.-WAVERLY, PEPL WAVERLY
CURRY READY MIX INC - WAVERLY (521 NORTH HARKER in WAVERLY, IL)
STATE MASTER (Illinois EPA Project) - AIR PROGRAM AIR MINOR (AIRS/AFS) National Pollutant Discharge Elimination System NON-MAJOR (Tracking pollutant discharge elimination systems) - permit Business SIC classification: NONCLASSIFIABLE ESTABLISHMENTS Organizations: WAVERLY CEMENT COMPANY (CONTACT/OWNER)
Alternative names: WAVERLY CEMENT COMPANY
GRANDVIEW INC (199 S PEARL ST in WAVERLY, IL)
STATE MASTER (Illinois EPA Project) - AIR PROGRAM AIR MINOR (AIRS/AFS) CRITERIA AND HAZARDOUS AIR POLLUTANT INVENTORY (Inventory of air pollution sources) Business SIC classification: GROCERY STORES Alternative names: GRANDVIEW INCORPORATED DBA WAVERLY FAMILY FOODS
JOHNSON SHUTTLE LLC (15379 JASMINE RD in TALKINGTON TWP, IL)
STATE MASTER (Illinois EPA Project) - AIR PROGRAM AIR MINOR (AIRS/AFS) Business SIC classification: GRAIN AND FIELD BEANS Alternative names: WAVERLY GRAIN TERMINAL
KESINGER PETROLEUM S (CITY OF in WAVERLY, IL)
STATE MASTER (Illinois EPA Project) - AIR PROGRAM AIR MINOR (AIRS/AFS) Business SIC classification: PETROLEUM BULK STATIONS AND TERMINALS
PETROLEUM SERVICE (R R #1 in WAVERLY, IL)
STATE MASTER (Illinois EPA Project) - AIR PROGRAM AIR MINOR (AIRS/AFS) Business SIC classification: PETROLEUM BULK STATIONS AND TERMINALS
CRAZY HORSE CONCRETE INC (521 N HARKER ST in WAVERLY, IL)
STATE MASTER (Illinois EPA Project) - AIR PROGRAM AIR MINOR (AIRS/AFS) Business SIC classification: CONCRETE PRODUCTS, EXCEPT BLOCK AND BRICK
ROBERT JOHNSON GRAIN CO INC (RURAL ROUTE 1, BOX 48 in WAVERLY, IL)
STATE MASTER (Illinois EPA Project) - AIR PROGRAM AIR MINOR (AIRS/AFS) Business SIC classification: NONCLASSIFIABLE ESTABLISHMENTS
RHEA'S CHEM STOR (RR #2 BOX 123 in WAVERLY, IL)
COMPLIANCE ACTIVITY (Tracking inspections of insecticide, fungicide, and rodenticide, and toxic substances)
Housing units lacking complete plumbing facilities: 2.8% Housing units lacking complete kitchen facilities: 2.2%
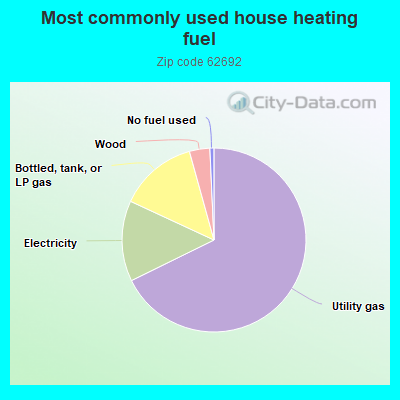
67.8%Utility gas
14.2%Electricity
13.8%Bottled, tank, or LP gas
3.6%Wood
0.7%No fuel used
Population in 1990: 1,968. Population change in the 1990s: +139 (+7.1%).
Place of birth for U.S.-born residents:
This state: 1,864
Northeast: 8
Midwest: 96
South: 64
West: 101
64% of the 62692 zip code residents lived in the same house 5 years ago. Out of people who lived in different houses, 64% lived in this county. Out of people who lived in different counties, 50% lived in Illinois.
93% of the 62692 zip code residents lived in the same house 1 year ago. Out of people who lived in different houses, 20% moved from this county. Out of people who lived in different houses, 21% moved from different county within same state. Out of people who lived in different houses, 66% moved from different state.
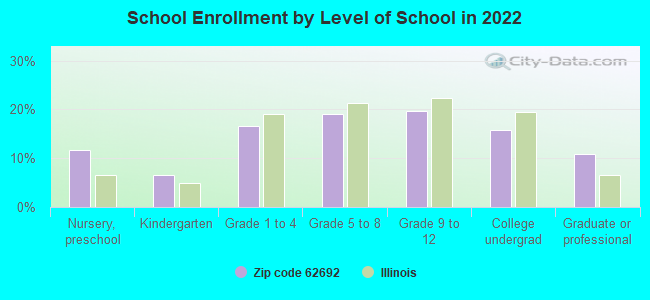
Private vs. public school enrollment:
Students in private schools in grades 1 to 8 (elementary and middle school):
Here:
0.0%
Illinois:
13.3%
Students in private schools in grades 9 to 12 (high school):
Here:
0.0%
Illinois:
9.9%
Students in private undergraduate colleges: 7
Here:
9.6%
Illinois:
27.4%
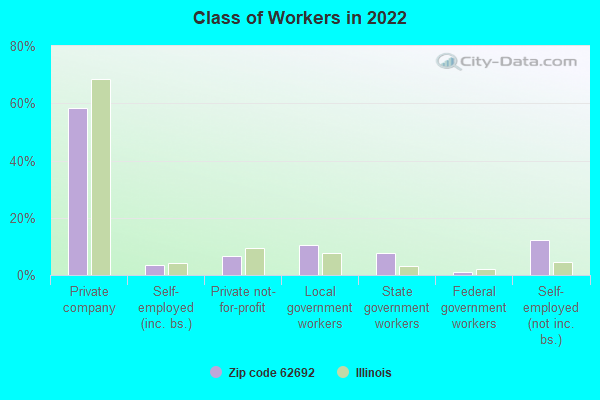
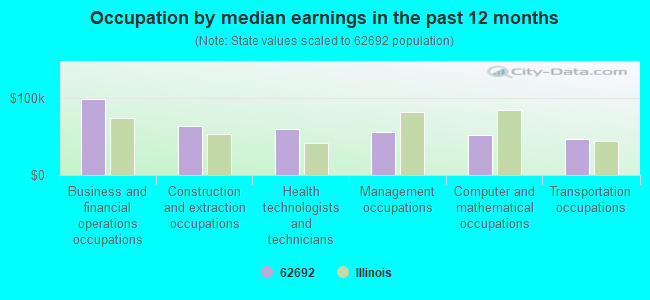
Occupation by median earnings in the past 12 months ($)
98,973Business and financial operations occupations
64,347Construction and extraction occupations
59,814Health technologists and technicians
55,529Management occupations
52,521Computer and mathematical occupations
47,511Transportation occupations
Companies with federal contracts located in this zip code:
CUMMINS EARTH SERVICES, LLC (3225 NORTONVILLE BLACKTOP in WAVERLY, IL; small business) : $245,998 in 29 contractsfrom 2005 to 2006
Contracts for Well Drilling/Exploratory Services, Land Treatment Practices Services (plowing/clearing, etc.), Landscaping/Groundskeeping Services by Natural Resources Conservation Service, U.S. Army Corps of Engineers - civil program financing only, Army Signed by year:2000: $0; 2001: $0; 2002: $0; 2003: $0; 2004: $0; 2005: $214,569; 2006: $31,429.
Biggest contracts:
$74,136 with Natural Resources Conservation Service for Well Drilling/Exploratory Services. Taking place in MO. Signed on 2005-05-20. Completion date: 2005-07-19.
$64,385 with U.S. Army Corps of Engineers - civil program financing only for Land Treatment Practices Services (plowing/clearing, etc.). Signed on 2005-09-23. Completion date: 2005-12-31.
$64,385 with Army for Land Treatment Practices Services (plowing/clearing, etc.). Signed on 2005-09-23. Completion date: 2005-12-31.
$30,754 with Army for Landscaping/Groundskeeping Services. Signed on 2006-02-08. Completion date: 2005-10-31.
Top industries in this zip code by the number of employees in 2005:
Wholesale Trade: Other Grocery and Related Products Merchant Wholesalers (20-49 employees: 1 establishment)
Wholesale Trade: Grain and Field Bean Merchant Wholesalers (10-19: 1, 1-4: 2)
Finance and Insurance: Commercial Banking (10-19: 1)
Accommodation and Food Services: Full-Service Restaurants (10-19: 1)
Other Services (except Public Administration): Beauty Salons (10-19: 1)
Construction: Site Preparation Contractors (1-4: 4)
Fatal accident statistics in 2014:
Fatal accident count: 2
Vehicles involved in fatal accidents: 3
Fatal accidents caused by drunken drivers: 2
Fatalities: 2
Persons involved in fatal accidents: 4
Pedestrians involved in fatal accidents: 0
Fatal accident statistics in 2013:
Fatal accident count: 3
Vehicles involved in fatal accidents: 4
Fatal accidents caused by drunken drivers: 2
Fatalities: 3
Persons involved in fatal accidents: 4
Pedestrians involved in fatal accidents: 0
Home Mortgage Disclosure Act Aggregated Statistics For Year 2009 (Based on 2 partial tracts)
A) FHA, FSA/RHS & VA Home Purchase Loans
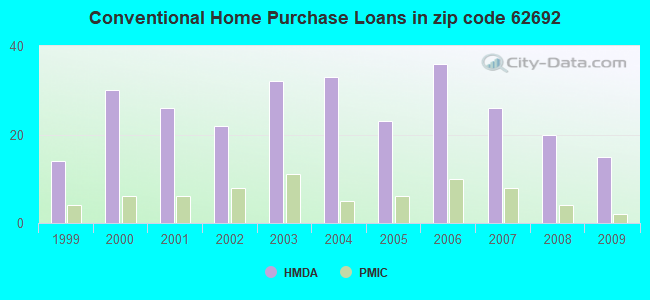
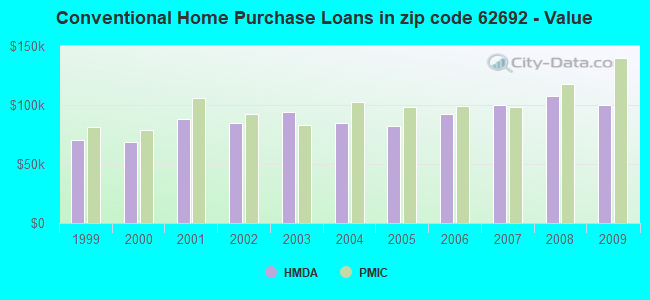
B) Conventional Home Purchase Loans
C) Refinancings
D) Home Improvement Loans
E) Loans on Dwellings For 5+ Families
F) Non-occupant Loans on < 5 Family Dwellings (A B C & D)
G) Loans On Manufactured Home Dwelling (A B C & D)
Number
Average Value
Number
Average Value
Number
Average Value
Number
Average Value
Number
Average Value
Number
Average Value
Number
Average Value
LOANS ORIGINATED
6
$100,503
15
$100,287
111
$114,871
6
$26,512
1
$121,330
5
$52,510
2
$28,405
APPLICATIONS APPROVED, NOT ACCEPTED
0
$0
0
$0
9
$94,687
1
$5,680
0
$0
0
$0
0
$0
APPLICATIONS DENIED
1
$91,710
3
$48,427
12
$106,286
2
$45,650
0
$0
0
$0
2
$22,725
APPLICATIONS WITHDRAWN
0
$0
0
$0
7
$107,363
1
$8,520
0
$0
0
$0
0
$0
FILES CLOSED FOR INCOMPLETENESS
0
$0
0
$0
0
$0
0
$0
0
$0
0
$0
0
$0
Aggregated Statistics For Year 2008 (Based on 2 partial tracts)
A) FHA, FSA/RHS & VA Home Purchase Loans
B) Conventional Home Purchase Loans
C) Refinancings
D) Home Improvement Loans
F) Non-occupant Loans on < 5 Family Dwellings (A B C & D)
G) Loans On Manufactured Home Dwelling (A B C & D)
Number
Average Value
Number
Average Value
Number
Average Value
Number
Average Value
Number
Average Value
Number
Average Value
LOANS ORIGINATED
9
$96,174
20
$107,699
56
$104,124
10
$14,162
7
$50,261
3
$60,060
APPLICATIONS APPROVED, NOT ACCEPTED
0
$0
1
$50,320
1
$48,700
0
$0
0
$0
0
$0
APPLICATIONS DENIED
0
$0
4
$61,782
13
$112,625
4
$15,522
2
$63,915
1
$37,740
APPLICATIONS WITHDRAWN
0
$0
2
$101,655
5
$151,526
0
$0
0
$0
0
$0
FILES CLOSED FOR INCOMPLETENESS
0
$0
0
$0
1
$252,000
0
$0
0
$0
0
$0
Aggregated Statistics For Year 2007 (Based on 2 partial tracts)
A) FHA, FSA/RHS & VA Home Purchase Loans
B) Conventional Home Purchase Loans
C) Refinancings
D) Home Improvement Loans
F) Non-occupant Loans on < 5 Family Dwellings (A B C & D)
G) Loans On Manufactured Home Dwelling (A B C & D)
Number
Average Value
Number
Average Value
Number
Average Value
Number
Average Value
Number
Average Value
Number
Average Value
LOANS ORIGINATED
2
$124,985
26
$99,842
44
$100,187
9
$28,947
5
$77,184
3
$40,173
APPLICATIONS APPROVED, NOT ACCEPTED
0
$0
1
$138,380
4
$103,275
2
$42,000
0
$0
0
$0
APPLICATIONS DENIED
0
$0
4
$89,580
18
$91,598
4
$53,058
0
$0
2
$38,955
APPLICATIONS WITHDRAWN
0
$0
1
$158,260
15
$109,079
1
$30,430
0
$0
0
$0
FILES CLOSED FOR INCOMPLETENESS
0
$0
0
$0
2
$76,290
0
$0
0
$0
0
$0
Aggregated Statistics For Year 2006 (Based on 2 partial tracts)
A) FHA, FSA/RHS & VA Home Purchase Loans
B) Conventional Home Purchase Loans
C) Refinancings
D) Home Improvement Loans
E) Loans on Dwellings For 5+ Families
F) Non-occupant Loans on < 5 Family Dwellings (A B C & D)
G) Loans On Manufactured Home Dwelling (A B C & D)
Number
Average Value
Number
Average Value
Number
Average Value
Number
Average Value
Number
Average Value
Number
Average Value
Number
Average Value
LOANS ORIGINATED
4
$101,652
36
$92,522
34
$86,256
11
$27,557
1
$598,150
8
$61,631
2
$11,770
APPLICATIONS APPROVED, NOT ACCEPTED
0
$0
2
$94,350
4
$138,885
1
$6,090
0
$0
1
$116,460
0
$0
APPLICATIONS DENIED
0
$0
2
$101,655
18
$115,202
4
$74,160
0
$0
1
$73,040
0
$0
APPLICATIONS WITHDRAWN
0
$0
2
$134,725
11
$106,245
0
$0
0
$0
0
$0
0
$0
FILES CLOSED FOR INCOMPLETENESS
0
$0
1
$72,230
3
$136,620
0
$0
0
$0
0
$0
0
$0
Aggregated Statistics For Year 2005 (Based on 2 partial tracts)
A) FHA, FSA/RHS & VA Home Purchase Loans
B) Conventional Home Purchase Loans
C) Refinancings
D) Home Improvement Loans
F) Non-occupant Loans on < 5 Family Dwellings (A B C & D)
G) Loans On Manufactured Home Dwelling (A B C & D)
Number
Average Value
Number
Average Value
Number
Average Value
Number
Average Value
Number
Average Value
Number
Average Value
LOANS ORIGINATED
3
$101,043
23
$81,901
37
$99,849
12
$22,827
3
$27,460
3
$59,110
APPLICATIONS APPROVED, NOT ACCEPTED
0
$0
3
$86,163
10
$89,398
1
$285,280
0
$0
0
$0
APPLICATIONS DENIED
1
$88,460
7
$74,436
19
$97,905
4
$29,218
2
$37,130
2
$22,725
APPLICATIONS WITHDRAWN
0
$0
0
$0
7
$103,827
0
$0
0
$0
0
$0
FILES CLOSED FOR INCOMPLETENESS
0
$0
0
$0
1
$186,260
0
$0
0
$0
0
$0
Aggregated Statistics For Year 2004 (Based on 2 partial tracts)
A) FHA, FSA/RHS & VA Home Purchase Loans
B) Conventional Home Purchase Loans
C) Refinancings
D) Home Improvement Loans
F) Non-occupant Loans on < 5 Family Dwellings (A B C & D)
G) Loans On Manufactured Home Dwelling (A B C & D)
Number
Average Value
Number
Average Value
Number
Average Value
Number
Average Value
Number
Average Value
Number
Average Value
LOANS ORIGINATED
2
$120,115
33
$85,058
57
$99,357
17
$21,078
9
$71,286
2
$40,375
APPLICATIONS APPROVED, NOT ACCEPTED
0
$0
3
$98,880
3
$78,183
2
$15,015
0
$0
1
$49,100
APPLICATIONS DENIED
0
$0
7
$69,507
20
$85,441
5
$44,394
0
$0
1
$48,290
APPLICATIONS WITHDRAWN
0
$0
2
$158,260
7
$97,103
1
$92,930
0
$0
0
$0
FILES CLOSED FOR INCOMPLETENESS
0
$0
0
$0
2
$102,870
1
$40,580
0
$0
0
$0
Aggregated Statistics For Year 2003 (Based on 2 partial tracts)
A) FHA, FSA/RHS & VA Home Purchase Loans
B) Conventional Home Purchase Loans
C) Refinancings
D) Home Improvement Loans
F) Non-occupant Loans on < 5 Family Dwellings (A B C & D)
Number
Average Value
Number
Average Value
Number
Average Value
Number
Average Value
Number
Average Value
LOANS ORIGINATED
4
$109,362
32
$94,285
162
$87,901
8
$25,769
9
$73,179
APPLICATIONS APPROVED, NOT ACCEPTED
0
$0
1
$189,910
7
$95,479
0
$0
0
$0
APPLICATIONS DENIED
0
$0
4
$77,305
20
$83,798
4
$15,115
0
$0
APPLICATIONS WITHDRAWN
0
$0
2
$93,130
11
$93,224
0
$0
0
$0
FILES CLOSED FOR INCOMPLETENESS
0
$0
0
$0
1
$104,700
0
$0
0
$0
Aggregated Statistics For Year 2002 (Based on 2 partial tracts)
A) FHA, FSA/RHS & VA Home Purchase Loans
B) Conventional Home Purchase Loans
C) Refinancings
D) Home Improvement Loans
F) Non-occupant Loans on < 5 Family Dwellings (A B C & D)
Number
Average Value
Number
Average Value
Number
Average Value
Number
Average Value
Number
Average Value
LOANS ORIGINATED
5
$96,256
22
$85,034
140
$91,253
13
$22,568
6
$69,798
APPLICATIONS APPROVED, NOT ACCEPTED
1
$73,450
1
$96,580
7
$107,594
1
$8,520
0
$0
APPLICATIONS DENIED
0
$0
5
$39,362
19
$89,019
3
$16,910
0
$0
APPLICATIONS WITHDRAWN
0
$0
2
$87,245
11
$79,389
0
$0
2
$49,305
FILES CLOSED FOR INCOMPLETENESS
0
$0
0
$0
2
$57,420
0
$0
0
$0
Aggregated Statistics For Year 2001 (Based on 2 partial tracts)
A) FHA, FSA/RHS & VA Home Purchase Loans
B) Conventional Home Purchase Loans
C) Refinancings
D) Home Improvement Loans
F) Non-occupant Loans on < 5 Family Dwellings (A B C & D)
Number
Average Value
Number
Average Value
Number
Average Value
Number
Average Value
Number
Average Value
LOANS ORIGINATED
6
$88,127
26
$88,199
97
$85,946
17
$42,561
4
$95,262
APPLICATIONS APPROVED, NOT ACCEPTED
0
$0
1
$64,930
9
$69,482
2
$24,955
0
$0
APPLICATIONS DENIED
0
$0
6
$51,537
19
$71,357
3
$16,910
0
$0
APPLICATIONS WITHDRAWN
0
$0
2
$60,870
11
$94,183
1
$40,990
0
$0
FILES CLOSED FOR INCOMPLETENESS
0
$0
0
$0
1
$67,770
0
$0
0
$0
Aggregated Statistics For Year 2000 (Based on 2 partial tracts)
A) FHA, FSA/RHS & VA Home Purchase Loans
B) Conventional Home Purchase Loans
C) Refinancings
D) Home Improvement Loans
F) Non-occupant Loans on < 5 Family Dwellings (A B C & D)
Number
Average Value
Number
Average Value
Number
Average Value
Number
Average Value
Number
Average Value
LOANS ORIGINATED
3
$92,793
30
$69,067
24
$58,841
15
$16,394
5
$54,864
APPLICATIONS APPROVED, NOT ACCEPTED
0
$0
2
$74,465
2
$49,915
3
$18,667
0
$0
APPLICATIONS DENIED
0
$0
8
$42,355
10
$63,183
4
$34,900
1
$58,840
APPLICATIONS WITHDRAWN
0
$0
2
$93,945
4
$66,145
0
$0
0
$0
FILES CLOSED FOR INCOMPLETENESS
0
$0
0
$0
2
$91,915
0
$0
0
$0
Aggregated Statistics For Year 1999 (Based on 1 partial tract)
A) FHA, FSA/RHS & VA Home Purchase Loans
B) Conventional Home Purchase Loans
C) Refinancings
D) Home Improvement Loans
F) Non-occupant Loans on < 5 Family Dwellings (A B C & D)
Detailed PMIC statistics for the following Tracts:0035.00
2004 - 2018 National Fire Incident Reporting System (NFIRS) incidents
Based on the data from the years 2004 - 2018 the average number of fires per year is 9. The highest number of fire incidents - 21 took place in 2012, and the least - 0 in 2005. The data has an increasing trend.
When looking into fire subcategories, the most incidents belonged to: Structure Fires (44.1%), and Outside Fires (36.8%).
Fire incident types reported to NFIRS in Zip Code 62692


 Nearest zip codes: 62667, 62661, 62638, 62674, 62670, 62615.


 Based on the data from the years 2004 - 2018 the average number of fires per year is 9. The highest number of fire incidents - 21 took place in 2012, and the least - 0 in 2005. The data has an increasing trend.
 When looking into fire subcategories, the most incidents belonged to: Structure Fires (44.1%), and Outside Fires (36.8%).