Estimated zip code population in 2022: 2,561 Zip code population in 2010: 2,574 Zip code population in 2000: 2,972
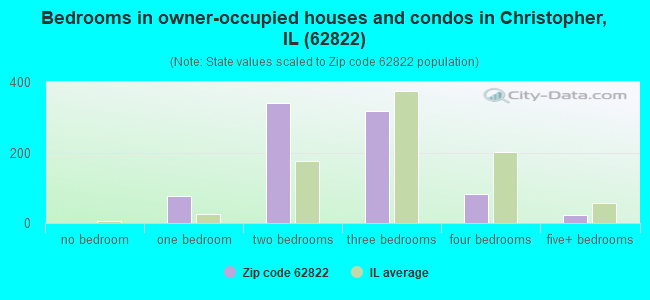
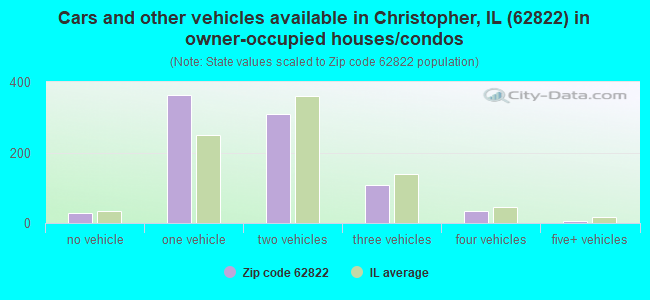
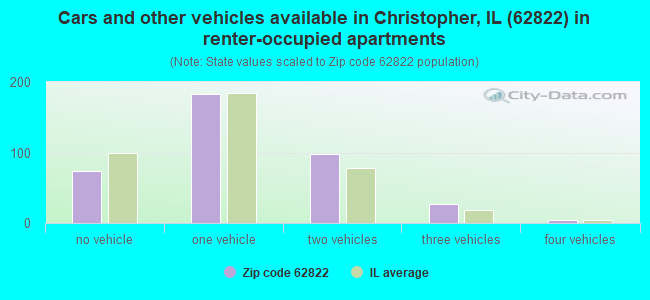
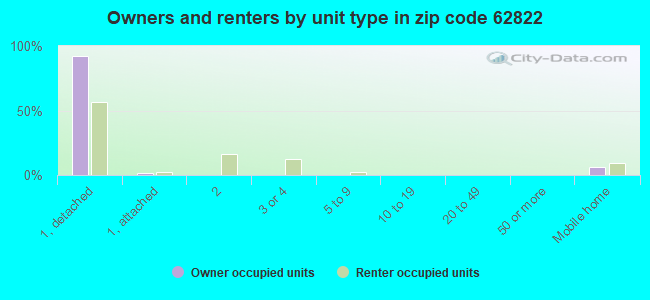
Houses and condos: 1,414 Renter-occupied apartments: 387
% of renters here:
32%
State:
33%
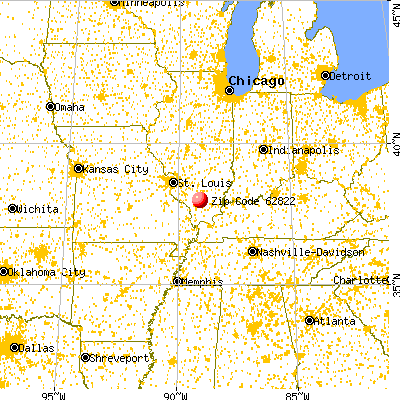
March 2022 cost of living index in zip code 62822: 73.7 (low, U.S. average is 100)
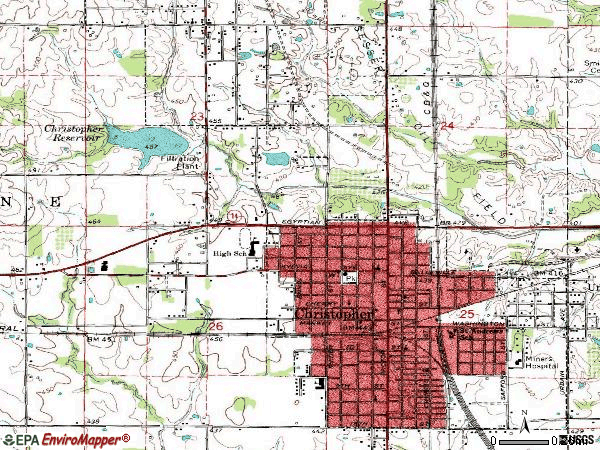
Land area: 2.7 sq. mi. Water area: 0.0 sq. mi.
Population density: 957 people per square mile
(low).
OSM Map
General Map
Google Map
MSN Map
OSM Map
General Map
Google Map
MSN Map
OSM Map
General Map
Google Map
MSN Map
OSM Map
General Map
Google Map
MSN Map
Please wait while loading the map...
Real estate property taxes paid for housing units in 2022:
This zip code:
1.4% ($1,040)
Illinois:
2.0% ($4,912)
Median real estate property taxes paid for housing units with mortgages in 2022: $937 (1.0%) Median real estate property taxes paid for housing units with no mortgage in 2022: $1,094 (1.7%)
Averages for the 2020 tax year for zip code 62822, filed in 2021:
Average Adjusted Gross Income (AGI) in 2020: $43,027 (Individual Income Tax Returns)
Here:
$43,027
State:
$82,626
Salary/wage: $37,413 (reported on 78.9% of returns)
Here:
$37,413
State:
$66,640
(% of AGI for various income ranges: 1069.5% for AGIs below $25k, 3092.4% for AGIs $25k-50k, 5475.6% for AGIs $50k-75k, 8475.7% for AGIs $75k-100k, 16055.0% for AGIs $100k-200k)
Taxable interest for individuals: $816 (reported on 19.5% of returns)
This zip code:
$816
Illinois:
$2,376
(% of AGI for various income ranges: 10.2% for AGIs below $25k, 5.5% for AGIs $25k-50k, 45.0% for AGIs $50k-75k, 27.1% for AGIs $75k-100k, 90.0% for AGIs $100k-200k)
Ordinary dividends: $3,794 (reported on 13.3% of returns)
Here:
$3,794
State:
$9,061
(% of AGI for various income ranges: 12.1% for AGIs below $25k, 22.4% for AGIs $25k-50k, 35.6% for AGIs $50k-75k, 221.4% for AGIs $75k-100k, 528.3% for AGIs $100k-200k)
Net capital gain/loss in AGI: +$2,946 (reported on 10.2% of returns)
Here:
+$2,946
State:
+$31,684
(% of AGI for various income ranges: 3.3% for AGIs below $25k, 21.7% for AGIs $25k-50k, 75.6% for AGIs $50k-75k, 51.4% for AGIs $75k-100k, 248.3% for AGIs $100k-200k)
Profit/loss from business: +$4,975 (reported on 9.4% of returns)
Here:
+$4,975
State:
+$12,175
(% of AGI for various income ranges: 80.7% for AGIs below $25k, 59.0% for AGIs $25k-50k, 54.4% for AGIs $50k-75k)
Taxable individual retirement arrangement distribution: $14,700 (reported on 7.8% of returns)
62822:
$14,700
Illinois:
$21,613
(% of AGI for various income ranges: 45.7% for AGIs below $25k, 94.1% for AGIs $25k-50k, 321.2% for AGIs $50k-75k, 818.3% for AGIs $100k-200k)
Earned income credit: $2,407 (reported on 23.4% of returns)
Here:
$2,407
State:
$2,311
(% of AGI for various income ranges: 115.0% for AGIs below $25k, 82.4% for AGIs $25k-50k)
Percentage of individuals using paid preparers for their 2020 taxes: 93.8%
Here:
94%
State:
93%
(% for various income ranges: 94.2% for AGIs below $25k, 94.1% for AGIs $25k-50k, 95.0% for AGIs $50k-75k, 100.0% for AGIs $75k-100k, 83.3% for AGIs $100k-200k)
Averages for the 2012 tax year for zip code 62822, filed in 2013:
Average Adjusted Gross Income (AGI) in 2012: $37,229 (Individual Income Tax Returns)
Here:
$37,229
State:
$68,058
Salary/wage: $33,160 (reported on 80.2% of returns)
Here:
$33,160
State:
$55,396
(% of AGI for various income ranges: 67.1% for AGIs below $25k, 74.3% for AGIs $25k-50k, 76.1% for AGIs $50k-75k, 67.6% for AGIs $75k-100k, 68.4% for AGIs $100k-200k)
Taxable interest for individuals: $1,200 (reported on 27.3% of returns)
This zip code:
$1,200
Illinois:
$1,969
(% of AGI for various income ranges: 1.5% for AGIs below $25k, 0.9% for AGIs $25k-50k, 0.7% for AGIs $50k-75k, 0.4% for AGIs $75k-100k, 0.9% for AGIs $100k-200k)
Ordinary dividends: $2,335 (reported on 16.5% of returns)
Here:
$2,335
State:
$7,786
(% of AGI for various income ranges: 0.9% for AGIs below $25k, 0.6% for AGIs $25k-50k, 0.8% for AGIs $50k-75k, 0.7% for AGIs $75k-100k, 2.2% for AGIs $100k-200k)
Net capital gain/loss in AGI: +$300 (reported on 9.1% of returns)
Here:
+$300
State:
+$22,183
(% of AGI for various income ranges: 0.8% for AGIs $100k-200k)
Profit/loss from business: +$6,500 (reported on 10.7% of returns)
Here:
+$6,500
State:
+$12,903
(% of AGI for various income ranges: 7.6% for AGIs below $25k, 1.3% for AGIs $25k-50k, 1.5% for AGIs $50k-75k)
Taxable individual retirement arrangement distribution: $10,367 (reported on 9.9% of returns)
62822:
$10,367
Illinois:
$17,929
(% of AGI for various income ranges: 2.5% for AGIs below $25k, 4.5% for AGIs $25k-50k, 8.0% for AGIs $75k-100k)
Total itemized deductions: $16,838 (23% of AGI, reported on 10.7% of returns)
Here:
$16,838
State:
$26,433
Here:
22.9% of AGI
State:
19.2% of AGI
(% of AGI for various income ranges: 5.4% for AGIs $25k-50k, 8.2% for AGIs $50k-75k, 7.7% for AGIs $100k-200k)
Charity contributions: $3,588 (reported on 6.6% of returns)
Here:
$3,588
State:
$4,525
(% of AGI for various income ranges: 0.7% for AGIs $25k-50k, 1.1% for AGIs $50k-75k, 1.0% for AGIs $100k-200k)
Taxes paid: $5,077 (reported on 10.7% of returns)
62822:
$5,077
State:
$11,968
(% of AGI for various income ranges: 1.0% for AGIs $25k-50k, 2.0% for AGIs $50k-75k, 3.7% for AGIs $100k-200k)
Earned income credit: $2,362 (reported on 24.0% of returns)
Here:
$2,362
State:
$2,349
(% of AGI for various income ranges: 7.6% for AGIs below $25k, 1.3% for AGIs $25k-50k)
Percentage of individuals using paid preparers for their 2012 taxes: 59.5%
Here:
60%
State:
57%
(% for various income ranges: 57.1% for AGIs below $25k, 58.8% for AGIs $25k-50k, 62.5% for AGIs $50k-75k, 62.5% for AGIs $75k-100k, 71.4% for AGIs $100k-200k)
Averages for the 2004 tax year for zip code 62822, filed in 2005:
Average Adjusted Gross Income (AGI) in 2004: $28,979 (Individual Income Tax Returns)
Here:
$28,979
State:
$54,625
Salary/wage: $26,652 (reported on 80.0% of returns)
Here:
$26,652
State:
$46,811
(% of AGI for various income ranges: 76.9% for AGIs below $10k, 68.9% for AGIs $10k-25k, 77.3% for AGIs $25k-50k, 80.8% for AGIs $50k-75k, 74.0% for AGIs $75k-100k, 54.6% for AGIs over 100k)
Taxable interest for individuals: $2,183 (reported on 37.1% of returns)
This zip code:
$2,183
Illinois:
$2,101
(% of AGI for various income ranges: 7.0% for AGIs below $10k, 3.6% for AGIs $10k-25k, 2.8% for AGIs $25k-50k, 1.7% for AGIs $50k-75k, 0.6% for AGIs $75k-100k, 4.1% for AGIs over 100k)
Taxable dividends: $1,483 (reported on 18.4% of returns)
Here:
$1,483
State:
$4,306
(% of AGI for various income ranges: 2.1% for AGIs below $10k, 0.8% for AGIs $10k-25k, 0.8% for AGIs $25k-50k, 1.3% for AGIs $50k-75k, 0.8% for AGIs $75k-100k, 0.8% for AGIs over 100k)
Net capital gain/loss: +$697 (reported on 11.6% of returns)
Here:
+$697
State:
+$17,321
(% of AGI for various income ranges: -0.7% for AGIs below $10k, -0.0% for AGIs $10k-25k, 0.4% for AGIs $25k-50k, 0.2% for AGIs $50k-75k, 0.1% for AGIs $75k-100k, 0.9% for AGIs over 100k)
Profit/loss from business: +$2,612 (reported on 11.6% of returns)
Here:
+$2,612
State:
+$11,771
(% of AGI for various income ranges: 6.9% for AGIs below $10k, 3.5% for AGIs $10k-25k, -0.3% for AGIs $25k-50k, 1.1% for AGIs $50k-75k)
IRA payment deduction: $1,538 (reported on 1.0% of returns)
62822:
$1,538
Illinois:
$3,087
Total itemized deductions: $13,542 (23% of AGI, reported on 10.0% of returns)
Here:
$13,542
State:
$20,239
Here:
23.3% of AGI
State:
19.5% of AGI
(% of AGI for various income ranges: 4.9% for AGIs $10k-25k, 4.2% for AGIs $25k-50k, 4.6% for AGIs $50k-75k, 5.9% for AGIs $75k-100k, 6.4% for AGIs over 100k)
Charity contributions deductions: $3,062 (5% of AGI, reported on 7.3% of returns)
Here:
$3,062
State:
$3,719
Here:
5.0% of AGI
State:
3.4% of AGI
(% of AGI for various income ranges: 0.5% for AGIs $10k-25k, 0.6% for AGIs $25k-50k, 0.8% for AGIs $50k-75k, 1.4% for AGIs $75k-100k, 1.5% for AGIs over 100k)
Total tax: $3,409 (reported on 69.8% of returns)
62822:
$3,409
State:
$9,882
(% of AGI for various income ranges: 2.1% for AGIs below $10k, 3.6% for AGIs $10k-25k, 6.7% for AGIs $25k-50k, 9.0% for AGIs $50k-75k, 11.9% for AGIs $75k-100k, 17.7% for AGIs over 100k)
Earned income credit: $1,662 (reported on 23.0% of returns)
Here:
$1,662
State:
$1,788
Percentage of individuals using paid preparers for their 2004 taxes: 64.6%
Here:
65%
State:
61%
(% for various income ranges: 60.8% for AGIs below $10k, 64.9% for AGIs $10k-25k, 64.9% for AGIs $25k-50k, 66.7% for AGIs $50k-75k, 62.7% for AGIs $75k-100k, 90.3% for AGIs over 100k)
Household received Food Stamps/SNAP in the past 12 months: 351 Household did not receive Food Stamps/SNAP in the past 12 months: 898
Women who had a birth in the past 12 months: 12 (12 now married, 0 unmarried) Women who did not have a birth in the past 12 months: 418 (191 now married, 225 unmarried)
Housing units in zip code 62822 with a mortgage: 281 (12 second mortgage, 12 both second mortgage and home equity loan) Median monthly owner costs for units with a mortgage: $879 Median monthly owner costs for units without a mortgage: $413
Residents with income below the poverty level in 2022:
This zip code:
21.8%
Whole state:
11.9%
Residents with income below 50% of the poverty level in 2022:
This zip code:
12.8%
Whole state:
5.7%
Median number of rooms in houses and condos:
Here:
5.7
State:
6.4
Median number of rooms in apartments:
Here:
4.1
State:
4.1
Notable locations in this zip code not listed on our city pages
Size of family households: 302 2-persons, 165 3-persons, 83 4-persons, 85 5-persons, 2 6-persons, 5 7-or-more-persons
Size of nonfamily households: 520 1-person, 58 2-persons, 6 3-persons
345 married couples with children.
160 single-parent households (66 men, 94 women).
98.8% of residents of 62822 zip code speak English at home.
0.9% of residents speak Spanish at home (19% very well, 24% well, 57% not well).
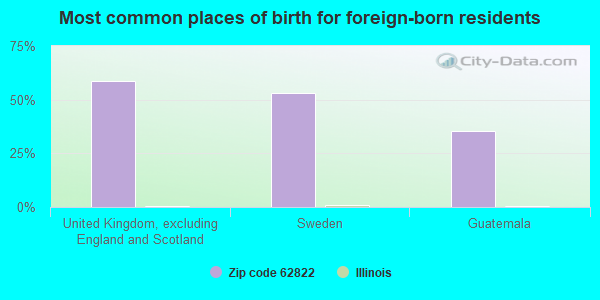
Foreign born population: 17 (0.7%) (70.8% of them are naturalized citizens)
This zip code:
0.7%
Whole state:
14.4%
59%United Kingdom, excluding England and Scotland
53%Sweden
35%Guatemala
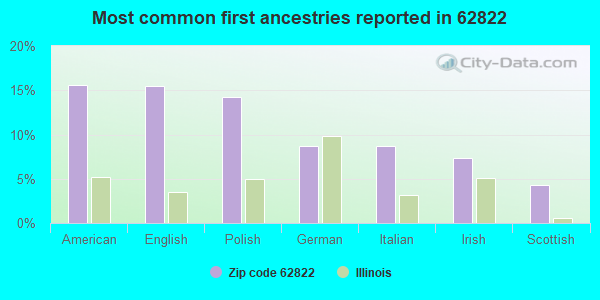
16%American
15%English
14%Polish
9%German
9%Italian
7%Irish
4%Scottish
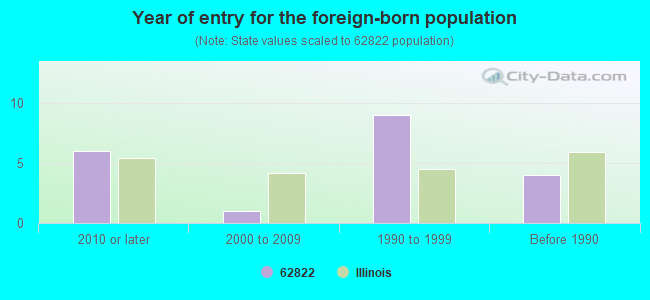
Year of entry for the foreign-born population
62010 or later
12000 to 2009
91990 to 1999
4Before 1990
Facilities with environmental interests located in this zip code:
CHRISTOPHER STP (EAST 15TH STREET in CHRISTOPHER, IL)
STATE MASTER (Illinois EPA Project) - National Pollutant Discharge Elimination System Permit National Pollutant Discharge Elimination System NON-MAJOR (Tracking pollutant discharge elimination systems) - permit National Pollutant Discharge Elimination System NON-MAJOR (Tracking pollutant discharge elimination systems) - permit Business SIC classification: SEWERAGE SYSTEMS Alternative names: CHRISTOPHER, CITY OF, CHRISTOPHER STP, CITY OF
CHRISTOPHER ELEM SCHOOL (501 S SNIDER ST in CHRISTOPHER, IL)
(National Center for Education Statistics) - STATE ID-2102809902001 Organizations: CHRISTOPHER UNIT 99 (SCHOOL DISTRICT)
CHRISTOPHER HIGH (1 BEARCAT DRIVE in CHRISTOPHER, IL)
(National Center for Education Statistics) - STATE ID-2102809900001 Organizations: CHRISTOPHER UNIT 99 (SCHOOL DISTRICT)
HALL OIL CO INC (EAST 15TH STREET in CHRISTOPHER, IL)
AIR MINOR (AIRS/AFS) CRITERIA AND HAZARDOUS AIR POLLUTANT INVENTORY (Inventory of air pollution sources) Business SIC classification: PETROLEUM BULK STATIONS AND TERMINALS Alternative names: BILLY B. HALL
PRESTIGE CUSTOM TRAILERS (OLD HWY 14 W in CHRISTOPHER, IL)
Small Quantity Generators, between 100 kg and 1000 kg of hazardous waste/month (Resource Conservation and Recovery Act (tracking hazardous waste)) - notification Organizations: PRESTIGE CUSTOM TRAILERS INC (CONTACT/OWNER)
Housing units lacking complete plumbing facilities: 5.2% Housing units lacking complete kitchen facilities: 7.2%
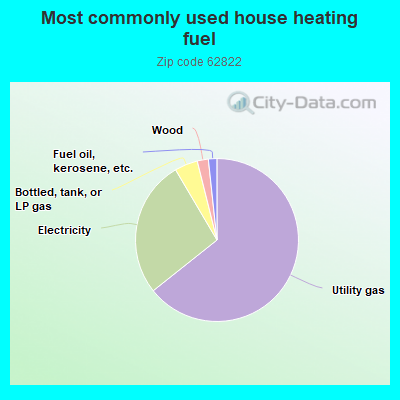
64.5%Utility gas
27.3%Electricity
4.6%Bottled, tank, or LP gas
2.2%Wood
1.7%Fuel oil, kerosene, etc.
Population in 1990: 5,042.
Place of birth for U.S.-born residents:
This state: 2,098
Northeast: 14
Midwest: 152
South: 114
West: 150
59% of the 62822 zip code residents lived in the same house 5 years ago. Out of people who lived in different houses, 67% lived in this county. Out of people who lived in different counties, 50% lived in Illinois.
89% of the 62822 zip code residents lived in the same house 1 year ago. Out of people who lived in different houses, 40% moved from this county. Out of people who lived in different houses, 40% moved from different county within same state. Out of people who lived in different houses, 22% moved from different state.
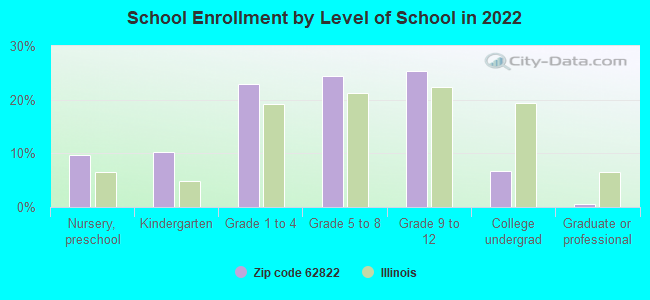
Private vs. public school enrollment:
Students in private schools in grades 1 to 8 (elementary and middle school):
Here:
0.0%
Illinois:
13.3%
Students in private schools in grades 9 to 12 (high school): 7
Here:
6.1%
Illinois:
9.9%
Students in private undergraduate colleges: 1
Here:
5.3%
Illinois:
27.4%
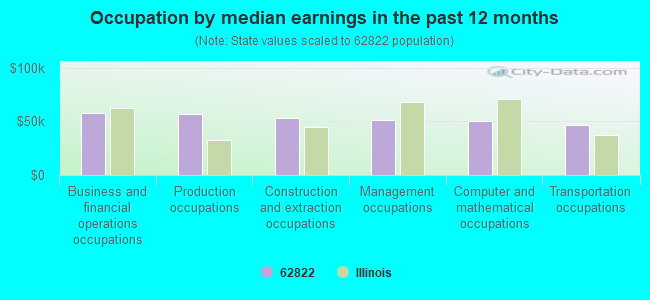
Occupation by median earnings in the past 12 months ($)
58,142Business and financial operations occupations
56,744Production occupations
53,492Construction and extraction occupations
51,460Management occupations
50,562Computer and mathematical occupations
47,086Transportation occupations
Top industries in this zip code by the number of employees in 2005:
Health Care and Social Assistance: All Other Outpatient Care Centers (100-249 employees: 1 establishment)
Accommodation and Food Services: Full-Service Restaurants (20-49: 2, 10-19: 1)
Educational Services: Fine Arts Schools (10-19: 1)
Finance and Insurance: Commercial Banking (10-19: 1)
Wholesale Trade: Beer and Ale Merchant Wholesalers (10-19: 1)
2002 - 2018 National Fire Incident Reporting System (NFIRS) incidents
According to the data from the years 2002 - 2018 the average number of fires per year is 12. The highest number of reported fires - 24 took place in 2017, and the least - 4 in 2006. The data has a declining trend.
When looking into fire subcategories, the most reports belonged to: Structure Fires (60.3%), and Outside Fires (22.5%).
Fire incident types reported to NFIRS in Zip Code 62822


 Nearest zip codes: 62865, 62825, 62819, 62891, 62999, 62983.


 According to the data from the years 2002 - 2018 the average number of fires per year is 12. The highest number of reported fires - 24 took place in 2017, and the least - 4 in 2006. The data has a declining trend.
 When looking into fire subcategories, the most reports belonged to: Structure Fires (60.3%), and Outside Fires (22.5%).