Estimated zip code population in 2022: 1,500 Zip code population in 2010: 1,504 Zip code population in 2000: 1,453
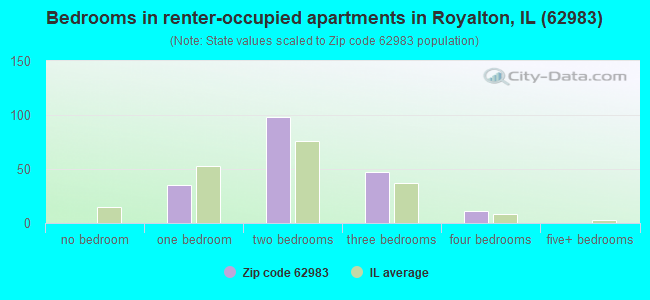
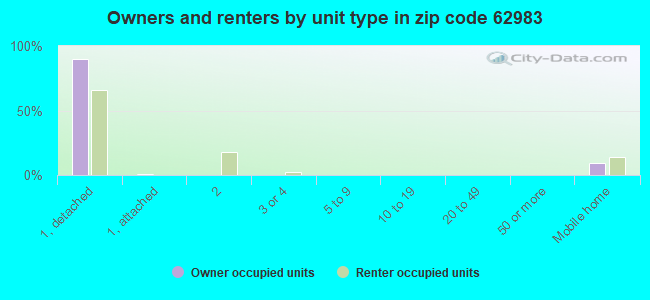
Houses and condos: 792 Renter-occupied apartments: 194
% of renters here:
27%
State:
33%
March 2022 cost of living index in zip code 62983: 84.0 (less than average, U.S. average is 100)
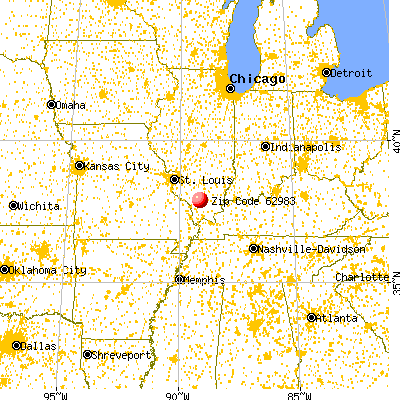
Land area: 20.2 sq. mi. Water area: 0.2 sq. mi.
Population density: 74 people per square mile
(very low).
OSM Map
General Map
Google Map
MSN Map
OSM Map
General Map
Google Map
MSN Map
OSM Map
General Map
Google Map
MSN Map
OSM Map
General Map
Google Map
MSN Map
Please wait while loading the map...
Real estate property taxes paid for housing units in 2022:
This zip code:
0.9% ($750)
Illinois:
2.0% ($4,912)
Median real estate property taxes paid for housing units with mortgages in 2022: $732 (0.7%) Median real estate property taxes paid for housing units with no mortgage in 2022: $772 (1.4%)
Business Search- 14 Million verified businesses
Males: 752
(50.2%)
Females: 747
(49.8%)
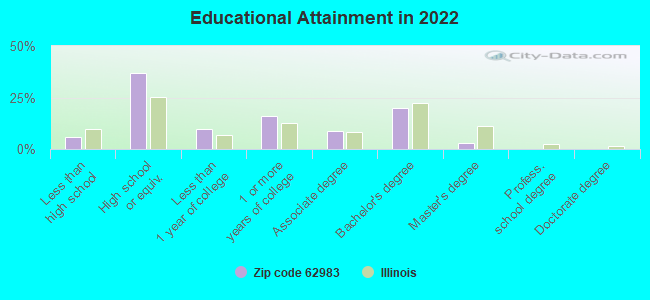
For population 25 years and over in 62983:
High school or higher: 93.2%
Bachelor's degree or higher: 22.5%
Graduate or professional degree: 2.7%
Mean travel time to work (commute): 30.6 minutes
For population 15 years and over in 62983:
Never married: 20.5%
Now married: 55.8%
Separated: 4.7%
Widowed: 9.5%
Divorced: 9.5%
Zip code 62983 compared to state average:
Median household income below state average.
Median house value significantly below state average.
Unemployed percentage significantly below state average.
Black race population percentage significantly below state average.
Hispanic race population percentage significantly below state average.
Median age above state average.
Foreign-born population percentage significantly below state average.
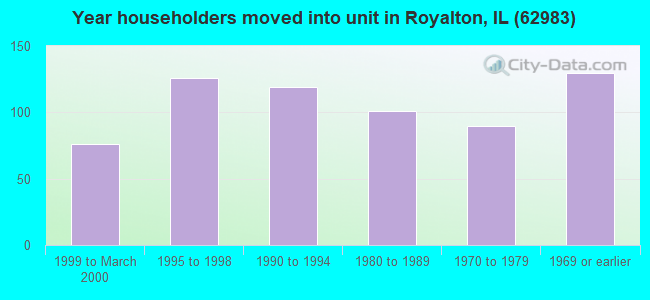
Length of stay since moving in significantly above state average.
Number of college students below state average.
Percentage of population with a bachelor's degree or higher below state average.
Averages for the 2020 tax year for zip code 62983, filed in 2021:
Average Adjusted Gross Income (AGI) in 2020: $50,492 (Individual Income Tax Returns)
Here:
$50,492
State:
$82,626
Salary/wage: $42,754 (reported on 82.0% of returns)
Here:
$42,754
State:
$66,640
(% of AGI for various income ranges: 1193.8% for AGIs below $25k, 3193.1% for AGIs $25k-50k, 4998.8% for AGIs $50k-75k, 8325.0% for AGIs $75k-100k, 15974.0% for AGIs $100k-200k)
Taxable interest for individuals: $412 (reported on 26.2% of returns)
This zip code:
$412
Illinois:
$2,376
(% of AGI for various income ranges: 9.4% for AGIs below $25k, 15.4% for AGIs $25k-50k, 6.2% for AGIs $50k-75k, 52.0% for AGIs $100k-200k)
Ordinary dividends: $1,943 (reported on 11.5% of returns)
Here:
$1,943
State:
$9,061
(% of AGI for various income ranges: 60.0% for AGIs $25k-50k, 145.0% for AGIs $75k-100k)
Net capital gain/loss in AGI: +$1,560 (reported on 8.2% of returns)
Here:
+$1,560
State:
+$31,684
(% of AGI for various income ranges: 17.5% for AGIs below $25k, 62.5% for AGIs $50k-75k)
Profit/loss from business: +$5,867 (reported on 9.8% of returns)
Here:
+$5,867
State:
+$12,175
(% of AGI for various income ranges: 89.4% for AGIs below $25k, 261.2% for AGIs $50k-75k)
Taxable individual retirement arrangement distribution: $6,400 (reported on 6.6% of returns)
62983:
$6,400
Illinois:
$21,613
(% of AGI for various income ranges: 196.9% for AGIs $25k-50k)
Earned income credit: $2,436 (reported on 18.0% of returns)
Here:
$2,436
State:
$2,311
(% of AGI for various income ranges: 100.0% for AGIs below $25k, 83.1% for AGIs $25k-50k)
Percentage of individuals using paid preparers for their 2020 taxes: 98.4%
Here:
98%
State:
93%
(% for various income ranges: 95.7% for AGIs below $25k, 100.0% for AGIs $25k-50k, 100.0% for AGIs $50k-75k, 100.0% for AGIs $75k-100k, 100.0% for AGIs $100k-200k)
Averages for the 2012 tax year for zip code 62983, filed in 2013:
Average Adjusted Gross Income (AGI) in 2012: $40,500 (Individual Income Tax Returns)
Here:
$40,500
State:
$68,058
Salary/wage: $33,689 (reported on 85.1% of returns)
Here:
$33,689
State:
$55,396
(% of AGI for various income ranges: 72.3% for AGIs below $25k, 72.1% for AGIs $25k-50k, 81.3% for AGIs $50k-75k, 75.8% for AGIs $75k-100k, 55.4% for AGIs $100k-200k)
Taxable interest for individuals: $794 (reported on 25.4% of returns)
This zip code:
$794
Illinois:
$1,969
(% of AGI for various income ranges: 1.1% for AGIs below $25k, 0.9% for AGIs $25k-50k, 0.2% for AGIs $50k-75k, 0.2% for AGIs $75k-100k, 0.2% for AGIs $100k-200k)
Ordinary dividends: $1,430 (reported on 14.9% of returns)
Here:
$1,430
State:
$7,786
(% of AGI for various income ranges: 0.6% for AGIs below $25k, 0.8% for AGIs $25k-50k, 1.6% for AGIs $75k-100k)
Profit/loss from business: +$5,138 (reported on 11.9% of returns)
Here:
+$5,138
State:
+$12,903
Taxable individual retirement arrangement distribution: $6,860 (reported on 7.5% of returns)
62983:
$6,860
Illinois:
$17,929
(% of AGI for various income ranges: 2.8% for AGIs below $25k, 3.7% for AGIs $25k-50k)
Total itemized deductions: $16,611 (18% of AGI, reported on 13.4% of returns)
Here:
$16,611
State:
$26,433
Here:
18.4% of AGI
State:
19.2% of AGI
(% of AGI for various income ranges: 5.5% for AGIs below $25k, 10.1% for AGIs $50k-75k, 10.1% for AGIs $100k-200k)
Charity contributions: $4,550 (reported on 9.0% of returns)
Here:
$4,550
State:
$4,525
Taxes paid: $5,756 (reported on 13.4% of returns)
62983:
$5,756
State:
$11,968
(% of AGI for various income ranges: 1.1% for AGIs below $25k, 3.2% for AGIs $50k-75k, 4.3% for AGIs $100k-200k)
Earned income credit: $2,493 (reported on 20.9% of returns)
Here:
$2,493
State:
$2,349
(% of AGI for various income ranges: 6.9% for AGIs below $25k, 1.2% for AGIs $25k-50k)
Percentage of individuals using paid preparers for their 2012 taxes: 64.2%
Here:
64%
State:
57%
(% for various income ranges: 58.1% for AGIs below $25k, 58.8% for AGIs $25k-50k, 70.0% for AGIs $50k-75k, 80.0% for AGIs $75k-100k, 100.0% for AGIs $100k-200k)
Averages for the 2004 tax year for zip code 62983, filed in 2005:
Average Adjusted Gross Income (AGI) in 2004: $29,510 (Individual Income Tax Returns)
Here:
$29,510
State:
$54,625
Salary/wage: $26,696 (reported on 82.5% of returns)
Here:
$26,696
State:
$46,811
(% of AGI for various income ranges: 76.7% for AGIs below $10k, 74.9% for AGIs $10k-25k, 75.0% for AGIs $25k-50k, 80.0% for AGIs $50k-75k, 83.3% for AGIs $75k-100k, 48.0% for AGIs over 100k)
Taxable interest for individuals: $1,031 (reported on 38.7% of returns)
This zip code:
$1,031
Illinois:
$2,101
(% of AGI for various income ranges: 5.9% for AGIs below $10k, 1.7% for AGIs $10k-25k, 1.5% for AGIs $25k-50k, 0.6% for AGIs $50k-75k, 0.4% for AGIs $75k-100k, 1.2% for AGIs over 100k)
Taxable dividends: $584 (reported on 13.3% of returns)
Here:
$584
State:
$4,306
(% of AGI for various income ranges: 1.6% for AGIs below $10k, 0.3% for AGIs $10k-25k, 0.2% for AGIs $25k-50k, 0.0% for AGIs $50k-75k, 0.5% for AGIs $75k-100k)
Net capital gain/loss: +$500 (reported on 7.5% of returns)
Here:
+$500
State:
+$17,321
(% of AGI for various income ranges: -1.7% for AGIs below $10k, -0.1% for AGIs $10k-25k, 0.0% for AGIs $25k-50k, 0.8% for AGIs $50k-75k)
Profit/loss from business: +$3,326 (reported on 13.3% of returns)
Here:
+$3,326
State:
+$11,771
(% of AGI for various income ranges: 0.4% for AGIs below $10k, 4.2% for AGIs $10k-25k, 2.5% for AGIs $25k-50k, -0.1% for AGIs $50k-75k)
Total itemized deductions: $15,958 (24% of AGI, reported on 10.7% of returns)
Here:
$15,958
State:
$20,239
Here:
23.6% of AGI
State:
19.5% of AGI
(% of AGI for various income ranges: 4.9% for AGIs $25k-50k, 6.3% for AGIs $50k-75k, 7.1% for AGIs $75k-100k, 18.9% for AGIs over 100k)
Charity contributions deductions: $3,420 (5% of AGI, reported on 7.5% of returns)
Here:
$3,420
State:
$3,719
Here:
4.8% of AGI
State:
3.4% of AGI
(% of AGI for various income ranges: 0.5% for AGIs $25k-50k, 0.7% for AGIs $50k-75k, 0.8% for AGIs $75k-100k, 4.2% for AGIs over 100k)
Total tax: $3,383 (reported on 67.5% of returns)
62983:
$3,383
State:
$9,882
(% of AGI for various income ranges: 2.1% for AGIs below $10k, 3.3% for AGIs $10k-25k, 6.6% for AGIs $25k-50k, 8.3% for AGIs $50k-75k, 11.6% for AGIs $75k-100k, 15.4% for AGIs over 100k)
Earned income credit: $1,817 (reported on 24.5% of returns)
Here:
$1,817
State:
$1,788
Percentage of individuals using paid preparers for their 2004 taxes: 67.6%
Here:
68%
State:
61%
(% for various income ranges: 59.4% for AGIs below $10k, 72.6% for AGIs $10k-25k, 67.6% for AGIs $25k-50k, 72.0% for AGIs $50k-75k, 57.1% for AGIs $75k-100k, 80.0% for AGIs over 100k)
Household received Food Stamps/SNAP in the past 12 months: 183 Household did not receive Food Stamps/SNAP in the past 12 months: 556
Women who did not have a birth in the past 12 months: 327 (177 now married, 148 unmarried)
Housing units in zip code 62983 with a mortgage: 212 (7 second mortgage, 7 both second mortgage and home equity loan) Median monthly owner costs for units with a mortgage: $1,030 Median monthly owner costs for units without a mortgage: $359
Residents with income below the poverty level in 2022:
This zip code:
14.7%
Whole state:
11.9%
Residents with income below 50% of the poverty level in 2022:
This zip code:
8.6%
Whole state:
5.7%
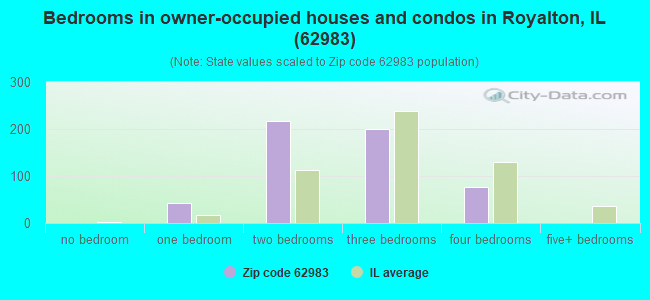
Median number of rooms in houses and condos:
Here:
6.0
State:
6.4
Median number of rooms in apartments:
Here:
4.5
State:
4.1
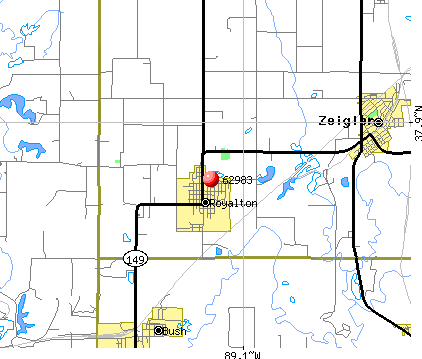
Notable locations in this zip code not listed on our city pages
Churches in zip code 62983 include: Apostolic Church of Royalton (A), Bible Way Revival Center (B), First Christian Church (C), Holy Protection Orthodox Church (D), Saint Aloysius Catholic Church (E). Display/hide their locations on the map
Cemeteries: Vaughn Cemetery (1), Wells Cemetery (2), Browning Cemetery (3), Butler Cemetery (4), Miners Cemetery (5), Moyers Cemetery (6), Osage Cemetery (7). Display/hide their locations on the map
Size of family households: 292 2-persons, 106 3-persons, 37 4-persons, 11 5-persons, 28 6-persons
Size of nonfamily households: 226 1-person, 29 2-persons
159 married couples with children.
108 single-parent households (24 men, 84 women).
99.6% of residents of 62983 zip code speak English at home.
Foreign born population: 0 (0.0%)
:
0.0%
Whole state:
14.4%
19%German
16%American
8%Polish
7%English
6%Irish
4%Scottish
4%Norwegian
Facilities with environmental interests located in this zip code:
ROYALTON STP (VILLAGE HALL in ROYALTON, IL)
STATE MASTER (Illinois EPA Project) - National Pollutant Discharge Elimination System Permit National Pollutant Discharge Elimination System NON-MAJOR (Tracking pollutant discharge elimination systems) - permit National Pollutant Discharge Elimination System NON-MAJOR (Tracking pollutant discharge elimination systems) - permit Business SIC classification: SEWERAGE SYSTEMS Alternative names: ROYALTON STP, VILLAGE OF
Housing units lacking complete plumbing facilities: 4.5% Housing units lacking complete kitchen facilities: 2.4%
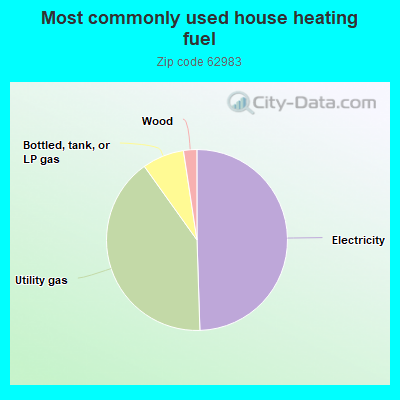
49.6%Electricity
40.7%Utility gas
7.5%Bottled, tank, or LP gas
2.4%Wood
Population in 1990: 1,344. Population change in the 1990s: +109 (+8.1%).
Place of birth for U.S.-born residents:
This state: 1,211
Northeast: 48
Midwest: 180
South: 38
West: 17
72% of the 62983 zip code residents lived in the same house 5 years ago. Out of people who lived in different houses, 61% lived in this county. Out of people who lived in different counties, 50% lived in Illinois.
88% of the 62983 zip code residents lived in the same house 1 year ago. Out of people who lived in different houses, 33% moved from this county. Out of people who lived in different houses, 64% moved from different county within same state. Out of people who lived in different houses, 5% moved from different state.
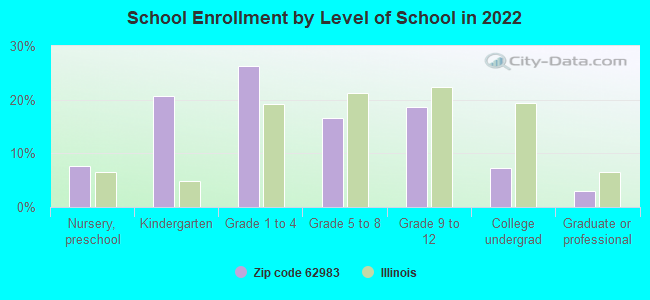
Private vs. public school enrollment:
Students in private schools in grades 1 to 8 (elementary and middle school): 48
Here:
46.5%
Illinois:
13.3%
Students in private schools in grades 9 to 12 (high school): 4
Here:
11.0%
Illinois:
9.9%
Students in private undergraduate colleges:
Here:
0.0%
Illinois:
27.4%
Occupation by median earnings in the past 12 months ($)
113,979Health diagnosing and treating practitioners and other technical occupations
93,860Construction and extraction occupations
54,753Law enforcement workers including supervisors
43,482Management occupations
43,460Health technologists and technicians
35,500Community and social service occupations
Top industries in this zip code by the number of employees in 2005:
Construction: All Other Specialty Trade Contractors (20-49 employees: 1 establishment)
Finance and Insurance: Commercial Banking (5-9: 1)
Accommodation and Food Services: Full-Service Restaurants (1-4: 2)
Construction: Poured Concrete Foundation and Structure Contractors (1-4: 1)
Construction: New Single-Family Housing Construction (except Operative Builders) (1-4: 1)
Other Services (except Public Administration): Religious Organizations (1-4: 1)
Other Services (except Public Administration): Funeral Homes and Funeral Services (1-4: 1)
Fatal accident statistics in 2013:
Fatal accident count: 1
Vehicles involved in fatal accidents: 2
Fatal accidents caused by drunken drivers: 1
Fatalities: 1
Persons involved in fatal accidents: 2
Pedestrians involved in fatal accidents: 0
2002 - 2018 National Fire Incident Reporting System (NFIRS) incidents
According to the data from the years 2002 - 2018 the average number of fires per year is 11. The highest number of reported fires - 26 took place in 2011, and the least - 0 in 2005. The data has a rising trend.
When looking into fire subcategories, the most reports belonged to: Structure Fires (54.2%), and Outside Fires (33.5%).
Fire incident types reported to NFIRS in Zip Code 62983


 Nearest zip codes: 62999, 62949, 62865, 62932, 62822, 62921.


 According to the data from the years 2002 - 2018 the average number of fires per year is 11. The highest number of reported fires - 26 took place in 2011, and the least - 0 in 2005. The data has a rising trend.
 When looking into fire subcategories, the most reports belonged to: Structure Fires (54.2%), and Outside Fires (33.5%).