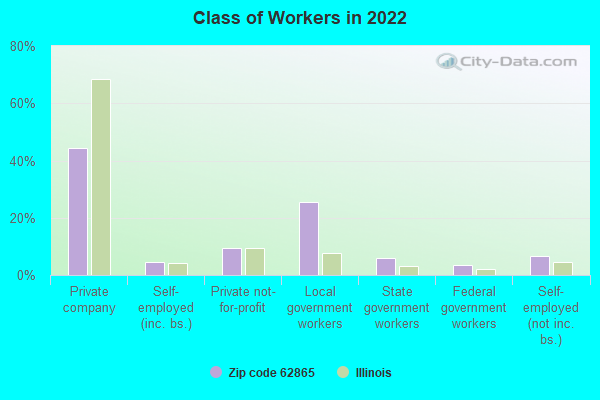
Estimated zip code population in 2022: 1,867 Zip code population in 2010: 2,018 Zip code population in 2000: 1,879
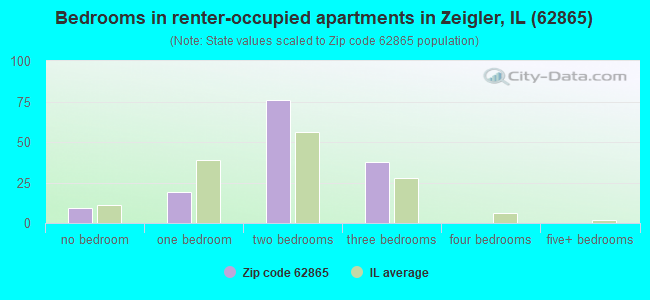
Houses and condos: 923 Renter-occupied apartments: 142
% of renters here:
16%
State:
33%
March 2022 cost of living index in zip code 62865: 84.7 (less than average, U.S. average is 100)
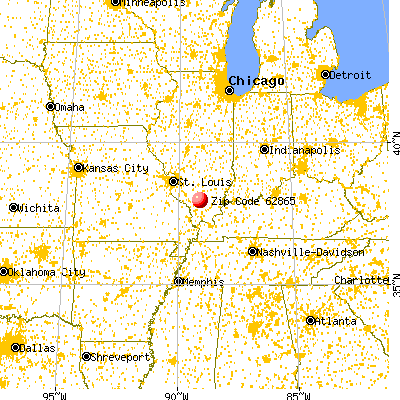
Land area: 54.5 sq. mi. Water area: 1.0 sq. mi.
Population density: 34 people per square mile
(very low).
OSM Map
General Map
Google Map
MSN Map
OSM Map
General Map
Google Map
MSN Map
OSM Map
General Map
Google Map
MSN Map
OSM Map
General Map
Google Map
MSN Map
Please wait while loading the map...
Real estate property taxes paid for housing units in 2022:
This zip code:
1.0% ($1,621)
Illinois:
2.0% ($4,912)
Median real estate property taxes paid for housing units with mortgages in 2022: $2,139 (1.2%) Median real estate property taxes paid for housing units with no mortgage in 2022: $1,529 (1.0%)
Business Search- 14 Million verified businesses
Males: 918
(49.2%)
Females: 949
(50.8%)
For population 25 years and over in 62865:
High school or higher: 90.0%
Bachelor's degree or higher: 29.2%
Graduate or professional degree: 6.1%
Unemployed: 2.7%
Mean travel time to work (commute): 23.3 minutes
For population 15 years and over in 62865:
Never married: 20.8%
Now married: 63.5%
Separated: 0.4%
Widowed: 3.6%
Divorced: 11.8%
Zip code 62865 compared to state average:
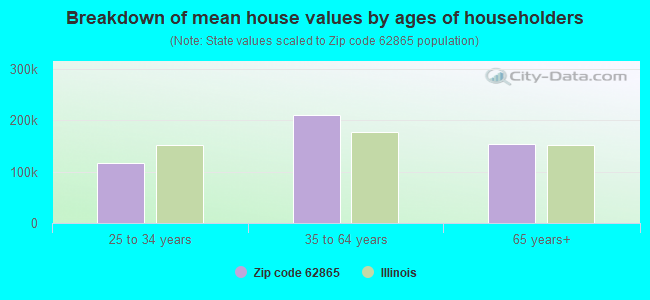
Median house value below state average.
Unemployed percentage below state average.
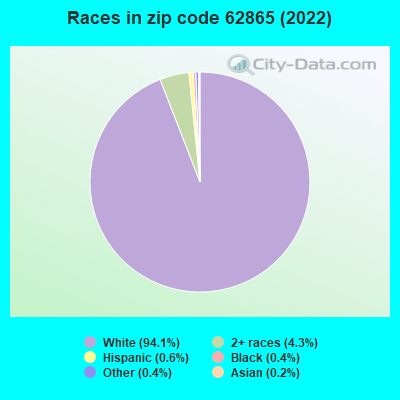
Black race population percentage significantly below state average.
Hispanic race population percentage significantly below state average.
Median age significantly above state average.
Foreign-born population percentage significantly below state average.
Renting percentage below state average.
Length of stay since moving in significantly above state average.
Averages for the 2020 tax year for zip code 62865, filed in 2021:
Average Adjusted Gross Income (AGI) in 2020: $63,398 (Individual Income Tax Returns)
Here:
$63,398
State:
$82,626
Salary/wage: $53,309 (reported on 79.1% of returns)
Here:
$53,309
State:
$66,640
(% of AGI for various income ranges: 1091.0% for AGIs below $25k, 3333.3% for AGIs $25k-50k, 5435.0% for AGIs $50k-75k, 10366.0% for AGIs $75k-100k, 16673.6% for AGIs $100k-200k)
Taxable interest for individuals: $1,052 (reported on 31.4% of returns)
This zip code:
$1,052
Illinois:
$2,376
(% of AGI for various income ranges: 23.3% for AGIs below $25k, 44.0% for AGIs $25k-50k, 16.0% for AGIs $50k-75k, 110.0% for AGIs $75k-100k, 89.1% for AGIs $100k-200k)
Ordinary dividends: $3,031 (reported on 18.6% of returns)
Here:
$3,031
State:
$9,061
(% of AGI for various income ranges: 22.4% for AGIs below $25k, 16.0% for AGIs $25k-50k, 62.0% for AGIs $50k-75k, 212.0% for AGIs $75k-100k, 223.6% for AGIs $100k-200k)
Net capital gain/loss in AGI: +$4,569 (reported on 15.1% of returns)
Here:
+$4,569
State:
+$31,684
(% of AGI for various income ranges: 25.2% for AGIs below $25k, 92.0% for AGIs $50k-75k, 308.0% for AGIs $75k-100k, 268.2% for AGIs $100k-200k)
Profit/loss from business: +$5,091 (reported on 12.8% of returns)
Here:
+$5,091
State:
+$12,175
(% of AGI for various income ranges: 58.6% for AGIs below $25k, 114.0% for AGIs $25k-50k, 160.0% for AGIs $50k-75k, 96.4% for AGIs $100k-200k)
Taxable individual retirement arrangement distribution: $14,211 (reported on 10.5% of returns)
62865:
$14,211
Illinois:
$21,613
(% of AGI for various income ranges: 92.9% for AGIs below $25k, 202.0% for AGIs $25k-50k, 1562.0% for AGIs $75k-100k)
Earned income credit: $2,167 (reported on 14.0% of returns)
Here:
$2,167
State:
$2,311
(% of AGI for various income ranges: 87.1% for AGIs below $25k, 51.3% for AGIs $25k-50k)
Percentage of individuals using paid preparers for their 2020 taxes: 94.2%
Here:
94%
State:
93%
(% for various income ranges: 96.3% for AGIs below $25k, 94.7% for AGIs $25k-50k, 92.3% for AGIs $50k-75k, 88.9% for AGIs $75k-100k, 94.4% for AGIs $100k-200k)
Averages for the 2012 tax year for zip code 62865, filed in 2013:
Average Adjusted Gross Income (AGI) in 2012: $49,825 (Individual Income Tax Returns)
Here:
$49,825
State:
$68,058
Salary/wage: $43,163 (reported on 84.3% of returns)
Here:
$43,163
State:
$55,396
(% of AGI for various income ranges: 67.1% for AGIs below $25k, 76.1% for AGIs $25k-50k, 81.2% for AGIs $50k-75k, 81.6% for AGIs $75k-100k, 64.9% for AGIs $100k-200k)
Taxable interest for individuals: $811 (reported on 31.5% of returns)
This zip code:
$811
Illinois:
$1,969
(% of AGI for various income ranges: 1.6% for AGIs below $25k, 0.4% for AGIs $25k-50k, 0.7% for AGIs $50k-75k, 0.2% for AGIs $75k-100k, 0.3% for AGIs $100k-200k)
Ordinary dividends: $1,560 (reported on 16.9% of returns)
Here:
$1,560
State:
$7,786
(% of AGI for various income ranges: 0.4% for AGIs below $25k, 0.2% for AGIs $25k-50k, 0.6% for AGIs $50k-75k, 0.5% for AGIs $75k-100k, 0.7% for AGIs $100k-200k)
Net capital gain/loss in AGI: +$1,778 (reported on 10.1% of returns)
Here:
+$1,778
State:
+$22,183
(% of AGI for various income ranges: 0.2% for AGIs below $25k, 0.2% for AGIs $50k-75k, 0.8% for AGIs $100k-200k)
Profit/loss from business: +$6,923 (reported on 14.6% of returns)
Here:
+$6,923
State:
+$12,903
(% of AGI for various income ranges: 5.4% for AGIs below $25k, 6.7% for AGIs $25k-50k, 1.8% for AGIs $75k-100k)
Taxable individual retirement arrangement distribution: $11,000 (reported on 9.0% of returns)
62865:
$11,000
Illinois:
$17,929
(% of AGI for various income ranges: 3.4% for AGIs below $25k, 3.9% for AGIs $25k-50k, 5.9% for AGIs $75k-100k)
Total itemized deductions: $20,357 (18% of AGI, reported on 15.7% of returns)
Here:
$20,357
State:
$26,433
Here:
17.5% of AGI
State:
19.2% of AGI
(% of AGI for various income ranges: 5.2% for AGIs $25k-50k, 6.0% for AGIs $50k-75k, 8.5% for AGIs $75k-100k, 8.1% for AGIs $100k-200k)
Charity contributions: $3,388 (reported on 9.0% of returns)
Here:
$3,388
State:
$4,525
(% of AGI for various income ranges: 0.6% for AGIs $25k-50k, 0.9% for AGIs $75k-100k, 1.0% for AGIs $100k-200k)
Taxes paid: $8,086 (reported on 15.7% of returns)
62865:
$8,086
State:
$11,968
(% of AGI for various income ranges: 1.0% for AGIs $25k-50k, 1.8% for AGIs $50k-75k, 2.6% for AGIs $75k-100k, 4.4% for AGIs $100k-200k)
Earned income credit: $1,887 (reported on 16.9% of returns)
Here:
$1,887
State:
$2,349
(% of AGI for various income ranges: 4.6% for AGIs below $25k, 1.0% for AGIs $25k-50k)
Percentage of individuals using paid preparers for their 2012 taxes: 65.2%
Here:
65%
State:
57%
(% for various income ranges: 63.9% for AGIs below $25k, 66.7% for AGIs $25k-50k, 64.3% for AGIs $50k-75k, 62.5% for AGIs $75k-100k, 70.0% for AGIs $100k-200k)
Averages for the 2004 tax year for zip code 62865, filed in 2005:
Average Adjusted Gross Income (AGI) in 2004: $35,926 (Individual Income Tax Returns)
Here:
$35,926
State:
$54,625
Salary/wage: $34,139 (reported on 83.4% of returns)
Here:
$34,139
State:
$46,811
(% of AGI for various income ranges: 83.6% for AGIs below $10k, 69.6% for AGIs $10k-25k, 79.4% for AGIs $25k-50k, 84.1% for AGIs $50k-75k, 88.1% for AGIs $75k-100k, 64.0% for AGIs over 100k)
Taxable interest for individuals: $1,360 (reported on 43.2% of returns)
This zip code:
$1,360
Illinois:
$2,101
(% of AGI for various income ranges: 4.2% for AGIs below $10k, 4.3% for AGIs $10k-25k, 1.9% for AGIs $25k-50k, 0.7% for AGIs $50k-75k, 0.9% for AGIs $75k-100k, 0.8% for AGIs over 100k)
Taxable dividends: $833 (reported on 24.2% of returns)
Here:
$833
State:
$4,306
(% of AGI for various income ranges: 1.5% for AGIs below $10k, 1.0% for AGIs $10k-25k, 1.0% for AGIs $25k-50k, 0.1% for AGIs $50k-75k, 0.1% for AGIs $75k-100k, 0.5% for AGIs over 100k)
Net capital gain/loss: +$992 (reported on 13.9% of returns)
Here:
+$992
State:
+$17,321
(% of AGI for various income ranges: 2.0% for AGIs $10k-25k, 0.5% for AGIs $25k-50k, 0.0% for AGIs $50k-75k, 0.0% for AGIs $75k-100k, -0.1% for AGIs over 100k)
Profit/loss from business: +$2,899 (reported on 15.0% of returns)
Here:
+$2,899
State:
+$11,771
(% of AGI for various income ranges: 12.4% for AGIs below $10k, 1.7% for AGIs $10k-25k, 2.0% for AGIs $25k-50k, 0.7% for AGIs $50k-75k, -0.2% for AGIs $75k-100k)
IRA payment deduction: $3,333 (reported on 1.7% of returns)
62865:
$3,333
Illinois:
$3,087
Total itemized deductions: $14,358 (19% of AGI, reported on 12.3% of returns)
Here:
$14,358
State:
$20,239
Here:
19.3% of AGI
State:
19.5% of AGI
(% of AGI for various income ranges: 3.9% for AGIs $10k-25k, 3.7% for AGIs $25k-50k, 4.2% for AGIs $50k-75k, 7.3% for AGIs $75k-100k, 7.6% for AGIs over 100k)
Charity contributions deductions: $2,260 (3% of AGI, reported on 8.9% of returns)
Here:
$2,260
State:
$3,719
Here:
2.7% of AGI
State:
3.4% of AGI
(% of AGI for various income ranges: 0.4% for AGIs $25k-50k, 0.5% for AGIs $50k-75k, 0.9% for AGIs $75k-100k, 1.3% for AGIs over 100k)
Total tax: $4,272 (reported on 74.7% of returns)
62865:
$4,272
State:
$9,882
(% of AGI for various income ranges: 2.9% for AGIs below $10k, 3.5% for AGIs $10k-25k, 6.5% for AGIs $25k-50k, 8.9% for AGIs $50k-75k, 10.6% for AGIs $75k-100k, 18.5% for AGIs over 100k)
Earned income credit: $1,823 (reported on 16.4% of returns)
Here:
$1,823
State:
$1,788
Percentage of individuals using paid preparers for their 2004 taxes: 65.8%
Here:
66%
State:
61%
(% for various income ranges: 51.7% for AGIs below $10k, 72.3% for AGIs $10k-25k, 65.8% for AGIs $25k-50k, 70.2% for AGIs $50k-75k, 68.2% for AGIs $75k-100k, 75.0% for AGIs over 100k)
Household received Food Stamps/SNAP in the past 12 months: 129 Household did not receive Food Stamps/SNAP in the past 12 months: 743
Women who had a birth in the past 12 months: 14 (1 now married, 12 unmarried) Women who did not have a birth in the past 12 months: 378 (175 now married, 201 unmarried)
Housing units in zip code 62865 with a mortgage: 209 (29 second mortgage, 29 both second mortgage and home equity loan) Median monthly owner costs for units with a mortgage: $1,572 Median monthly owner costs for units without a mortgage: $491
Residents with income below the poverty level in 2022:
This zip code:
4.5%
Whole state:
11.9%
Residents with income below 50% of the poverty level in 2022:
This zip code:
3.1%
Whole state:
5.7%
Median number of rooms in houses and condos:
Here:
6.4
State:
6.4
Median number of rooms in apartments:
Here:
4.5
State:
4.1
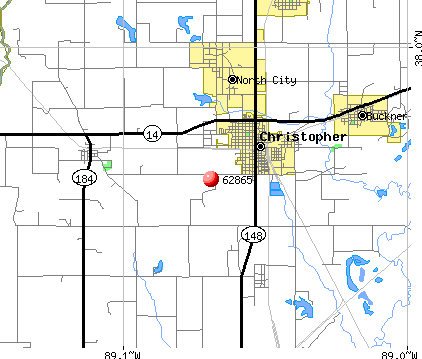
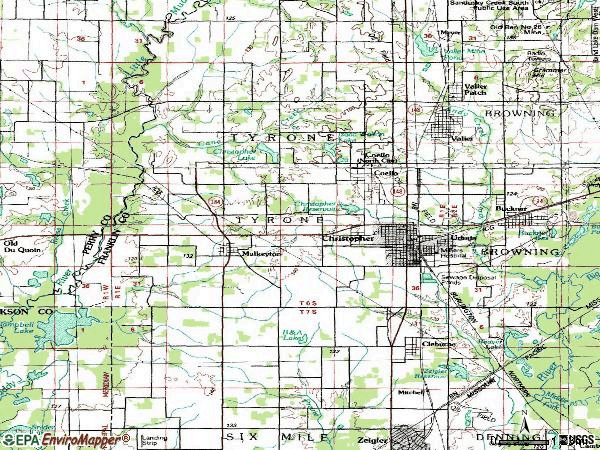
Notable locations in this zip code not listed on our city pages
Churches in zip code 62865 include: Buggtussel Church (A), Creek Nation Church (B), Greenwood Church (C), Minor Church (D). Display/hide their locations on the map
Cemeteries: Ward Cemetery (1), Youngblood Cemetery (2), Zeigler Cemetery (3), Mulkeytown Cemetery (4), Naylor Cemetery (5), Old Mulkeytown Cemetery (6), Reed Cemetery (7). Display/hide their locations on the map
Lakes and reservoirs: B and A Lake (A), Buckner Pond (B), Zeigler Reservoir (C), Beaver Lake (D), Christopher New Reservoir (E), Zeigler City Lake (F), Christopher Lake (G), Christopher Reservoir (H). Display/hide their locations on the map
Size of family households: 409 2-persons, 126 3-persons, 59 4-persons, 27 5-persons, 11 6-persons
Size of nonfamily households: 226 1-person, 10 2-persons
184 married couples with children.
26 single-parent households (6 men, 20 women).
97.8% of residents of 62865 zip code speak English at home.
0.7% of residents speak Spanish at home (100% very well).
0.7% of residents speak other Indo-European language at home (100% very well).
0.2% of residents speak Asian or Pacific Island language at home (100% very well).
0.4% of residents speak other language at home (100% very well).
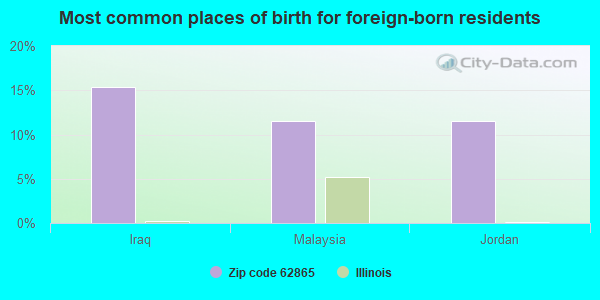
Foreign born population: 26 (1.4%) (19.4% of them are naturalized citizens)
This zip code:
1.4%
Whole state:
14.4%
15%Iraq
12%Malaysia
12%Jordan
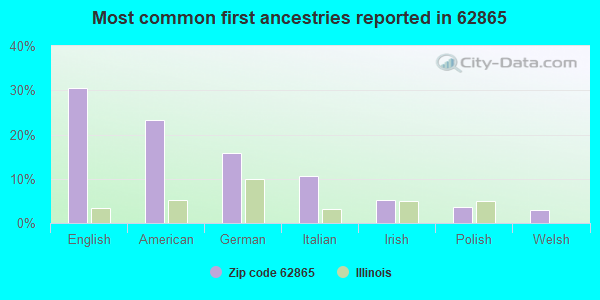
31%English
23%American
16%German
11%Italian
5%Irish
4%Polish
3%Welsh
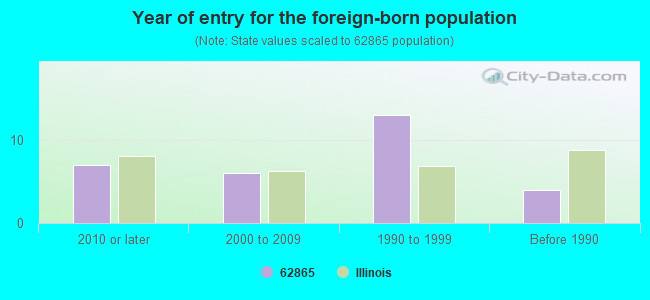
Year of entry for the foreign-born population
72010 or later
62000 to 2009
131990 to 1999
4Before 1990
Facilities with environmental interests located in this zip code:
HALLERMAN S SAWMILL (RT 2 in MULKEYTOWN, IL)
STATE MASTER (Illinois EPA Project) - AIR PROGRAM AIR MINOR (AIRS/AFS) Business SIC classification: SAWMILLS AND PLANING MILLS, GENERAL Alternative names: HALLERMAN'S SAWMILL
MICHEL GRAIN CO INC (MILL ST in MULKEYTOWN, IL)
STATE MASTER (Illinois EPA Project) - AIR PROGRAM AIR MINOR (AIRS/AFS) Business SIC classification: GRAIN AND FIELD BEANS
KING NOAH TRUCKING (RT. 2 BOX 242 in MULKEYTOWN, IL)
National Pollutant Discharge Elimination System NON-MAJOR (Tracking pollutant discharge elimination systems) - permit Organizations: KING NOAH JR (CONTACT/OWNER)
Housing units lacking complete plumbing facilities: 4.8% Housing units lacking complete kitchen facilities: 5.7%
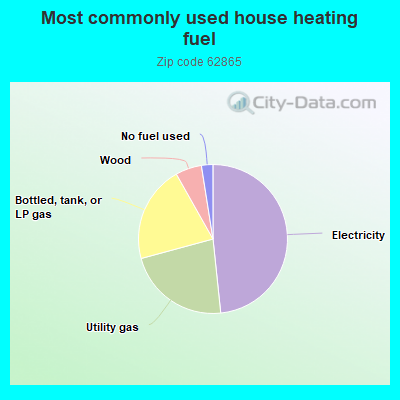
48.5%Electricity
22.5%Utility gas
21.1%Bottled, tank, or LP gas
5.7%Wood
2.5%No fuel used
Population in 1990: 474. Population change in the 1990s: +1,405 (+296.4%).
Place of birth for U.S.-born residents:
This state: 1,539
Midwest: 169
South: 94
West: 23
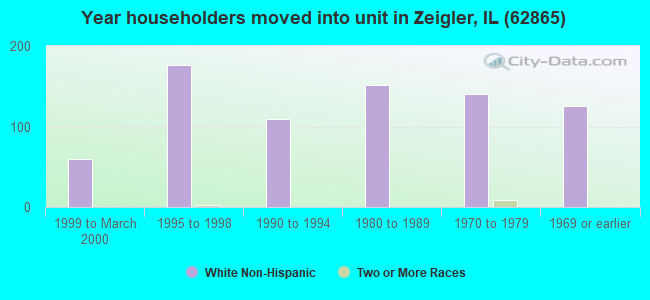
70% of the 62865 zip code residents lived in the same house 5 years ago. Out of people who lived in different houses, 66% lived in this county. Out of people who lived in different counties, 50% lived in Illinois.
96% of the 62865 zip code residents lived in the same house 1 year ago. Out of people who lived in different houses, 95% moved from this county.
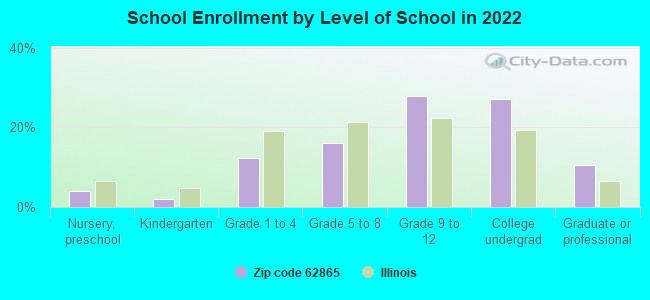
Private vs. public school enrollment:
Students in private schools in grades 1 to 8 (elementary and middle school):
Here:
0.0%
Illinois:
13.3%
Students in private schools in grades 9 to 12 (high school): 16
Here:
17.5%
Illinois:
9.9%
Students in private undergraduate colleges: 12
Here:
13.0%
Illinois:
27.4%
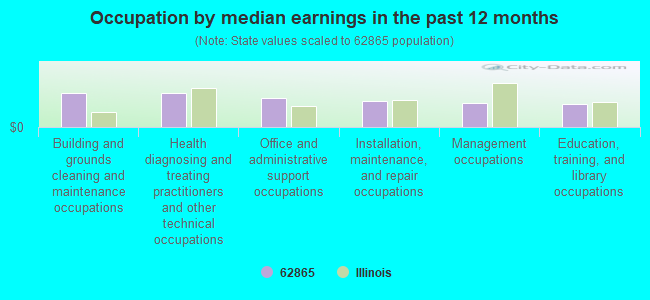
Occupation by median earnings in the past 12 months ($)
80,330Building and grounds cleaning and maintenance occupations
80,158Health diagnosing and treating practitioners and other technical occupations
68,443Office and administrative support occupations
62,264Installation, maintenance, and repair occupations
57,045Management occupations
55,259Education, training, and library occupations
Companies with federal contracts located in this zip code:
AVERY, PATTY (7641 CLAYBORNE in MULKEYTOWN, IL; small business) : $7,462 in 4 contractsin 2003
$7,595 with U.S. Army Corps of Engineers - civil program financing only for Operation of Government-Owned Facilities -- Recreation Facilities (Non-Building). Signed on 2003-02-18. Completion date: 2003-03-01.
$147, same as above.Signed on 2003-11-04. Completion date: 2003-03-01.
$147 with Army for Operation of Government-Owned Facilities -- Recreation Facilities (Non-Building). Signed on 2003-11-04. Completion date: 2003-03-01.
-$427 with U.S. Army Corps of Engineers - civil program financing only for Operation of Government-Owned Facilities -- Recreation Facilities (Non-Building). Signed on 2003-09-18. Completion date: 2003-03-01.
Top industries in this zip code by the number of employees in 2005:
Construction: New Single-Family Housing Construction (except Operative Builders) (5-9 employees: 1 establishment)
Arts, Entertainment, and Recreation: Fitness and Recreational Sports Centers (1-4: 2)
Utilities: Water Supply and Irrigation Systems (1-4: 1)
Professional, Scientific, and Technical Services: Other Scientific and Technical Consulting Services (1-4: 1)
Construction: Drywall and Insulation Contractors (1-4: 1)
Professional, Scientific, and Technical Services: Other Computer Related Services (1-4: 1)
People in group quarters in 2000:
17 people in other noninstitutional group quarters
Fatal accident statistics in 2013:
Fatal accident count: 1
Vehicles involved in fatal accidents: 1
Fatal accidents caused by drunken drivers: 1
Fatalities: 1
Persons involved in fatal accidents: 2
Pedestrians involved in fatal accidents: 0
Fatal accident statistics in 2011:
Fatal accident count: 1
Vehicles involved in fatal accidents: 1
Fatal accidents caused by drunken drivers: 0
Fatalities: 1
Persons involved in fatal accidents: 3
Pedestrians involved in fatal accidents: 0
2002 - 2018 National Fire Incident Reporting System (NFIRS) incidents
Based on the data from the years 2002 - 2018 the average number of fires per year is 9. The highest number of reported fire incidents - 17 took place in 2010, and the least - 4 in 2017. The data has a declining trend.
When looking into fire subcategories, the most incidents belonged to: Outside Fires (49.4%), and Structure Fires (32.5%).
Fire incident types reported to NFIRS in Zip Code 62865


 Nearest zip codes: 62822, 62825, 62891, 62819, 62983, 62999.


 Based on the data from the years 2002 - 2018 the average number of fires per year is 9. The highest number of reported fire incidents - 17 took place in 2010, and the least - 4 in 2017. The data has a declining trend.
 When looking into fire subcategories, the most incidents belonged to: Outside Fires (49.4%), and Structure Fires (32.5%).