Estimated median house/condo value in 2022: $108,662
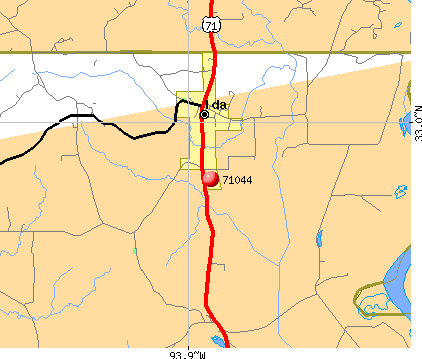
71044:
$108,662
Louisiana:
$209,200
According to our research of Louisiana and other state lists, there was 1 registered sex offender living in 71044 zip code as of May 28, 2024. The ratio of all residents to sex offenders in zip code 71044 is 699 to 1. The ratio of registered sex offenders to all residents in this zip code is lower than the state average.
Median resident age:
This zip code:
41.7 years
Louisiana median age:
38.2 years
Average household size:
This zip code:
2.1 people
Louisiana:
2.5 people
Averages for the 2020 tax year for zip code 71044, filed in 2021:
Average Adjusted Gross Income (AGI) in 2020: $54,254 (Individual Income Tax Returns)
Here:
$54,254
State:
$60,757
Salary/wage: $51,070 (reported on 76.9% of returns)
Here:
$51,070
State:
$50,882
(% of AGI for various income ranges: 896.7% for AGIs below $25k, 3837.5% for AGIs $25k-50k, 7186.7% for AGIs $50k-75k, 8100.0% for AGIs $75k-100k, 14550.0% for AGIs $100k-200k)
Taxable interest for individuals: $383 (reported on 23.1% of returns)
This zip code:
$383
Louisiana:
$1,576
(% of AGI for various income ranges: 37.5% for AGIs $25k-50k, 40.0% for AGIs $75k-100k)
Ordinary dividends: $1,667 (reported on 11.5% of returns)
Here:
$1,667
State:
$7,743
(% of AGI for various income ranges: 166.7% for AGIs $50k-75k)
Net capital gain/loss in AGI: +$1,600 (reported on 7.7% of returns)
Here:
+$1,600
State:
+$16,917
(% of AGI for various income ranges: 80.0% for AGIs $25k-50k)
Profit/loss from business: +$550 (reported on 15.4% of returns)
Here:
+$550
State:
+$7,679
(% of AGI for various income ranges: 73.3% for AGIs $50k-75k)
Taxable individual retirement arrangement distribution: $9,967 (reported on 11.5% of returns)
71044:
$9,967
Louisiana:
$20,716
(% of AGI for various income ranges: 747.5% for AGIs $25k-50k)
Earned income credit: $2,125 (reported on 15.4% of returns)
Here:
$2,125
State:
$2,671
(% of AGI for various income ranges: 141.7% for AGIs below $25k)
Percentage of individuals using paid preparers for their 2020 taxes: 88.5%
Here:
88%
State:
92%
(% for various income ranges: 87.5% for AGIs below $25k, 83.3% for AGIs $25k-50k, 80.0% for AGIs $50k-75k, 100.0% for AGIs $75k-100k, 100.0% for AGIs $100k-200k)
Averages for the 2012 tax year for zip code 71044, filed in 2013:
Average Adjusted Gross Income (AGI) in 2012: $46,189 (Individual Income Tax Returns)
Here:
$46,189
State:
$56,730
Salary/wage: $44,419 (reported on 77.8% of returns)
Here:
$44,419
State:
$45,545
(% of AGI for various income ranges: 74.7% for AGIs below $25k, 79.5% for AGIs $25k-50k, 76.6% for AGIs $50k-75k, 90.1% for AGIs $75k-100k, 60.8% for AGIs $100k-200k)
Taxable interest for individuals: $486 (reported on 25.9% of returns)
This zip code:
$486
Louisiana:
$1,804
Ordinary dividends: $2,133 (reported on 11.1% of returns)
Here:
$2,133
State:
$7,610
Net capital gain/loss in AGI: +$1,300 (reported on 7.4% of returns)
Here:
+$1,300
State:
+$17,096
Profit/loss from business: +$1,200 (reported on 14.8% of returns)
Here:
+$1,200
State:
+$12,088
Total itemized deductions: $17,560 (25% of AGI, reported on 18.5% of returns)
Here:
$17,560
State:
$23,585
Here:
25.1% of AGI
State:
18.1% of AGI
Charity contributions: $3,633 (reported on 11.1% of returns)
Here:
$3,633
State:
$5,533
Taxes paid: $3,120 (reported on 18.5% of returns)
71044:
$3,120
State:
$6,282
Earned income credit: $2,050 (reported on 14.8% of returns)
Here:
$2,050
State:
$2,633
(% of AGI for various income ranges: 8.2% for AGIs below $25k)
Percentage of individuals using paid preparers for their 2012 taxes: 59.3%
Here:
59%
State:
57%
(% for various income ranges: 55.6% for AGIs below $25k, 57.1% for AGIs $25k-50k, 100.0% for AGIs $50k-75k, 66.7% for AGIs $100k-200k)
Averages for the 2004 tax year for zip code 71044, filed in 2005:
Average Adjusted Gross Income (AGI) in 2004: $31,795 (Individual Income Tax Returns)
Here:
$31,795
State:
$39,411
Salary/wage: $29,876 (reported on 78.3% of returns)
Here:
$29,876
State:
$34,434
(% of AGI for various income ranges: 78.3% for AGIs below $10k, 62.0% for AGIs $10k-25k, 71.1% for AGIs $25k-50k, 86.5% for AGIs $50k-75k, 61.9% for AGIs $75k-100k)
Taxable interest for individuals: $1,111 (reported on 41.9% of returns)
This zip code:
$1,111
Louisiana:
$1,606
(% of AGI for various income ranges: 1.6% for AGIs below $10k, 3.4% for AGIs $10k-25k, 2.5% for AGIs $25k-50k, 0.1% for AGIs $50k-75k, 0.2% for AGIs $75k-100k)
Taxable dividends: $838 (reported on 14.3% of returns)
Here:
$838
State:
$3,235
Net capital gain/loss: +$107 (reported on 10.9% of returns)
Here:
+$107
State:
+$8,531
Profit/loss from business: +$3,342 (reported on 14.7% of returns)
Here:
+$3,342
State:
+$9,128
Total itemized deductions: $14,323 (31% of AGI, reported on 12.0% of returns)
Here:
$14,323
State:
$18,222
Here:
31.0% of AGI
State:
20.3% of AGI
Charity contributions deductions: $3,423 (7% of AGI, reported on 10.1% of returns)
Here:
$3,423
State:
$4,190
Here:
7.1% of AGI
State:
4.4% of AGI
Total tax: $3,335 (reported on 71.7% of returns)
71044:
$3,335
State:
$6,529
(% of AGI for various income ranges: 3.8% for AGIs below $10k, 3.5% for AGIs $10k-25k, 5.6% for AGIs $25k-50k, 9.2% for AGIs $50k-75k, 12.1% for AGIs $75k-100k)
Earned income credit: $1,851 (reported on 18.2% of returns)
Here:
$1,851
State:
$2,103
Percentage of individuals using paid preparers for their 2004 taxes: 72.9%
Here:
73%
State:
61%
(% for various income ranges: 68.1% for AGIs below $10k, 74.0% for AGIs $10k-25k, 74.4% for AGIs $25k-50k, 71.1% for AGIs $50k-75k, 80.0% for AGIs $75k-100k)
Household received Food Stamps/SNAP in the past 12 months: 16 Household did not receive Food Stamps/SNAP in the past 12 months: 305
Women who had a birth in the past 12 months: 1 (0 now married, 0 unmarried) Women who did not have a birth in the past 12 months: 116 (69 now married, 46 unmarried)
Housing units in zip code 71044 with a mortgage: 112 (2 second mortgage, 1 both second mortgage and home equity loan) Median monthly owner costs for units with a mortgage: $1,023 Median monthly owner costs for units without a mortgage: $344
Residents with income below the poverty level in 2022:
This zip code:
3.0%
Whole state:
18.6%
Residents with income below 50% of the poverty level in 2022:
This zip code:
2.1%
Whole state:
10.1%
Median number of rooms in houses and condos:
Here:
5.3
State:
6.2
Median number of rooms in apartments:
Here:
4.3
State:
4.4
Notable locations in this zip code not listed on our city pages
Churches in zip code 71044 include: Bethlehem Church (A), Bright Morning Star Church (B), Colquitt Church (C), Line Creek Church (D), Munnerlyn Chapel (E), Saint Marks Church (F). Display/hide their locations on the map
Streams, rivers, and creeks: Hartman Branch (A), Flag Branch (B), Bardstown Bayou (C), Kelly Bayou (D), Smith Creek (E), Nance Branch (F). Display/hide their locations on the map
Size of family households: 109 2-persons, 37 3-persons, 21 4-persons, 9 5-persons, 8 6-persons
Size of nonfamily households: 134 1-person, 7 2-persons
111 married couples with children.
65 single-parent households (33 men, 32 women).
100.3% of residents of 71044 zip code speak English at home.
Foreign born population: 0 (0.0%)
:
0.0%
Whole state:
4.2%
33%American
8%German
7%English
6%Irish
3%French
1%European
Housing units lacking complete plumbing facilities: 4.1% Housing units lacking complete kitchen facilities: 3.0%
55.1%Electricity
37.5%Utility gas
7.6%Wood
Population in 1990: 742.
Place of birth for U.S.-born residents:
This state: 539
Northeast: 10
Midwest: 17
South: 75
West: 51
74% of the 71044 zip code residents lived in the same house 5 years ago. Out of people who lived in different houses, 87% lived in this county. Out of people who lived in different counties, 50% lived in Louisiana.
85% of the 71044 zip code residents lived in the same house 1 year ago. Out of people who lived in different houses, 79% moved from this county. Out of people who lived in different houses, 10% moved from different county within same state. Out of people who lived in different houses, 7% moved from abroad.
Private vs. public school enrollment:
Students in private schools in grades 1 to 8 (elementary and middle school): 1
Here:
2.0%
Louisiana:
19.6%
Students in private schools in grades 9 to 12 (high school):
Here:
0.0%
Louisiana:
18.3%
Students in private undergraduate colleges: 11
Here:
72.2%
Louisiana:
17.4%
Occupation by median earnings in the past 12 months ($)
90,993Legal occupations
64,541Health diagnosing and treating practitioners and other technical occupations
63,087Installation, maintenance, and repair occupations
62,064Transportation occupations
58,000Education, training, and library occupations
49,429Management occupations
Top industries in this zip code by the number of employees in 2005:
Professional, Scientific, and Technical Services: Other Management Consulting Services (5-9 employees: 1 establishment)
Other Services (except Public Administration): Religious Organizations (1-4: 2)
Mining: Crude Petroleum and Natural Gas Extraction (1-4: 1)
Fatal accident statistics in 2014:
Fatal accident count: 1
Vehicles involved in fatal accidents: 2
Fatal accidents caused by drunken drivers: 1
Fatalities: 1
Persons involved in fatal accidents: 2
Pedestrians involved in fatal accidents: 0
Fatal accident statistics in 2012:
Fatal accident count: 1
Vehicles involved in fatal accidents: 1
Fatal accidents caused by drunken drivers: 0
Fatalities: 1
Persons involved in fatal accidents: 5
Pedestrians involved in fatal accidents: 0
Home Mortgage Disclosure Act Aggregated Statistics For Year 2009 (Based on 4 partial tracts)
A) FHA, FSA/RHS & VA Home Purchase Loans
B) Conventional Home Purchase Loans
C) Refinancings
D) Home Improvement Loans
F) Non-occupant Loans on < 5 Family Dwellings (A B C & D)
G) Loans On Manufactured Home Dwelling (A B C & D)
Number
Average Value
Number
Average Value
Number
Average Value
Number
Average Value
Number
Average Value
Number
Average Value
LOANS ORIGINATED
4
$88,750
5
$18,982
16
$137,118
13
$18,392
2
$26,920
6
$31,180
APPLICATIONS APPROVED, NOT ACCEPTED
0
$0
3
$18,557
1
$27,380
0
$0
1
$23,730
1
$10,950
APPLICATIONS DENIED
3
$68,140
3
$17,947
13
$126,290
6
$64,187
2
$39,700
5
$45,082
APPLICATIONS WITHDRAWN
0
$0
0
$0
0
$0
2
$73,010
0
$0
0
$0
FILES CLOSED FOR INCOMPLETENESS
0
$0
1
$33,770
2
$78,485
1
$18,250
0
$0
2
$50,650
Aggregated Statistics For Year 2008 (Based on 4 partial tracts)
A) FHA, FSA/RHS & VA Home Purchase Loans
B) Conventional Home Purchase Loans
C) Refinancings
D) Home Improvement Loans
F) Non-occupant Loans on < 5 Family Dwellings (A B C & D)
G) Loans On Manufactured Home Dwelling (A B C & D)
Number
Average Value
Number
Average Value
Number
Average Value
Number
Average Value
Number
Average Value
Number
Average Value
LOANS ORIGINATED
3
$71,790
9
$85,074
12
$96,203
11
$13,025
0
$0
6
$37,265
APPLICATIONS APPROVED, NOT ACCEPTED
0
$0
3
$61,753
2
$75,290
0
$0
0
$0
2
$78,940
APPLICATIONS DENIED
0
$0
7
$64,013
16
$84,815
6
$17,948
1
$36,500
6
$40,915
APPLICATIONS WITHDRAWN
0
$0
0
$0
1
$111,340
0
$0
0
$0
0
$0
FILES CLOSED FOR INCOMPLETENESS
0
$0
0
$0
0
$0
0
$0
0
$0
0
$0
Aggregated Statistics For Year 2007 (Based on 4 partial tracts)
A) FHA, FSA/RHS & VA Home Purchase Loans
B) Conventional Home Purchase Loans
C) Refinancings
D) Home Improvement Loans
F) Non-occupant Loans on < 5 Family Dwellings (A B C & D)
G) Loans On Manufactured Home Dwelling (A B C & D)
Number
Average Value
Number
Average Value
Number
Average Value
Number
Average Value
Number
Average Value
Number
Average Value
LOANS ORIGINATED
1
$62,970
15
$44,231
16
$103,523
13
$8,915
5
$38,146
13
$27,658
APPLICATIONS APPROVED, NOT ACCEPTED
1
$95,820
3
$69,663
9
$112,047
1
$9,130
1
$114,080
5
$81,038
APPLICATIONS DENIED
0
$0
17
$57,924
15
$114,623
10
$45,356
2
$52,475
14
$61,861
APPLICATIONS WITHDRAWN
0
$0
0
$0
2
$71,185
1
$4,560
0
$0
1
$77,570
FILES CLOSED FOR INCOMPLETENESS
0
$0
0
$0
1
$123,200
1
$155,140
0
$0
0
$0
Aggregated Statistics For Year 2006 (Based on 4 partial tracts)
A) FHA, FSA/RHS & VA Home Purchase Loans
B) Conventional Home Purchase Loans
C) Refinancings
D) Home Improvement Loans
F) Non-occupant Loans on < 5 Family Dwellings (A B C & D)
G) Loans On Manufactured Home Dwelling (A B C & D)
Number
Average Value
Number
Average Value
Number
Average Value
Number
Average Value
Number
Average Value
Number
Average Value
LOANS ORIGINATED
4
$113,390
19
$74,209
19
$46,398
16
$25,324
3
$27,377
24
$32,815
APPLICATIONS APPROVED, NOT ACCEPTED
0
$0
4
$47,228
5
$74,834
2
$13,690
0
$0
4
$28,975
APPLICATIONS DENIED
1
$51,110
10
$69,814
8
$83,502
15
$22,207
0
$0
11
$46,128
APPLICATIONS WITHDRAWN
0
$0
3
$23,120
8
$66,278
1
$2,740
0
$0
1
$11,860
FILES CLOSED FOR INCOMPLETENESS
0
$0
1
$136,890
3
$67,533
0
$0
0
$0
0
$0
Aggregated Statistics For Year 2005 (Based on 4 partial tracts)
A) FHA, FSA/RHS & VA Home Purchase Loans
B) Conventional Home Purchase Loans
C) Refinancings
D) Home Improvement Loans
F) Non-occupant Loans on < 5 Family Dwellings (A B C & D)
G) Loans On Manufactured Home Dwelling (A B C & D)
Number
Average Value
Number
Average Value
Number
Average Value
Number
Average Value
Number
Average Value
Number
Average Value
LOANS ORIGINATED
0
$0
22
$47,372
14
$49,932
16
$6,616
3
$14,297
10
$21,811
APPLICATIONS APPROVED, NOT ACCEPTED
1
$75,750
6
$77,418
5
$52,566
0
$0
0
$0
5
$47,272
APPLICATIONS DENIED
2
$49,280
9
$95,012
10
$58,771
10
$19,347
1
$10,040
8
$47,455
APPLICATIONS WITHDRAWN
0
$0
5
$65,890
3
$73,920
0
$0
0
$0
0
$0
FILES CLOSED FOR INCOMPLETENESS
0
$0
0
$0
1
$122,290
0
$0
0
$0
0
$0
Aggregated Statistics For Year 2004 (Based on 4 partial tracts)
A) FHA, FSA/RHS & VA Home Purchase Loans
B) Conventional Home Purchase Loans
C) Refinancings
D) Home Improvement Loans
F) Non-occupant Loans on < 5 Family Dwellings (A B C & D)
G) Loans On Manufactured Home Dwelling (A B C & D)
Number
Average Value
Number
Average Value
Number
Average Value
Number
Average Value
Number
Average Value
Number
Average Value
LOANS ORIGINATED
2
$95,365
20
$58,133
20
$51,014
13
$24,570
1
$16,430
16
$32,682
APPLICATIONS APPROVED, NOT ACCEPTED
0
$0
4
$53,842
8
$76,430
0
$0
1
$82,130
3
$47,457
APPLICATIONS DENIED
0
$0
9
$35,389
16
$69,129
6
$26,770
2
$36,505
8
$57,836
APPLICATIONS WITHDRAWN
0
$0
4
$81,905
7
$82,394
2
$43,350
2
$48,825
1
$41,070
FILES CLOSED FOR INCOMPLETENESS
0
$0
0
$0
0
$0
0
$0
0
$0
0
$0
Aggregated Statistics For Year 2003 (Based on 4 partial tracts)
A) FHA, FSA/RHS & VA Home Purchase Loans
B) Conventional Home Purchase Loans
C) Refinancings
D) Home Improvement Loans
F) Non-occupant Loans on < 5 Family Dwellings (A B C & D)
Number
Average Value
Number
Average Value
Number
Average Value
Number
Average Value
Number
Average Value
LOANS ORIGINATED
2
$61,145
13
$40,014
16
$51,562
9
$16,224
2
$10,495
APPLICATIONS APPROVED, NOT ACCEPTED
0
$0
11
$48,700
3
$33,767
1
$45,630
0
$0
APPLICATIONS DENIED
0
$0
16
$36,162
18
$55,263
5
$27,560
3
$43,500
APPLICATIONS WITHDRAWN
0
$0
4
$101,528
5
$63,516
0
$0
1
$19,160
FILES CLOSED FOR INCOMPLETENESS
0
$0
0
$0
2
$136,890
0
$0
0
$0
Aggregated Statistics For Year 1999 (Based on 2 partial tracts)
A) FHA, FSA/RHS & VA Home Purchase Loans
B) Conventional Home Purchase Loans
C) Refinancings
D) Home Improvement Loans
F) Non-occupant Loans on < 5 Family Dwellings (A B C & D)
Detailed PMIC statistics for the following Tracts:0251.00
2002 - 2018 National Fire Incident Reporting System (NFIRS) incidents
Based on the data from the years 2002 - 2018 the average number of fires per year is 7. The highest number of reported fire incidents - 12 took place in 2003, and the least - 3 in 2004. The data has a growing trend.
When looking into fire subcategories, the most reports belonged to: Outside Fires (68.0%), and Structure Fires (23.2%).
Fire incident types reported to NFIRS in Zip Code 71044

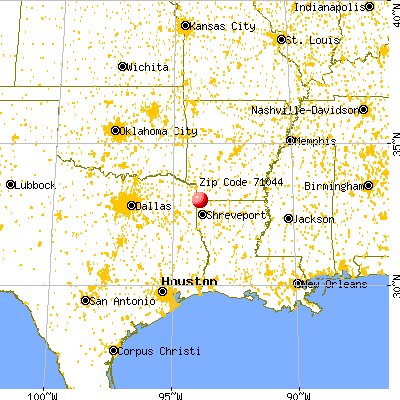


 Nearest zip codes: 71043, 71069, 71029, 71082, 71834, 71061.


 Based on the data from the years 2002 - 2018 the average number of fires per year is 7. The highest number of reported fire incidents - 12 took place in 2003, and the least - 3 in 2004. The data has a growing trend.
 When looking into fire subcategories, the most reports belonged to: Outside Fires (68.0%), and Structure Fires (23.2%).