Estimated zip code population in 2022: 1,719 Zip code population in 2010: 1,491 Zip code population in 2000: 1,431
March 2022 cost of living index in zip code 71834: 77.6 (low, U.S. average is 100)
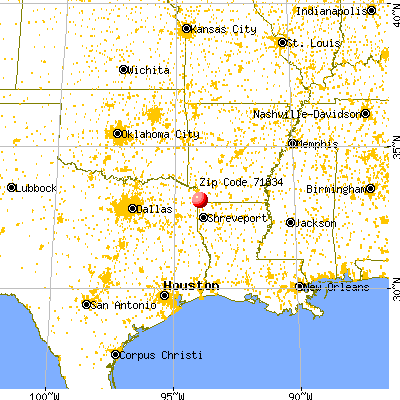
Land area: 148.7 sq. mi. Water area: 2.3 sq. mi.
Population density: 12 people per square mile
(very low).
OSM Map
General Map
Google Map
MSN Map
OSM Map
General Map
Google Map
MSN Map
OSM Map
General Map
Google Map
MSN Map
OSM Map
General Map
Google Map
MSN Map
Please wait while loading the map...
Median real estate property taxes paid for housing units with mortgages in 2022: $2,470 Median real estate property taxes paid for housing units with no mortgage in 2022: $361
Business Search- 14 Million verified businesses
Males: 754
(43.9%)
Females: 964
(56.1%)
For population 25 years and over in 71834:
High school or higher: 80.0%
Bachelor's degree or higher: 8.6%
Graduate or professional degree: 4.3%
Unemployed: 2.8%
Mean travel time to work (commute): 36.9 minutes
For population 15 years and over in 71834:
Never married: 17.7%
Now married: 70.8%
Separated: 1.6%
Widowed: 7.5%
Divorced: 2.4%
Zip code 71834 compared to state average:
Median house value significantly below state average.
Hispanic race population percentage significantly below state average.
Median age significantly above state average.
Foreign-born population percentage significantly below state average.
Renting percentage significantly below state average.
Number of college students significantly below state average.
Percentage of population with a bachelor's degree or higher significantly below state average.
Averages for the 2020 tax year for zip code 71834, filed in 2021:
Average Adjusted Gross Income (AGI) in 2020: $49,183 (Individual Income Tax Returns)
Here:
$49,183
State:
$64,872
Salary/wage: $44,086 (reported on 76.1% of returns)
Here:
$44,086
State:
$50,644
(% of AGI for various income ranges: 973.1% for AGIs below $25k, 3608.9% for AGIs $25k-50k, 7076.0% for AGIs $50k-75k, 8480.0% for AGIs $75k-100k, 16116.7% for AGIs $100k-200k)
Taxable interest for individuals: $700 (reported on 26.1% of returns)
This zip code:
$700
Arkansas:
$1,857
(% of AGI for various income ranges: 6.2% for AGIs below $25k, 33.3% for AGIs $25k-50k, 58.0% for AGIs $50k-75k, 56.7% for AGIs $75k-100k)
Ordinary dividends: $975 (reported on 8.7% of returns)
Here:
$975
State:
$21,681
(% of AGI for various income ranges: 8.5% for AGIs below $25k, 56.0% for AGIs $50k-75k)
Net capital gain/loss in AGI: +$3,467 (reported on 6.5% of returns)
Here:
+$3,467
State:
+$22,815
(% of AGI for various income ranges: 115.6% for AGIs $25k-50k)
Profit/loss from business: +$5,125 (reported on 17.4% of returns)
Here:
+$5,125
State:
+$9,743
(% of AGI for various income ranges: 158.5% for AGIs below $25k, 408.0% for AGIs $50k-75k)
Taxable individual retirement arrangement distribution: $9,400 (reported on 6.5% of returns)
71834:
$9,400
Arkansas:
$18,502
(% of AGI for various income ranges: 216.9% for AGIs below $25k)
Earned income credit: $2,733 (reported on 19.6% of returns)
Here:
$2,733
State:
$2,546
(% of AGI for various income ranges: 136.2% for AGIs below $25k, 76.7% for AGIs $25k-50k)
Percentage of individuals using paid preparers for their 2020 taxes: 93.5%
Here:
93%
State:
94%
(% for various income ranges: 94.1% for AGIs below $25k, 91.7% for AGIs $25k-50k, 87.5% for AGIs $50k-75k, 100.0% for AGIs $75k-100k, 100.0% for AGIs $100k-200k)
Averages for the 2012 tax year for zip code 71834, filed in 2013:
Average Adjusted Gross Income (AGI) in 2012: $41,570 (Individual Income Tax Returns)
Here:
$41,570
State:
$52,148
Salary/wage: $39,047 (reported on 78.3% of returns)
Here:
$39,047
State:
$41,669
(% of AGI for various income ranges: 72.3% for AGIs below $25k, 74.0% for AGIs $25k-50k, 83.2% for AGIs $50k-75k, 74.0% for AGIs $75k-100k, 63.4% for AGIs $100k-200k)
Taxable interest for individuals: $954 (reported on 28.3% of returns)
This zip code:
$954
Arkansas:
$1,648
(% of AGI for various income ranges: 1.0% for AGIs below $25k, 1.6% for AGIs $25k-50k, 0.4% for AGIs $75k-100k, 0.6% for AGIs $100k-200k)
Ordinary dividends: $800 (reported on 8.7% of returns)
Here:
$800
State:
$20,675
Net capital gain/loss in AGI: +$4,300 (reported on 8.7% of returns)
Here:
+$4,300
State:
+$15,222
Profit/loss from business: +$4,012 (reported on 17.4% of returns)
Here:
+$4,012
State:
+$9,665
Taxable individual retirement arrangement distribution: $7,600 (reported on 6.5% of returns)
71834:
$7,600
Arkansas:
$13,644
Total itemized deductions: $19,957 (23% of AGI, reported on 15.2% of returns)
Here:
$19,957
State:
$23,276
Here:
22.9% of AGI
State:
19.1% of AGI
Charity contributions: $6,167 (reported on 13.0% of returns)
Here:
$6,167
State:
$5,996
Taxes paid: $5,186 (reported on 15.2% of returns)
71834:
$5,186
State:
$7,941
Earned income credit: $2,042 (reported on 26.1% of returns)
Here:
$2,042
State:
$2,455
(% of AGI for various income ranges: 8.9% for AGIs below $25k, 1.1% for AGIs $25k-50k)
Percentage of individuals using paid preparers for their 2012 taxes: 65.2%
Here:
65%
State:
61%
(% for various income ranges: 57.9% for AGIs below $25k, 63.6% for AGIs $25k-50k, 75.0% for AGIs $50k-75k, 75.0% for AGIs $75k-100k, 75.0% for AGIs $100k-200k)
Averages for the 2004 tax year for zip code 71834, filed in 2005:
Average Adjusted Gross Income (AGI) in 2004: $30,963 (Individual Income Tax Returns)
Here:
$30,963
State:
$39,270
Salary/wage: $29,188 (reported on 81.2% of returns)
Here:
$29,188
State:
$34,079
(% of AGI for various income ranges: 76.9% for AGIs below $10k, 71.6% for AGIs $10k-25k, 81.2% for AGIs $25k-50k, 88.2% for AGIs $50k-75k, 142.1% for AGIs $75k-100k)
Taxable interest for individuals: $1,222 (reported on 38.1% of returns)
This zip code:
$1,222
Arkansas:
$1,904
(% of AGI for various income ranges: 9.0% for AGIs below $10k, 1.7% for AGIs $10k-25k, 1.5% for AGIs $25k-50k, 1.0% for AGIs $50k-75k, 2.2% for AGIs $75k-100k)
Taxable dividends: $509 (reported on 11.8% of returns)
Here:
$509
State:
$5,995
Net capital gain/loss: +$3,194 (reported on 7.4% of returns)
Here:
+$3,194
State:
+$10,430
Profit/loss from business: +$4,031 (reported on 13.4% of returns)
Here:
+$4,031
State:
+$7,823
Total itemized deductions: $18,246 (28% of AGI, reported on 12.6% of returns)
Here:
$18,246
State:
$18,389
Here:
28.4% of AGI
State:
21.0% of AGI
(% of AGI for various income ranges: 4.1% for AGIs $10k-25k, 3.8% for AGIs $25k-50k, 11.3% for AGIs $50k-75k, 24.2% for AGIs $75k-100k)
Charity contributions deductions: $4,152 (7% of AGI, reported on 9.5% of returns)
Here:
$4,152
State:
$4,725
Here:
7.0% of AGI
State:
5.1% of AGI
(% of AGI for various income ranges: 1.8% for AGIs $10k-25k, 2.5% for AGIs $50k-75k, 2.8% for AGIs $75k-100k)
Total tax: $3,525 (reported on 69.1% of returns)
71834:
$3,525
State:
$6,047
(% of AGI for various income ranges: 2.6% for AGIs below $10k, 4.1% for AGIs $10k-25k, 6.5% for AGIs $25k-50k, 7.6% for AGIs $50k-75k, 11.9% for AGIs $75k-100k, 13.6% for AGIs over 100k)
Earned income credit: $1,891 (reported on 26.4% of returns)
Here:
$1,891
State:
$1,909
Percentage of individuals using paid preparers for their 2004 taxes: 67.0%
Here:
67%
State:
67%
(% for various income ranges: 56.9% for AGIs below $10k, 69.3% for AGIs $10k-25k, 70.7% for AGIs $25k-50k, 67.7% for AGIs $50k-75k, 120.0% for AGIs $75k-100k)
Household received Food Stamps/SNAP in the past 12 months: 224 Household did not receive Food Stamps/SNAP in the past 12 months: 416
Women who had a birth in the past 12 months: 40 (41 now married, 0 unmarried) Women who did not have a birth in the past 12 months: 419 (338 now married, 83 unmarried)
Housing units in zip code 71834 with a mortgage: 117 Median monthly owner costs for units with a mortgage: $1,869 Median monthly owner costs for units without a mortgage: $448
Residents with income below the poverty level in 2022:
This zip code:
2.8%
Whole state:
16.8%
Residents with income below 50% of the poverty level in 2022:
This zip code:
2.0%
Whole state:
8.5%
Median number of rooms in houses and condos:
Here:
5.8
State:
6.1
Notable locations in this zip code not listed on our city pages
Notable locations in zip code 71834: Bright Star Volunteer Fire Department (A), Doddridge Volunteer Fire Department (B). Display/hide their locations on the map
Churches in zip code 71834 include: Caney Church (A), Concord Church (B), Doddridge Church (C), Enon Church (D), Evergreen Church (E), Macedonia Church (F), Mount Pleasant Church (G), New Hope Church (H), Oak Grove Church (I). Display/hide their locations on the map
Cemeteries: Blanton Cemetery (1), Sulphur Fork Cemetery (2), Walters Cemetery (3), New Hope Cemetery (4), Brown Cemetery (5). Display/hide their locations on the map
Lakes and reservoirs: Mercer Lake (A), Alligator Lake (B), Pinhook Lake (C), Little Pond (D), Palmer Lake (E), Long Slough (F), Kennedy Lake (G), Snaggy Lake (H). Display/hide their locations on the map
Streams, rivers, and creeks: May Branch (A), Hicks Branch (B), West Fork Kelly Bayou (C), East Fork Kelly Bayou (D), Turkey Creek (E), Day Branch (F), Cypress Slough (G), Capps Branch (H), Caney Creek (I). Display/hide their locations on the map
Size of family households: 125 2-persons, 138 3-persons, 184 4-persons, 12 7-or-more-persons
Size of nonfamily households: 182 1-person
113 married couples with children.
31 single-parent households (31 women).
99.4% of residents of 71834 zip code speak English at home.
Foreign born population: 0 (0.0%)
:
0.0%
Whole state:
5.1%
32%English
12%American
4%Irish
4%French
4%African
1%European
Year of entry for the foreign-born population
02010 or later
02000 to 2009
01990 to 1999
12Before 1990
Facilities with environmental interests located in this zip code:
BRIGHT STAR ELEMENTARY SCHOOL (ROUTE 1 BOX 222 in DODDRIDGE, AR)
(Geographic Names Information System) (National Center for Education Statistics) - STATE ID-4601001
BRIGHT STAR HIGH SCHOOL (ROUTE 1 BOX 222 in DODDRIDGE, AR)
(Geographic Names Information System) (National Center for Education Statistics) - STATE ID-4601002
Housing units lacking complete plumbing facilities: 14.0% Housing units lacking complete kitchen facilities: 10.4%
50.9%Electricity
45.8%Bottled, tank, or LP gas
1.9%Wood
1.8%Utility gas
Population in 1990: 1,435.
Place of birth for U.S.-born residents:
This state: 331
Midwest: 35
South: 1,181
West: 189
68% of the 71834 zip code residents lived in the same house 5 years ago. Out of people who lived in different houses, 46% lived in this county. Out of people who lived in different counties, 50% lived in Arkansas.
75% of the 71834 zip code residents lived in the same house 1 year ago. Out of people who lived in different houses, 7% moved from this county. Out of people who lived in different houses, 17% moved from different county within same state. Out of people who lived in different houses, 91% moved from different state.
Private vs. public school enrollment:
Students in private schools in grades 1 to 8 (elementary and middle school): 72
Here:
58.8%
Arkansas:
10.5%
Students in private schools in grades 9 to 12 (high school):
Here:
0.0%
Arkansas:
8.7%
Top industries in this zip code by the number of employees in 2005:
Mining: Support Activities for Oil and Gas Operations (10-19 employees: 1 establishment)
Accommodation and Food Services: Limited-Service Restaurants (10-19: 1)
Mining: Crude Petroleum and Natural Gas Extraction (10-19: 1)
Mining: Drilling Oil and Gas Wells (5-9: 1)
Accommodation and Food Services: Full-Service Restaurants (5-9: 1)
Other Services (except Public Administration): Religious Organizations (1-4: 3)
Fatal accident statistics in 2012:
Fatal accident count: 1
Vehicles involved in fatal accidents: 2
Fatal accidents caused by drunken drivers: 1
Fatalities: 1
Persons involved in fatal accidents: 2
Pedestrians involved in fatal accidents: 0
Fatal accident statistics in 2011:
Fatal accident count: 1
Vehicles involved in fatal accidents: 1
Fatal accidents caused by drunken drivers: 0
Fatalities: 1
Persons involved in fatal accidents: 3
Pedestrians involved in fatal accidents: 0
Home Mortgage Disclosure Act Aggregated Statistics For Year 2009 (Based on 2 partial tracts)
A) FHA, FSA/RHS & VA Home Purchase Loans
B) Conventional Home Purchase Loans
C) Refinancings
D) Home Improvement Loans
F) Non-occupant Loans on < 5 Family Dwellings (A B C & D)
G) Loans On Manufactured Home Dwelling (A B C & D)
Number
Average Value
Number
Average Value
Number
Average Value
Number
Average Value
Number
Average Value
Number
Average Value
LOANS ORIGINATED
7
$107,334
40
$68,302
75
$101,498
18
$23,425
15
$52,287
32
$43,570
APPLICATIONS APPROVED, NOT ACCEPTED
2
$119,295
5
$74,614
4
$96,955
1
$14,750
1
$24,290
5
$47,718
APPLICATIONS DENIED
3
$164,267
23
$64,580
33
$124,330
18
$13,833
3
$32,680
23
$54,621
APPLICATIONS WITHDRAWN
2
$87,195
7
$44,620
18
$140,648
1
$11,280
0
$0
4
$52,055
FILES CLOSED FOR INCOMPLETENESS
1
$58,130
2
$72,010
1
$146,620
0
$0
0
$0
1
$66,810
Aggregated Statistics For Year 2008 (Based on 2 partial tracts)
A) FHA, FSA/RHS & VA Home Purchase Loans
B) Conventional Home Purchase Loans
C) Refinancings
D) Home Improvement Loans
F) Non-occupant Loans on < 5 Family Dwellings (A B C & D)
G) Loans On Manufactured Home Dwelling (A B C & D)
Number
Average Value
Number
Average Value
Number
Average Value
Number
Average Value
Number
Average Value
Number
Average Value
LOANS ORIGINATED
13
$123,466
43
$67,471
54
$87,692
23
$33,270
15
$58,129
24
$43,814
APPLICATIONS APPROVED, NOT ACCEPTED
0
$0
4
$71,360
8
$136,214
2
$4,770
0
$0
4
$69,190
APPLICATIONS DENIED
1
$168,310
16
$63,172
36
$106,353
9
$46,947
2
$40,345
16
$49,019
APPLICATIONS WITHDRAWN
0
$0
10
$83,984
12
$94,713
0
$0
0
$0
3
$35,860
FILES CLOSED FOR INCOMPLETENESS
0
$0
2
$72,445
1
$92,830
0
$0
1
$92,830
1
$13,880
Aggregated Statistics For Year 2007 (Based on 2 partial tracts)
A) FHA, FSA/RHS & VA Home Purchase Loans
B) Conventional Home Purchase Loans
C) Refinancings
D) Home Improvement Loans
F) Non-occupant Loans on < 5 Family Dwellings (A B C & D)
G) Loans On Manufactured Home Dwelling (A B C & D)
Number
Average Value
Number
Average Value
Number
Average Value
Number
Average Value
Number
Average Value
Number
Average Value
LOANS ORIGINATED
8
$97,822
55
$59,375
51
$86,216
29
$21,271
10
$48,152
36
$34,897
APPLICATIONS APPROVED, NOT ACCEPTED
1
$24,290
15
$77,332
12
$81,772
2
$36,005
2
$59,430
12
$64,275
APPLICATIONS DENIED
3
$103,243
34
$66,550
34
$85,612
8
$24,944
2
$74,180
23
$50,660
APPLICATIONS WITHDRAWN
0
$0
10
$44,074
9
$61,407
2
$49,020
3
$65,650
3
$41,357
FILES CLOSED FOR INCOMPLETENESS
0
$0
2
$88,495
3
$103,823
3
$82,423
0
$0
0
$0
Aggregated Statistics For Year 2006 (Based on 2 partial tracts)
A) FHA, FSA/RHS & VA Home Purchase Loans
B) Conventional Home Purchase Loans
C) Refinancings
D) Home Improvement Loans
F) Non-occupant Loans on < 5 Family Dwellings (A B C & D)
G) Loans On Manufactured Home Dwelling (A B C & D)
Number
Average Value
Number
Average Value
Number
Average Value
Number
Average Value
Number
Average Value
Number
Average Value
LOANS ORIGINATED
9
$99,581
59
$69,261
55
$74,582
20
$30,192
10
$50,234
32
$43,814
APPLICATIONS APPROVED, NOT ACCEPTED
1
$98,040
10
$81,381
11
$93,780
2
$43,380
1
$29,500
11
$54,895
APPLICATIONS DENIED
1
$65,940
33
$50,636
28
$82,701
8
$20,931
4
$45,550
35
$44,545
APPLICATIONS WITHDRAWN
1
$99,770
4
$93,050
20
$99,427
3
$52,633
0
$0
3
$63,623
FILES CLOSED FOR INCOMPLETENESS
0
$0
3
$77,507
6
$103,100
1
$26,030
0
$0
1
$26,030
Aggregated Statistics For Year 2005 (Based on 2 partial tracts)
A) FHA, FSA/RHS & VA Home Purchase Loans
B) Conventional Home Purchase Loans
C) Refinancings
D) Home Improvement Loans
F) Non-occupant Loans on < 5 Family Dwellings (A B C & D)
G) Loans On Manufactured Home Dwelling (A B C & D)
Number
Average Value
Number
Average Value
Number
Average Value
Number
Average Value
Number
Average Value
Number
Average Value
LOANS ORIGINATED
10
$109,578
55
$53,902
54
$67,673
10
$27,676
8
$32,752
33
$44,826
APPLICATIONS APPROVED, NOT ACCEPTED
0
$0
16
$46,959
10
$67,499
1
$17,350
2
$52,925
13
$37,173
APPLICATIONS DENIED
2
$62,465
24
$55,092
33
$78,768
12
$33,548
3
$47,140
18
$45,308
APPLICATIONS WITHDRAWN
2
$91,965
9
$72,493
14
$80,935
1
$160,510
0
$0
4
$39,910
FILES CLOSED FOR INCOMPLETENESS
0
$0
1
$26,030
3
$77,507
0
$0
2
$60,730
0
$0
Aggregated Statistics For Year 2004 (Based on 2 partial tracts)
A) FHA, FSA/RHS & VA Home Purchase Loans
B) Conventional Home Purchase Loans
C) Refinancings
D) Home Improvement Loans
F) Non-occupant Loans on < 5 Family Dwellings (A B C & D)
G) Loans On Manufactured Home Dwelling (A B C & D)
Number
Average Value
Number
Average Value
Number
Average Value
Number
Average Value
Number
Average Value
Number
Average Value
LOANS ORIGINATED
6
$96,303
55
$55,416
57
$68,008
28
$26,214
18
$47,766
39
$35,616
APPLICATIONS APPROVED, NOT ACCEPTED
0
$0
4
$46,200
15
$56,510
3
$38,753
0
$0
12
$48,948
APPLICATIONS DENIED
2
$42,945
32
$47,582
38
$85,504
25
$22,731
4
$28,198
30
$35,456
APPLICATIONS WITHDRAWN
2
$71,145
9
$40,970
23
$82,460
1
$57,260
3
$37,307
3
$45,693
FILES CLOSED FOR INCOMPLETENESS
0
$0
0
$0
4
$139,682
0
$0
0
$0
0
$0
Aggregated Statistics For Year 2003 (Based on 2 partial tracts)
A) FHA, FSA/RHS & VA Home Purchase Loans
B) Conventional Home Purchase Loans
C) Refinancings
D) Home Improvement Loans
F) Non-occupant Loans on < 5 Family Dwellings (A B C & D)
Number
Average Value
Number
Average Value
Number
Average Value
Number
Average Value
Number
Average Value
LOANS ORIGINATED
4
$113,872
58
$61,016
95
$73,609
24
$28,775
9
$44,248
APPLICATIONS APPROVED, NOT ACCEPTED
2
$95,435
9
$56,104
6
$74,035
1
$47,720
0
$0
APPLICATIONS DENIED
1
$61,600
24
$51,658
41
$86,654
12
$14,749
3
$60,443
APPLICATIONS WITHDRAWN
0
$0
7
$56,641
19
$102,788
2
$176,555
0
$0
FILES CLOSED FOR INCOMPLETENESS
0
$0
2
$85,890
0
$0
2
$27,765
1
$86,760
Aggregated Statistics For Year 2002 (Based on 2 partial tracts)
A) FHA, FSA/RHS & VA Home Purchase Loans
B) Conventional Home Purchase Loans
C) Refinancings
D) Home Improvement Loans
F) Non-occupant Loans on < 5 Family Dwellings (A B C & D)
Number
Average Value
Number
Average Value
Number
Average Value
Number
Average Value
Number
Average Value
LOANS ORIGINATED
6
$92,543
73
$51,224
64
$71,143
17
$20,669
10
$35,745
APPLICATIONS APPROVED, NOT ACCEPTED
0
$0
18
$55,719
7
$68,417
3
$21,980
0
$0
APPLICATIONS DENIED
0
$0
41
$33,371
28
$72,600
16
$12,309
1
$6,940
APPLICATIONS WITHDRAWN
0
$0
14
$46,851
7
$68,169
2
$75,915
2
$32,100
FILES CLOSED FOR INCOMPLETENESS
0
$0
1
$69,410
3
$65,937
0
$0
0
$0
Aggregated Statistics For Year 2001 (Based on 2 partial tracts)
A) FHA, FSA/RHS & VA Home Purchase Loans
B) Conventional Home Purchase Loans
C) Refinancings
D) Home Improvement Loans
F) Non-occupant Loans on < 5 Family Dwellings (A B C & D)
Number
Average Value
Number
Average Value
Number
Average Value
Number
Average Value
Number
Average Value
LOANS ORIGINATED
3
$67,673
59
$48,718
45
$60,327
22
$14,591
10
$34,878
APPLICATIONS APPROVED, NOT ACCEPTED
0
$0
34
$41,747
6
$62,033
2
$3,905
0
$0
APPLICATIONS DENIED
1
$92,830
66
$43,590
20
$53,271
10
$6,681
3
$76,927
APPLICATIONS WITHDRAWN
1
$42,510
6
$55,237
11
$87,234
0
$0
0
$0
FILES CLOSED FOR INCOMPLETENESS
0
$0
1
$42,510
3
$70,277
0
$0
0
$0
Aggregated Statistics For Year 2000 (Based on 2 partial tracts)
A) FHA, FSA/RHS & VA Home Purchase Loans
B) Conventional Home Purchase Loans
C) Refinancings
D) Home Improvement Loans
F) Non-occupant Loans on < 5 Family Dwellings (A B C & D)
Number
Average Value
Number
Average Value
Number
Average Value
Number
Average Value
Number
Average Value
LOANS ORIGINATED
8
$62,901
69
$49,252
30
$52,201
15
$9,023
11
$30,760
APPLICATIONS APPROVED, NOT ACCEPTED
5
$47,544
25
$43,900
2
$48,150
0
$0
0
$0
APPLICATIONS DENIED
0
$0
79
$41,096
21
$41,893
10
$19,087
1
$43,380
APPLICATIONS WITHDRAWN
0
$0
4
$28,848
12
$61,093
3
$20,533
1
$17,350
FILES CLOSED FOR INCOMPLETENESS
0
$0
0
$0
0
$0
0
$0
0
$0
Aggregated Statistics For Year 1999 (Based on 1 partial tract)
A) FHA, FSA/RHS & VA Home Purchase Loans
B) Conventional Home Purchase Loans
C) Refinancings
D) Home Improvement Loans
F) Non-occupant Loans on < 5 Family Dwellings (A B C & D)
Detailed PMIC statistics for the following Tracts:0210.00
2002 - 2018 National Fire Incident Reporting System (NFIRS) incidents
According to the data from the years 2002 - 2018 the average number of fire incidents per year is 42. The highest number of reported fire incidents - 144 took place in 2006, and the least - 0 in 2010. The data has a growing trend.
When looking into fire subcategories, the most reports belonged to: Outside Fires (76.9%), and Structure Fires (12.0%).
Fire incident types reported to NFIRS in Zip Code 71834


 Nearest zip codes: 75556, 71069, 71044, 71837, 75572, 75565.


 According to the data from the years 2002 - 2018 the average number of fire incidents per year is 42. The highest number of reported fire incidents - 144 took place in 2006, and the least - 0 in 2010. The data has a growing trend.
 When looking into fire subcategories, the most reports belonged to: Outside Fires (76.9%), and Structure Fires (12.0%).