Estimated median house/condo value in 2022: $75,958
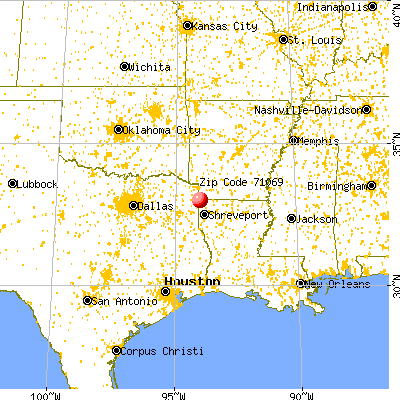
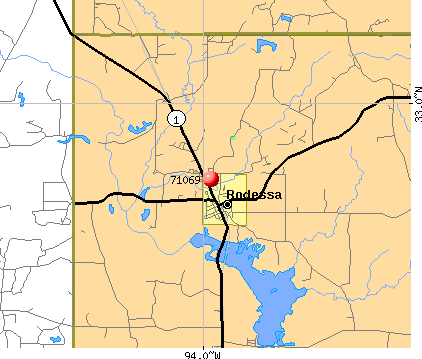
71069:
$75,958
Louisiana:
$209,200
According to our research of Louisiana and other state lists, there was 1 registered sex offender living in 71069 zip code as of May 28, 2024. The ratio of all residents to sex offenders in zip code 71069 is 571 to 1. The ratio of registered sex offenders to all residents in this zip code is lower than the state average.
Median resident age:
This zip code:
48.1 years
Louisiana median age:
38.2 years
Average household size:
This zip code:
1.8 people
Louisiana:
2.5 people
Averages for the 2020 tax year for zip code 71069, filed in 2021:
Average Adjusted Gross Income (AGI) in 2020: $37,895 (Individual Income Tax Returns)
Here:
$37,895
State:
$60,757
Salary/wage: $34,842 (reported on 86.4% of returns)
Here:
$34,842
State:
$50,882
(% of AGI for various income ranges: 926.7% for AGIs below $25k, 5756.0% for AGIs $25k-50k)
Taxable interest for individuals: $100 (reported on 18.2% of returns)
This zip code:
$100
Louisiana:
$1,576
(% of AGI for various income ranges: 8.0% for AGIs $25k-50k)
Profit/loss from business: +$4,350 (reported on 18.2% of returns)
Here:
+$4,350
State:
+$7,679
(% of AGI for various income ranges: 348.0% for AGIs $25k-50k)
Earned income credit: $2,600 (reported on 36.4% of returns)
Here:
$2,600
State:
$2,671
(% of AGI for various income ranges: 138.9% for AGIs below $25k, 166.0% for AGIs $25k-50k)
Percentage of individuals using paid preparers for their 2020 taxes: 95.5%
Here:
95%
State:
92%
(% for various income ranges: 100.0% for AGIs below $25k, 85.7% for AGIs $25k-50k, 100.0% for AGIs $50k-75k, 100.0% for AGIs $75k-100k)
Averages for the 2012 tax year for zip code 71069, filed in 2013:
Average Adjusted Gross Income (AGI) in 2012: $35,672 (Individual Income Tax Returns)
Here:
$35,672
State:
$56,730
Salary/wage: $36,124 (reported on 84.0% of returns)
Here:
$36,124
State:
$45,545
(% of AGI for various income ranges: 88.0% for AGIs below $25k, 89.7% for AGIs $25k-50k, 70.9% for AGIs $50k-75k, 88.4% for AGIs $75k-100k)
Taxable interest for individuals: $375 (reported on 16.0% of returns)
This zip code:
$375
Louisiana:
$1,804
Profit/loss from business: +$5,833 (reported on 12.0% of returns)
Here:
+$5,833
State:
+$12,088
Total itemized deductions: $22,200 (27% of AGI, reported on 12.0% of returns)
Here:
$22,200
State:
$23,585
Here:
26.7% of AGI
State:
18.1% of AGI
Charity contributions: $8,300 (reported on 8.0% of returns)
Here:
$8,300
State:
$5,533
Taxes paid: $3,267 (reported on 12.0% of returns)
71069:
$3,267
State:
$6,282
Earned income credit: $2,640 (reported on 40.0% of returns)
Here:
$2,640
State:
$2,633
(% of AGI for various income ranges: 14.5% for AGIs below $25k)
Percentage of individuals using paid preparers for their 2012 taxes: 52.0%
Here:
52%
State:
57%
(% for various income ranges: 50.0% for AGIs below $25k, 40.0% for AGIs $25k-50k, 66.7% for AGIs $50k-75k, 66.7% for AGIs $75k-100k)
Averages for the 2004 tax year for zip code 71069, filed in 2005:
Average Adjusted Gross Income (AGI) in 2004: $27,490 (Individual Income Tax Returns)
Here:
$27,490
State:
$39,411
Salary/wage: $26,093 (reported on 86.7% of returns)
Here:
$26,093
State:
$34,434
(% of AGI for various income ranges: 79.1% for AGIs below $10k, 80.1% for AGIs $10k-25k, 88.4% for AGIs $25k-50k, 80.9% for AGIs $50k-75k, 79.5% for AGIs $75k-100k)
Taxable interest for individuals: $491 (reported on 19.2% of returns)
This zip code:
$491
Louisiana:
$1,606
(% of AGI for various income ranges: 1.1% for AGIs $10k-25k, 0.4% for AGIs $50k-75k, 0.1% for AGIs $75k-100k)
Profit/loss from business: +$4,257 (reported on 12.2% of returns)
Here:
+$4,257
State:
+$9,128
Total itemized deductions: $15,310 (24% of AGI, reported on 10.1% of returns)
Here:
$15,310
State:
$18,222
Here:
23.6% of AGI
State:
20.3% of AGI
Charity contributions deductions: $4,682 (7% of AGI, reported on 7.7% of returns)
Here:
$4,682
State:
$4,190
Here:
6.7% of AGI
State:
4.4% of AGI
Total tax: $3,536 (reported on 58.0% of returns)
71069:
$3,536
State:
$6,529
(% of AGI for various income ranges: 2.3% for AGIs below $10k, 3.1% for AGIs $10k-25k, 4.8% for AGIs $25k-50k, 9.2% for AGIs $50k-75k, 13.5% for AGIs $75k-100k)
Earned income credit: $2,177 (reported on 39.5% of returns)
Here:
$2,177
State:
$2,103
Percentage of individuals using paid preparers for their 2004 taxes: 67.1%
Here:
67%
State:
61%
(% for various income ranges: 59.7% for AGIs below $10k, 68.9% for AGIs $10k-25k, 66.7% for AGIs $25k-50k, 67.9% for AGIs $50k-75k, 85.0% for AGIs $75k-100k)
Household received Food Stamps/SNAP in the past 12 months: 49 Household did not receive Food Stamps/SNAP in the past 12 months: 210
Women who did not have a birth in the past 12 months: 66 (27 now married, 38 unmarried)
Housing units in zip code 71069 with a mortgage: 63 (8 second mortgage, 4 both second mortgage and home equity loan) Median monthly owner costs for units with a mortgage: $1,180 Median monthly owner costs for units without a mortgage: $308
Residents with income below the poverty level in 2022:
This zip code:
21.6%
Whole state:
18.6%
Residents with income below 50% of the poverty level in 2022:
This zip code:
7.8%
Whole state:
10.1%
Median number of rooms in houses and condos:
Here:
5.6
State:
6.2
Median number of rooms in apartments:
Here:
4.8
State:
4.4
Notable locations in this zip code not listed on our city pages
Churches in zip code 71069 include: Three States Church (A), Antioch Church (B), Arkadelphia Church (C), Pleasant Grove Church (D), Saint Matthew Church (E). Display/hide their locations on the map
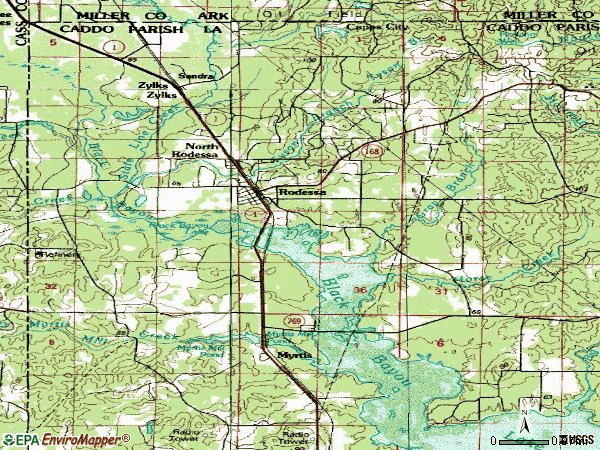
Streams, rivers, and creeks: Hoss Creek (A), Horse Creek (B), Gray Branch (C), State Line Creek (D), Tyson Branch (E). Display/hide their locations on the map
Size of family households: 55 2-persons, 10 3-persons, 9 4-persons, 15 5-persons, 3 7-or-more-persons
Size of nonfamily households: 157 1-person, 9 2-persons
60 married couples with children.
26 single-parent households (26 women).
99.3% of residents of 71069 zip code speak English at home.
1.3% of residents speak Spanish at home (100% very well).
0.2% of residents speak Asian or Pacific Island language at home (100% very well).
Foreign born population: 0 (0.0%)
:
0.0%
Whole state:
4.2%
20%African
19%American
8%Irish
6%German
Facilities with environmental interests located in this zip code:
HEATH BENTLEY LEASES - RODESSA FIELD (RODESSA FIELD in RODESSA, LA)
AIR MINOR (AIRS/AFS) Business SIC classification: CRUDE PETROLEUM AND NATURAL GAS Alternative names: C E HACKSTEDT, UMC HEATH BENTLEY, UMC THOMAS LEASE
R & R WASTE OIL CO (HWY 168 in RODESSA, LA)
(Resource Conservation and Recovery Act (tracking hazardous waste)) Organizations: SAMUEL THOMPSON AND RALPH E POWELL (CONTACT/OWNER)
BIB "O" (22299 LA HWY 1 in RODESSA, LA)
National Pollutant Discharge Elimination System NON-MAJOR (Tracking pollutant discharge elimination systems) - permit Alternative names: BIG "O"
PENNZOIL E P CO (6M N VIVIAN ON HWY 1 in RODESSA, LA)
AIR MINOR (AIRS/AFS) Business SIC classification: CRUDE PETROLEUM AND NATURAL GAS Alternative names: ED HOUSTON, PENNZOIL E & P COMPANY
PITTS TEAMER FEE 776 ROL LEASES - RODE (RODESSA FIELD in RODESSA, LA)
AIR MINOR (AIRS/AFS) Business SIC classification: CRUDE PETROLEUM AND NATURAL GAS Alternative names: PITTS TEAMER FEE 776 ROL LEASES RODESS, UMC PITTS TEAMER FEE
RADIUM PETROLEUM COMPANY (FRONT STREET in RODESSA, LA)
TRANSPORTER (Resource Conservation and Recovery Act (tracking hazardous waste))
RATCLIFF #2 PRODUCTION FACILITY - RODESS (7 KM NE OF in RODESSA, LA)
AIR MINOR (AIRS/AFS) Business SIC classification: CRUDE PETROLEUM AND NATURAL GAS
EWR TRUCKING (J S TEAMER #2 in RODESSA, LA)
National Pollutant Discharge Elimination System NON-MAJOR (Tracking pollutant discharge elimination systems) - permit
Housing units lacking complete plumbing facilities: 1.5% Housing units lacking complete kitchen facilities: 4.0%
57.7%Electricity
24.4%Utility gas
10.0%Bottled, tank, or LP gas
8.8%No fuel used
Population in 1990: 1,014.
Place of birth for U.S.-born residents:
This state: 347
Midwest: 31
South: 74
West: 25
59% of the 71069 zip code residents lived in the same house 5 years ago. Out of people who lived in different houses, 65% lived in this county. Out of people who lived in different counties, 50% lived in Louisiana.
79% of the 71069 zip code residents lived in the same house 1 year ago. Out of people who lived in different houses, 73% moved from this county. Out of people who lived in different houses, 21% moved from different state.
Private vs. public school enrollment:
Students in private schools in grades 1 to 8 (elementary and middle school):
Here:
0.0%
Louisiana:
19.6%
Students in private schools in grades 9 to 12 (high school):
Here:
0.0%
Louisiana:
18.3%
Students in private undergraduate colleges: 10
Here:
100.0%
Louisiana:
17.4%
Occupation by median earnings in the past 12 months ($)
30,107Production occupations
11,313Education, training, and library occupations
Top industries in this zip code by the number of employees in 2005:
Mining: Drilling Oil and Gas Wells (5-9 employees: 1 establishment)
Construction: Electrical Contractors (1-4: 1)
Mining: Crude Petroleum and Natural Gas Extraction (1-4: 1)
Mining: Support Activities for Oil and Gas Operations (1-4: 1)
Fatal accident statistics in 2013:
Fatal accident count: 1
Vehicles involved in fatal accidents: 1
Fatal accidents caused by drunken drivers: 0
Fatalities: 1
Persons involved in fatal accidents: 1
Pedestrians involved in fatal accidents: 0
Fatal accident statistics in 2011:
Fatal accident count: 1
Vehicles involved in fatal accidents: 1
Fatal accidents caused by drunken drivers: 1
Fatalities: 1
Persons involved in fatal accidents: 1
Pedestrians involved in fatal accidents: 0
Home Mortgage Disclosure Act Aggregated Statistics For Year 2009 (Based on 2 partial tracts)
A) FHA, FSA/RHS & VA Home Purchase Loans
B) Conventional Home Purchase Loans
C) Refinancings
D) Home Improvement Loans
F) Non-occupant Loans on < 5 Family Dwellings (A B C & D)
G) Loans On Manufactured Home Dwelling (A B C & D)
Number
Average Value
Number
Average Value
Number
Average Value
Number
Average Value
Number
Average Value
Number
Average Value
LOANS ORIGINATED
2
$77,410
2
$20,695
7
$136,684
6
$17,380
1
$23,480
3
$27,197
APPLICATIONS APPROVED, NOT ACCEPTED
0
$0
1
$24,280
0
$0
0
$0
0
$0
0
$0
APPLICATIONS DENIED
1
$89,150
1
$23,480
6
$119,333
3
$55,987
1
$34,630
2
$49,155
APPLICATIONS WITHDRAWN
0
$0
0
$0
0
$0
1
$63,680
0
$0
0
$0
FILES CLOSED FOR INCOMPLETENESS
0
$0
0
$0
1
$68,460
0
$0
0
$0
1
$44,180
Aggregated Statistics For Year 2008 (Based on 2 partial tracts)
A) FHA, FSA/RHS & VA Home Purchase Loans
B) Conventional Home Purchase Loans
C) Refinancings
D) Home Improvement Loans
G) Loans On Manufactured Home Dwelling (A B C & D)
Number
Average Value
Number
Average Value
Number
Average Value
Number
Average Value
Number
Average Value
LOANS ORIGINATED
1
$93,930
4
$83,480
5
$100,694
5
$12,498
3
$32,503
APPLICATIONS APPROVED, NOT ACCEPTED
0
$0
1
$80,790
1
$65,670
0
$0
1
$68,850
APPLICATIONS DENIED
0
$0
3
$65,140
7
$84,547
3
$15,653
3
$35,687
APPLICATIONS WITHDRAWN
0
$0
0
$0
0
$0
0
$0
0
$0
FILES CLOSED FOR INCOMPLETENESS
0
$0
0
$0
0
$0
0
$0
0
$0
Aggregated Statistics For Year 2007 (Based on 2 partial tracts)
B) Conventional Home Purchase Loans
C) Refinancings
D) Home Improvement Loans
F) Non-occupant Loans on < 5 Family Dwellings (A B C & D)
G) Loans On Manufactured Home Dwelling (A B C & D)
Number
Average Value
Number
Average Value
Number
Average Value
Number
Average Value
Number
Average Value
LOANS ORIGINATED
6
$48,225
7
$103,196
6
$8,425
2
$41,590
6
$26,135
APPLICATIONS APPROVED, NOT ACCEPTED
1
$91,140
4
$109,948
0
$0
0
$0
2
$88,355
APPLICATIONS DENIED
8
$53,680
6
$124,972
4
$49,452
1
$45,770
6
$62,950
APPLICATIONS WITHDRAWN
0
$0
1
$62,090
0
$0
0
$0
0
$0
FILES CLOSED FOR INCOMPLETENESS
0
$0
0
$0
0
$0
0
$0
0
$0
Aggregated Statistics For Year 2006 (Based on 2 partial tracts)
A) FHA, FSA/RHS & VA Home Purchase Loans
B) Conventional Home Purchase Loans
C) Refinancings
D) Home Improvement Loans
F) Non-occupant Loans on < 5 Family Dwellings (A B C & D)
G) Loans On Manufactured Home Dwelling (A B C & D)
Number
Average Value
Number
Average Value
Number
Average Value
Number
Average Value
Number
Average Value
Number
Average Value
LOANS ORIGINATED
2
$98,905
8
$76,864
8
$48,059
7
$25,244
1
$35,820
10
$34,347
APPLICATIONS APPROVED, NOT ACCEPTED
0
$0
2
$41,195
2
$81,590
1
$11,940
0
$0
2
$25,275
APPLICATIONS DENIED
0
$0
4
$76,118
4
$72,835
6
$24,212
0
$0
5
$44,258
APPLICATIONS WITHDRAWN
0
$0
1
$30,250
4
$57,810
0
$0
0
$0
0
$0
FILES CLOSED FOR INCOMPLETENESS
0
$0
0
$0
1
$88,360
0
$0
0
$0
0
$0
Aggregated Statistics For Year 2005 (Based on 2 partial tracts)
A) FHA, FSA/RHS & VA Home Purchase Loans
B) Conventional Home Purchase Loans
C) Refinancings
D) Home Improvement Loans
F) Non-occupant Loans on < 5 Family Dwellings (A B C & D)
G) Loans On Manufactured Home Dwelling (A B C & D)
Number
Average Value
Number
Average Value
Number
Average Value
Number
Average Value
Number
Average Value
Number
Average Value
LOANS ORIGINATED
0
$0
10
$45,452
6
$50,812
7
$6,596
1
$18,710
4
$23,780
APPLICATIONS APPROVED, NOT ACCEPTED
0
$0
3
$67,527
2
$57,310
0
$0
0
$0
2
$51,540
APPLICATIONS DENIED
1
$42,980
4
$93,232
4
$64,078
4
$21,095
0
$0
4
$41,392
APPLICATIONS WITHDRAWN
0
$0
2
$71,840
1
$96,710
0
$0
0
$0
0
$0
FILES CLOSED FOR INCOMPLETENESS
0
$0
0
$0
0
$0
0
$0
0
$0
0
$0
Aggregated Statistics For Year 2004 (Based on 2 partial tracts)
A) FHA, FSA/RHS & VA Home Purchase Loans
B) Conventional Home Purchase Loans
C) Refinancings
D) Home Improvement Loans
F) Non-occupant Loans on < 5 Family Dwellings (A B C & D)
G) Loans On Manufactured Home Dwelling (A B C & D)
Number
Average Value
Number
Average Value
Number
Average Value
Number
Average Value
Number
Average Value
Number
Average Value
LOANS ORIGINATED
1
$83,180
9
$56,339
9
$49,440
6
$23,217
0
$0
7
$32,579
APPLICATIONS APPROVED, NOT ACCEPTED
0
$0
2
$46,965
4
$66,665
0
$0
0
$0
1
$62,090
APPLICATIONS DENIED
0
$0
4
$34,725
7
$68,911
3
$23,350
1
$31,840
4
$50,448
APPLICATIONS WITHDRAWN
0
$0
2
$71,440
3
$83,847
1
$37,810
1
$42,590
0
$0
FILES CLOSED FOR INCOMPLETENESS
0
$0
0
$0
0
$0
0
$0
0
$0
0
$0
Aggregated Statistics For Year 2003 (Based on 2 partial tracts)
A) FHA, FSA/RHS & VA Home Purchase Loans
B) Conventional Home Purchase Loans
C) Refinancings
D) Home Improvement Loans
F) Non-occupant Loans on < 5 Family Dwellings (A B C & D)
Number
Average Value
Number
Average Value
Number
Average Value
Number
Average Value
Number
Average Value
LOANS ORIGINATED
1
$53,330
6
$37,810
7
$51,399
4
$15,920
1
$9,150
APPLICATIONS APPROVED, NOT ACCEPTED
0
$0
5
$46,726
1
$44,180
0
$0
0
$0
APPLICATIONS DENIED
0
$0
7
$36,047
8
$54,228
2
$30,050
1
$56,910
APPLICATIONS WITHDRAWN
0
$0
2
$88,555
2
$69,250
0
$0
0
$0
FILES CLOSED FOR INCOMPLETENESS
0
$0
0
$0
1
$119,400
0
$0
0
$0
Aggregated Statistics For Year 1999 (Based on 1 partial tract)
A) FHA, FSA/RHS & VA Home Purchase Loans
B) Conventional Home Purchase Loans
C) Refinancings
D) Home Improvement Loans
F) Non-occupant Loans on < 5 Family Dwellings (A B C & D)
Detailed PMIC statistics for the following Tracts:0251.00
2002 - 2018 National Fire Incident Reporting System (NFIRS) incidents
Based on the data from the years 2002 - 2018 the average number of fire incidents per year is 15. The highest number of fires - 37 took place in 2011, and the least - 4 in 2007. The data has a dropping trend.
When looking into fire subcategories, the most reports belonged to: Outside Fires (70.7%), and Structure Fires (21.7%).
Fire incident types reported to NFIRS in Zip Code 71069


 Nearest zip codes: 75565, 71044, 71043, 71082, 71834, 75555.


 Based on the data from the years 2002 - 2018 the average number of fire incidents per year is 15. The highest number of fires - 37 took place in 2011, and the least - 4 in 2007. The data has a dropping trend.
 When looking into fire subcategories, the most reports belonged to: Outside Fires (70.7%), and Structure Fires (21.7%).