Estimated zip code population in 2022: 4,386 Zip code population in 2010: 4,189 Zip code population in 2000: 3,956
Houses and condos: 1,897 Renter-occupied apartments: 190
% of renters here:
11%
State:
35%
March 2022 cost of living index in zip code 73054: 81.6 (low, U.S. average is 100)
Land area: 91.4 sq. mi. Water area: 0.2 sq. mi.
Population density: 48 people per square mile
(very low).
OSM Map
General Map
Google Map
MSN Map
OSM Map
General Map
Google Map
MSN Map
OSM Map
General Map
Google Map
MSN Map
OSM Map
General Map
Google Map
MSN Map
Please wait while loading the map...
Real estate property taxes paid for housing units in 2022:
This zip code:
0.3% ($718)
Oklahoma:
0.8% ($1,501)
Median real estate property taxes paid for housing units with mortgages in 2022: $1,468 (0.7%) Median real estate property taxes paid for housing units with no mortgage in 2022: $533 (0.2%)
Averages for the 2020 tax year for zip code 73054, filed in 2021:
Average Adjusted Gross Income (AGI) in 2020: $65,286 (Individual Income Tax Returns)
Here:
$65,286
State:
$63,060
Salary/wage: $57,740 (reported on 83.3% of returns)
Here:
$57,740
State:
$52,427
(% of AGI for various income ranges: 1070.0% for AGIs below $25k, 3565.9% for AGIs $25k-50k, 7188.9% for AGIs $50k-75k, 8271.3% for AGIs $75k-100k, 16579.4% for AGIs $100k-200k, 57770.0% for AGIs over 200k)
Taxable interest for individuals: $773 (reported on 28.6% of returns)
This zip code:
$773
Oklahoma:
$1,603
(% of AGI for various income ranges: 10.0% for AGIs below $25k, 10.0% for AGIs $25k-50k, 26.1% for AGIs $50k-75k, 36.7% for AGIs $75k-100k, 81.7% for AGIs $100k-200k, 286.7% for AGIs over 200k)
Ordinary dividends: $3,413 (reported on 12.0% of returns)
Here:
$3,413
State:
$7,001
(% of AGI for various income ranges: 19.4% for AGIs below $25k, 11.2% for AGIs $25k-50k, 10.6% for AGIs $50k-75k, 68.0% for AGIs $75k-100k, 248.3% for AGIs $100k-200k, 253.3% for AGIs over 200k)
Net capital gain/loss in AGI: +$9,083 (reported on 12.5% of returns)
Here:
+$9,083
State:
+$19,855
(% of AGI for various income ranges: 15.9% for AGIs below $25k, 23.7% for AGIs $25k-50k, 119.4% for AGIs $50k-75k, 132.7% for AGIs $75k-100k, 362.8% for AGIs $100k-200k, 3126.7% for AGIs over 200k)
Profit/loss from business: +$7,971 (reported on 21.9% of returns)
Here:
+$7,971
State:
+$9,904
(% of AGI for various income ranges: 188.8% for AGIs below $25k, 163.2% for AGIs $25k-50k, 331.1% for AGIs $50k-75k, 184.7% for AGIs $75k-100k, 256.1% for AGIs $100k-200k, 1400.0% for AGIs over 200k)
Taxable individual retirement arrangement distribution: $23,431 (reported on 6.8% of returns)
73054:
$23,431
Oklahoma:
$20,476
(% of AGI for various income ranges: 48.2% for AGIs below $25k, 52.2% for AGIs $25k-50k, 325.0% for AGIs $50k-75k, 1117.2% for AGIs $100k-200k)
Total itemized deductions: $43,343 (reported on 7.3% of returns)
Here:
$43,343
State:
$39,736
(% of AGI for various income ranges: 691.7% for AGIs $50k-75k, 908.9% for AGIs $100k-200k, 10623.3% for AGIs over 200k)
Charity contributions: $11,473 (reported on 5.7% of returns)
Here:
$11,473
State:
$17,288
(% of AGI for various income ranges: 141.7% for AGIs $50k-75k, 253.9% for AGIs $100k-200k, 1833.3% for AGIs over 200k)
Taxes paid: $7,436 (reported on 7.3% of returns)
73054:
$7,436
State:
$7,046
(% of AGI for various income ranges: 140.6% for AGIs $50k-75k, 223.9% for AGIs $100k-200k, 1283.3% for AGIs over 200k)
Earned income credit: $2,550 (reported on 19.8% of returns)
Here:
$2,550
State:
$2,435
(% of AGI for various income ranges: 113.1% for AGIs below $25k, 101.2% for AGIs $25k-50k)
Percentage of individuals using paid preparers for their 2020 taxes: 94.3%
Here:
94%
State:
94%
(% for various income ranges: 90.5% for AGIs below $25k, 95.9% for AGIs $25k-50k, 96.2% for AGIs $50k-75k, 94.4% for AGIs $75k-100k, 96.4% for AGIs $100k-200k, 100.0% for AGIs over 200k)
Averages for the 2012 tax year for zip code 73054, filed in 2013:
Average Adjusted Gross Income (AGI) in 2012: $55,400 (Individual Income Tax Returns)
Here:
$55,400
State:
$58,581
Salary/wage: $47,391 (reported on 85.5% of returns)
Here:
$47,391
State:
$45,973
(% of AGI for various income ranges: 74.6% for AGIs below $25k, 81.6% for AGIs $25k-50k, 79.8% for AGIs $50k-75k, 76.5% for AGIs $75k-100k, 77.9% for AGIs $100k-200k, 52.9% for AGIs over 200k)
Taxable interest for individuals: $770 (reported on 29.6% of returns)
This zip code:
$770
Oklahoma:
$1,625
(% of AGI for various income ranges: 0.4% for AGIs below $25k, 0.5% for AGIs $25k-50k, 0.4% for AGIs $50k-75k, 0.2% for AGIs $75k-100k, 0.6% for AGIs $100k-200k, 0.3% for AGIs over 200k)
Ordinary dividends: $2,053 (reported on 10.7% of returns)
Here:
$2,053
State:
$6,374
(% of AGI for various income ranges: 0.5% for AGIs below $25k, 0.6% for AGIs $25k-50k, 0.3% for AGIs $50k-75k, 0.2% for AGIs $75k-100k, 0.8% for AGIs $100k-200k)
Net capital gain/loss in AGI: +$18,367 (reported on 9.4% of returns)
Here:
+$18,367
State:
+$24,023
(% of AGI for various income ranges: 0.3% for AGIs below $25k, 1.5% for AGIs $50k-75k, 2.4% for AGIs $100k-200k, 11.3% for AGIs over 200k)
Profit/loss from business: +$10,352 (reported on 18.2% of returns)
Here:
+$10,352
State:
+$11,913
(% of AGI for various income ranges: 13.5% for AGIs below $25k, 4.3% for AGIs $25k-50k, 3.2% for AGIs $50k-75k, 3.6% for AGIs $75k-100k, 2.0% for AGIs $100k-200k)
Taxable individual retirement arrangement distribution: $13,455 (reported on 6.9% of returns)
73054:
$13,455
Oklahoma:
$15,242
(% of AGI for various income ranges: 1.4% for AGIs below $25k, 1.6% for AGIs $25k-50k, 4.9% for AGIs $50k-75k, 2.1% for AGIs $100k-200k)
Total itemized deductions: $25,320 (22% of AGI, reported on 25.2% of returns)
Here:
$25,320
State:
$24,882
Here:
22.2% of AGI
State:
18.8% of AGI
(% of AGI for various income ranges: 11.9% for AGIs below $25k, 7.0% for AGIs $25k-50k, 10.1% for AGIs $50k-75k, 11.5% for AGIs $75k-100k, 12.5% for AGIs $100k-200k, 15.1% for AGIs over 200k)
Charity contributions: $6,169 (reported on 16.4% of returns)
Here:
$6,169
State:
$6,591
(% of AGI for various income ranges: 0.7% for AGIs below $25k, 0.7% for AGIs $25k-50k, 1.1% for AGIs $50k-75k, 1.7% for AGIs $75k-100k, 2.1% for AGIs $100k-200k, 3.6% for AGIs over 200k)
Taxes paid: $6,220 (reported on 25.2% of returns)
73054:
$6,220
State:
$7,196
(% of AGI for various income ranges: 0.8% for AGIs below $25k, 1.1% for AGIs $25k-50k, 1.9% for AGIs $50k-75k, 2.5% for AGIs $75k-100k, 4.0% for AGIs $100k-200k, 4.9% for AGIs over 200k)
Earned income credit: $2,536 (reported on 22.6% of returns)
Here:
$2,536
State:
$2,354
(% of AGI for various income ranges: 8.5% for AGIs below $25k, 1.7% for AGIs $25k-50k)
Percentage of individuals using paid preparers for their 2012 taxes: 54.1%
Here:
54%
State:
56%
(% for various income ranges: 46.7% for AGIs below $25k, 53.7% for AGIs $25k-50k, 58.3% for AGIs $50k-75k, 66.7% for AGIs $75k-100k, 60.0% for AGIs $100k-200k, 75.0% for AGIs over 200k)
Averages for the 2004 tax year for zip code 73054, filed in 2005:
Average Adjusted Gross Income (AGI) in 2004: $36,336 (Individual Income Tax Returns)
Here:
$36,336
State:
$41,245
Salary/wage: $33,827 (reported on 85.7% of returns)
Here:
$33,827
State:
$35,318
(% of AGI for various income ranges: 156.1% for AGIs below $10k, 76.8% for AGIs $10k-25k, 84.1% for AGIs $25k-50k, 86.5% for AGIs $50k-75k, 89.0% for AGIs $75k-100k, 56.9% for AGIs over 100k)
Taxable interest for individuals: $910 (reported on 33.4% of returns)
This zip code:
$910
Oklahoma:
$1,745
(% of AGI for various income ranges: 6.7% for AGIs below $10k, 1.3% for AGIs $10k-25k, 0.9% for AGIs $25k-50k, 0.5% for AGIs $50k-75k, 0.4% for AGIs $75k-100k, 0.6% for AGIs over 100k)
Taxable dividends: $1,013 (reported on 10.1% of returns)
Here:
$1,013
State:
$2,920
(% of AGI for various income ranges: 3.8% for AGIs below $10k, 0.4% for AGIs $10k-25k, 0.2% for AGIs $25k-50k, 0.2% for AGIs $50k-75k, 0.1% for AGIs $75k-100k, 0.3% for AGIs over 100k)
Net capital gain/loss: +$6,329 (reported on 9.9% of returns)
Here:
+$6,329
State:
+$10,653
(% of AGI for various income ranges: 3.3% for AGIs below $10k, -0.0% for AGIs $10k-25k, 0.5% for AGIs $25k-50k, 0.6% for AGIs $50k-75k, 6.6% for AGIs over 100k)
Profit/loss from business: +$8,267 (reported on 20.0% of returns)
Here:
+$8,267
State:
+$8,532
(% of AGI for various income ranges: 14.1% for AGIs below $10k, 12.0% for AGIs $10k-25k, 3.8% for AGIs $25k-50k, 2.7% for AGIs $50k-75k, 1.0% for AGIs $75k-100k, 4.7% for AGIs over 100k)
IRA payment deduction: $2,462 (reported on 1.7% of returns)
73054:
$2,462
Oklahoma:
$3,127
Total itemized deductions: $16,480 (23% of AGI, reported on 25.5% of returns)
Here:
$16,480
State:
$17,093
Here:
23.5% of AGI
State:
20.5% of AGI
(% of AGI for various income ranges: 8.1% for AGIs $10k-25k, 10.3% for AGIs $25k-50k, 10.3% for AGIs $50k-75k, 14.7% for AGIs $75k-100k, 15.6% for AGIs over 100k)
Charity contributions deductions: $2,724 (4% of AGI, reported on 21.0% of returns)
Here:
$2,724
State:
$4,240
Here:
4.0% of AGI
State:
4.8% of AGI
(% of AGI for various income ranges: 0.9% for AGIs $10k-25k, 1.6% for AGIs $25k-50k, 1.3% for AGIs $50k-75k, 2.4% for AGIs $75k-100k, 1.9% for AGIs over 100k)
Total tax: $4,534 (reported on 72.4% of returns)
73054:
$4,534
State:
$6,542
(% of AGI for various income ranges: 5.9% for AGIs below $10k, 4.3% for AGIs $10k-25k, 5.9% for AGIs $25k-50k, 8.4% for AGIs $50k-75k, 10.4% for AGIs $75k-100k, 16.0% for AGIs over 100k)
Earned income credit: $1,831 (reported on 22.9% of returns)
Here:
$1,831
State:
$1,830
Percentage of individuals using paid preparers for their 2004 taxes: 61.0%
Here:
61%
State:
63%
(% for various income ranges: 54.8% for AGIs below $10k, 60.4% for AGIs $10k-25k, 62.0% for AGIs $25k-50k, 63.3% for AGIs $50k-75k, 68.2% for AGIs $75k-100k, 70.8% for AGIs over 100k)
Likely homosexual households (counted as self-reported same-sex unmarried-partner households)
Lesbian couples: 0.1% of all households
Gay men: 0.3% of all households
Household received Food Stamps/SNAP in the past 12 months: 275 Household did not receive Food Stamps/SNAP in the past 12 months: 1,492
Women who had a birth in the past 12 months: 120 (33 now married, 83 unmarried) Women who did not have a birth in the past 12 months: 808 (393 now married, 414 unmarried)
Housing units in zip code 73054 with a mortgage: 682 (26 second mortgage, 18 both second mortgage and home equity loan) Houses without a mortgage: 3
Median monthly owner costs for units with a mortgage: $1,416 Median monthly owner costs for units without a mortgage: $275
Residents with income below the poverty level in 2022:
This zip code:
6.9%
Whole state:
15.7%
Residents with income below 50% of the poverty level in 2022:
This zip code:
2.3%
Whole state:
8.3%
Median number of rooms in houses and condos:
Here:
5.8
State:
6.1
Median number of rooms in apartments:
Here:
5.0
State:
4.5
Notable locations in this zip code not listed on our city pages
Notable locations in zip code 73054: Hickory Hills Volunteer Fire Department (A), Luther Volunteer Fire Department (B). Display/hide their locations on the map
Cemeteries: Jordan Cemetery (1), Saint Paul Baptist Cemetery (2), Luther Cemetery (3), Reunion Cemetery (4), Saint Luke Cemetery (5), Sweat Cemetery (6), Tillman Cemetery (7). Display/hide their locations on the map
Reservoirs: Booher Lake (A), Bear Fall Coon Creek Site 32 Reservoir (B), Bear Fall Coon Creek Site 20 Reservoir (C), Bear Fall Coon Creek Site 21 Reservoir (D), Bear Fall Coon Creek Site 22 Reservoir (E), Bear Fall Coon Creek Site 23 Reservoir (F), Bear Fall Coon Creek Site 25 Reservoir (G), Bear Fall Coon Creek Site 26 Reservoir (H). Display/hide their locations on the map
Size of family households: 478 2-persons, 289 3-persons, 180 4-persons, 80 5-persons, 79 6-persons, 15 7-or-more-persons
Size of nonfamily households: 568 1-person, 72 2-persons
639 married couples with children.
155 single-parent households (50 men, 105 women).
98.0% of residents of 73054 zip code speak English at home.
1.1% of residents speak Spanish at home (73% very well, 16% well, 4% not well, 7% not at all).
0.4% of residents speak other Indo-European language at home (29% very well, 71% well).
0.1% of residents speak Asian or Pacific Island language at home (100% very well).
0.2% of residents speak other language at home (100% very well).
Foreign born population: 48 (1.1%) (53.2% of them are naturalized citizens)
This zip code:
1.1%
Whole state:
6.0%
27%Bolivia
23%Honduras
12%Sweden
10%United Kingdom, excluding England and Scotland
10%France
8%Malaysia
8%Barbados
16%English
15%German
11%American
4%Irish
2%Italian
2%Scottish
1%Polish
Year of entry for the foreign-born population
52010 or later
262000 to 2009
21990 to 1999
33Before 1990
Facilities with environmental interests located in this zip code:
LUTHER ES (900 S. DOGWOOD in LUTHER, OK)
(National Center for Education Statistics) - STATE ID-55-I003-105
LUTHER HS (320 S.E. 2ND ST. in LUTHER, OK)
(National Center for Education Statistics) - STATE ID-55-I003-705
LUTHER MS (800 S. DOGWOOD in LUTHER, OK)
(National Center for Education Statistics) - STATE ID-55-I003-505
APAC OKLAHOMA HH ASPHALT PLANT (16901 E. HOGBACK RD. in LUTHER, OK)
TRI REPORTER (Tracking of toxic chemicals releasing facilities) Business SIC classification: ASPHALT PAVING MIXTURES AND BLOCKS Alternative names: APAC-OKLAHOMA SHAWNEE DIV.
Housing units lacking complete plumbing facilities: 4.0% Housing units lacking complete kitchen facilities: 1.1%
48.4%Electricity
39.7%Bottled, tank, or LP gas
8.1%Utility gas
2.9%Wood
0.6%Other fuel
Population in 1990: 2,111. Population change in the 1990s: +1,845 (+87.4%).
Place of birth for U.S.-born residents:
This state: 2,839
Northeast: 82
Midwest: 412
South: 643
West: 336
60% of the 73054 zip code residents lived in the same house 5 years ago. Out of people who lived in different houses, 53% lived in this county. Out of people who lived in different counties, 50% lived in Oklahoma.
97% of the 73054 zip code residents lived in the same house 1 year ago. Out of people who lived in different houses, 10% moved from this county. Out of people who lived in different houses, 69% moved from different county within same state. Out of people who lived in different houses, 58% moved from different state.
Private vs. public school enrollment:
Students in private schools in grades 1 to 8 (elementary and middle school): 150
Here:
38.1%
Oklahoma:
11.7%
Students in private schools in grades 9 to 12 (high school): 66
Here:
32.1%
Oklahoma:
11.7%
Students in private undergraduate colleges: 5
Here:
7.5%
Oklahoma:
19.3%
Occupation by median earnings in the past 12 months ($)
124,183Legal occupations
99,243Fire fighting and prevention, and other protective service workers including supervisors
89,014Law enforcement workers including supervisors
83,325Management occupations
82,795Business and financial operations occupations
77,813Health diagnosing and treating practitioners and other technical occupations
Top industries in this zip code by the number of employees in 2005:
Finance and Insurance: Commercial Banking (10-19 employees: 1 establishment)
Construction: Framing Contractors (5-9: 1)
Health Care and Social Assistance: Child Day Care Services (5-9: 1)
Professional, Scientific, and Technical Services: Offices of Certified Public Accountants (5-9: 1)
Construction: Painting and Wall Covering Contractors (5-9: 1)
People in group quarters in 2000:
162 people in nursing homes
Fatal accident statistics in 2014:
Fatal accident count: 1
Vehicles involved in fatal accidents: 1
Fatal accidents caused by drunken drivers: 0
Fatalities: 1
Persons involved in fatal accidents: 1
Pedestrians involved in fatal accidents: 0
Fatal accident statistics in 2013:
Fatal accident count: 1
Vehicles involved in fatal accidents: 2
Fatal accidents caused by drunken drivers: 0
Fatalities: 1
Persons involved in fatal accidents: 2
Pedestrians involved in fatal accidents: 0
Home Mortgage Disclosure Act Aggregated Statistics For Year 2009 (Based on 4 partial tracts)
A) FHA, FSA/RHS & VA Home Purchase Loans
B) Conventional Home Purchase Loans
C) Refinancings
D) Home Improvement Loans
F) Non-occupant Loans on < 5 Family Dwellings (A B C & D)
G) Loans On Manufactured Home Dwelling (A B C & D)
Number
Average Value
Number
Average Value
Number
Average Value
Number
Average Value
Number
Average Value
Number
Average Value
LOANS ORIGINATED
21
$172,702
85
$281,066
264
$257,519
36
$55,892
17
$392,423
28
$61,433
APPLICATIONS APPROVED, NOT ACCEPTED
4
$133,378
7
$195,853
13
$259,914
4
$132,648
1
$272,620
4
$41,098
APPLICATIONS DENIED
8
$220,781
13
$167,135
92
$202,371
18
$58,421
6
$82,270
16
$73,825
APPLICATIONS WITHDRAWN
2
$105,070
8
$298,758
50
$228,081
2
$45,950
0
$0
10
$82,424
FILES CLOSED FOR INCOMPLETENESS
0
$0
1
$118,700
22
$138,204
2
$182,645
0
$0
1
$159,690
Aggregated Statistics For Year 2008 (Based on 4 partial tracts)
A) FHA, FSA/RHS & VA Home Purchase Loans
B) Conventional Home Purchase Loans
C) Refinancings
D) Home Improvement Loans
F) Non-occupant Loans on < 5 Family Dwellings (A B C & D)
G) Loans On Manufactured Home Dwelling (A B C & D)
Number
Average Value
Number
Average Value
Number
Average Value
Number
Average Value
Number
Average Value
Number
Average Value
LOANS ORIGINATED
20
$128,923
121
$282,051
141
$202,756
36
$50,121
18
$351,587
36
$65,635
APPLICATIONS APPROVED, NOT ACCEPTED
0
$0
11
$226,398
10
$243,005
1
$130,190
0
$0
4
$76,812
APPLICATIONS DENIED
4
$94,918
26
$164,908
75
$223,627
18
$58,651
4
$37,650
22
$65,562
APPLICATIONS WITHDRAWN
1
$65,260
17
$331,099
31
$174,236
4
$158,902
2
$50,925
4
$37,950
FILES CLOSED FOR INCOMPLETENESS
0
$0
2
$52,325
8
$190,266
1
$108,740
0
$0
4
$66,090
Aggregated Statistics For Year 2007 (Based on 4 partial tracts)
A) FHA, FSA/RHS & VA Home Purchase Loans
B) Conventional Home Purchase Loans
C) Refinancings
D) Home Improvement Loans
F) Non-occupant Loans on < 5 Family Dwellings (A B C & D)
G) Loans On Manufactured Home Dwelling (A B C & D)
Number
Average Value
Number
Average Value
Number
Average Value
Number
Average Value
Number
Average Value
Number
Average Value
LOANS ORIGINATED
12
$130,007
145
$228,139
134
$196,966
47
$53,068
19
$190,298
37
$61,516
APPLICATIONS APPROVED, NOT ACCEPTED
0
$0
18
$208,103
17
$203,241
5
$53,262
0
$0
12
$97,730
APPLICATIONS DENIED
7
$94,640
25
$114,080
74
$166,996
31
$35,799
4
$76,005
29
$65,812
APPLICATIONS WITHDRAWN
1
$144,410
18
$154,073
31
$217,743
5
$154,998
2
$96,490
6
$85,262
FILES CLOSED FOR INCOMPLETENESS
1
$280,280
7
$199,903
9
$158,649
2
$114,870
1
$113,340
0
$0
Aggregated Statistics For Year 2006 (Based on 4 partial tracts)
A) FHA, FSA/RHS & VA Home Purchase Loans
B) Conventional Home Purchase Loans
C) Refinancings
D) Home Improvement Loans
F) Non-occupant Loans on < 5 Family Dwellings (A B C & D)
G) Loans On Manufactured Home Dwelling (A B C & D)
Number
Average Value
Number
Average Value
Number
Average Value
Number
Average Value
Number
Average Value
Number
Average Value
LOANS ORIGINATED
18
$114,388
175
$217,956
168
$181,780
45
$37,549
19
$161,095
34
$72,118
APPLICATIONS APPROVED, NOT ACCEPTED
2
$142,345
31
$177,509
17
$139,110
5
$55,396
1
$7,660
12
$54,280
APPLICATIONS DENIED
3
$69,170
32
$144,382
107
$132,435
27
$37,210
6
$189,247
37
$49,351
APPLICATIONS WITHDRAWN
1
$39,060
21
$165,716
52
$136,904
6
$53,940
5
$120,540
6
$58,510
FILES CLOSED FOR INCOMPLETENESS
0
$0
7
$239,914
13
$180,225
3
$99,043
2
$154,690
0
$0
Aggregated Statistics For Year 2005 (Based on 4 partial tracts)
A) FHA, FSA/RHS & VA Home Purchase Loans
B) Conventional Home Purchase Loans
C) Refinancings
D) Home Improvement Loans
F) Non-occupant Loans on < 5 Family Dwellings (A B C & D)
G) Loans On Manufactured Home Dwelling (A B C & D)
Number
Average Value
Number
Average Value
Number
Average Value
Number
Average Value
Number
Average Value
Number
Average Value
LOANS ORIGINATED
24
$101,430
160
$176,984
146
$156,796
42
$66,180
24
$108,454
28
$74,780
APPLICATIONS APPROVED, NOT ACCEPTED
2
$88,835
14
$118,589
17
$181,921
4
$35,712
2
$65,475
8
$66,241
APPLICATIONS DENIED
2
$138,800
38
$89,651
98
$122,459
29
$43,092
4
$44,225
34
$57,626
APPLICATIONS WITHDRAWN
3
$100,903
21
$164,096
69
$125,630
14
$86,613
2
$108,745
4
$82,792
FILES CLOSED FOR INCOMPLETENESS
1
$52,840
6
$224,890
13
$203,339
0
$0
0
$0
0
$0
Aggregated Statistics For Year 2004 (Based on 4 partial tracts)
A) FHA, FSA/RHS & VA Home Purchase Loans
B) Conventional Home Purchase Loans
C) Refinancings
D) Home Improvement Loans
F) Non-occupant Loans on < 5 Family Dwellings (A B C & D)
G) Loans On Manufactured Home Dwelling (A B C & D)
Number
Average Value
Number
Average Value
Number
Average Value
Number
Average Value
Number
Average Value
Number
Average Value
LOANS ORIGINATED
11
$84,902
115
$168,262
186
$147,114
41
$32,984
9
$125,377
33
$57,608
APPLICATIONS APPROVED, NOT ACCEPTED
0
$0
15
$174,745
30
$126,717
4
$34,308
3
$19,450
7
$47,840
APPLICATIONS DENIED
3
$72,940
36
$71,595
81
$126,483
26
$39,297
12
$41,633
35
$47,801
APPLICATIONS WITHDRAWN
0
$0
11
$140,777
69
$112,492
5
$137,844
0
$0
6
$66,448
FILES CLOSED FOR INCOMPLETENESS
0
$0
3
$134,780
14
$156,642
1
$76,580
1
$58,200
0
$0
Aggregated Statistics For Year 2003 (Based on 4 partial tracts)
A) FHA, FSA/RHS & VA Home Purchase Loans
B) Conventional Home Purchase Loans
C) Refinancings
D) Home Improvement Loans
F) Non-occupant Loans on < 5 Family Dwellings (A B C & D)
Number
Average Value
Number
Average Value
Number
Average Value
Number
Average Value
Number
Average Value
LOANS ORIGINATED
15
$87,975
96
$154,867
306
$152,542
30
$31,742
10
$58,316
APPLICATIONS APPROVED, NOT ACCEPTED
0
$0
25
$83,832
35
$139,415
0
$0
2
$30,630
APPLICATIONS DENIED
3
$71,697
26
$90,654
112
$103,721
18
$16,954
5
$47,326
APPLICATIONS WITHDRAWN
0
$0
10
$148,668
57
$152,774
2
$11,870
1
$88,070
FILES CLOSED FOR INCOMPLETENESS
0
$0
8
$125,271
22
$163,079
0
$0
2
$70,335
Aggregated Statistics For Year 2002 (Based on 2 partial tracts)
A) FHA, FSA/RHS & VA Home Purchase Loans
B) Conventional Home Purchase Loans
C) Refinancings
D) Home Improvement Loans
F) Non-occupant Loans on < 5 Family Dwellings (A B C & D)
Number
Average Value
Number
Average Value
Number
Average Value
Number
Average Value
Number
Average Value
LOANS ORIGINATED
5
$122,374
90
$161,303
183
$168,752
20
$33,772
11
$103,453
APPLICATIONS APPROVED, NOT ACCEPTED
0
$0
11
$156,293
28
$145,392
5
$25,884
2
$34,845
APPLICATIONS DENIED
0
$0
21
$112,244
40
$105,910
8
$24,122
5
$41,354
APPLICATIONS WITHDRAWN
1
$64,330
8
$140,524
27
$168,901
0
$0
2
$62,030
FILES CLOSED FOR INCOMPLETENESS
0
$0
2
$75,430
19
$173,313
0
$0
0
$0
Aggregated Statistics For Year 2001 (Based on 2 partial tracts)
A) FHA, FSA/RHS & VA Home Purchase Loans
B) Conventional Home Purchase Loans
C) Refinancings
D) Home Improvement Loans
E) Loans on Dwellings For 5+ Families
F) Non-occupant Loans on < 5 Family Dwellings (A B C & D)
Number
Average Value
Number
Average Value
Number
Average Value
Number
Average Value
Number
Average Value
Number
Average Value
LOANS ORIGINATED
5
$82,094
86
$142,492
158
$155,196
23
$37,391
1
$13,780
12
$136,312
APPLICATIONS APPROVED, NOT ACCEPTED
0
$0
15
$127,991
16
$171,539
5
$46,408
0
$0
5
$108,590
APPLICATIONS DENIED
2
$78,495
37
$47,045
63
$131,450
10
$24,965
0
$0
5
$175,368
APPLICATIONS WITHDRAWN
1
$40,590
5
$160,052
33
$116,611
7
$38,946
0
$0
5
$44,722
FILES CLOSED FOR INCOMPLETENESS
0
$0
1
$229,740
9
$180,729
0
$0
0
$0
0
$0
Aggregated Statistics For Year 2000 (Based on 2 partial tracts)
A) FHA, FSA/RHS & VA Home Purchase Loans
B) Conventional Home Purchase Loans
C) Refinancings
D) Home Improvement Loans
F) Non-occupant Loans on < 5 Family Dwellings (A B C & D)
Number
Average Value
Number
Average Value
Number
Average Value
Number
Average Value
Number
Average Value
LOANS ORIGINATED
2
$45,950
67
$111,898
54
$136,171
20
$25,731
10
$62,489
APPLICATIONS APPROVED, NOT ACCEPTED
1
$47,480
21
$54,262
10
$95,419
4
$35,035
3
$35,737
APPLICATIONS DENIED
1
$29,100
44
$44,608
42
$77,382
8
$10,051
7
$53,606
APPLICATIONS WITHDRAWN
1
$75,050
2
$68,920
25
$124,305
1
$13,780
1
$39,820
FILES CLOSED FOR INCOMPLETENESS
0
$0
2
$89,980
8
$93,428
0
$0
1
$65,090
Aggregated Statistics For Year 1999 (Based on 2 partial tracts)
A) FHA, FSA/RHS & VA Home Purchase Loans
B) Conventional Home Purchase Loans
C) Refinancings
D) Home Improvement Loans
F) Non-occupant Loans on < 5 Family Dwellings (A B C & D)
Detailed PMIC statistics for the following Tracts:1081.03
, 1090.01
2002 - 2018 National Fire Incident Reporting System (NFIRS) incidents
According to the data from the years 2002 - 2018 the average number of fires per year is 52. The highest number of reported fires - 81 took place in 2011, and the least - 10 in 2007. The data has a declining trend.
When looking into fire subcategories, the most reports belonged to: Outside Fires (69.1%), and Structure Fires (18.7%).
Fire incident types reported to NFIRS in Zip Code 73054

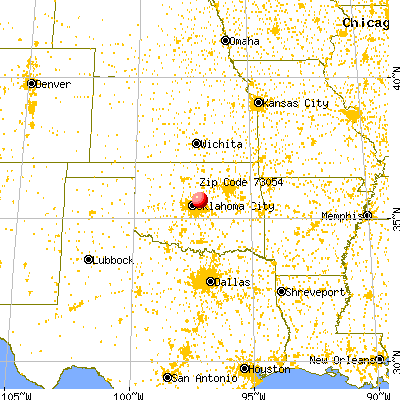


 Nearest zip codes: 74881, 73007, 73049, 73058, 73045, 73084.


 According to the data from the years 2002 - 2018 the average number of fires per year is 52. The highest number of reported fires - 81 took place in 2011, and the least - 10 in 2007. The data has a declining trend.
 When looking into fire subcategories, the most reports belonged to: Outside Fires (69.1%), and Structure Fires (18.7%).