Estimated zip code population in 2022: 5,343 Zip code population in 2010: 4,509 Zip code population in 2000: 3,598
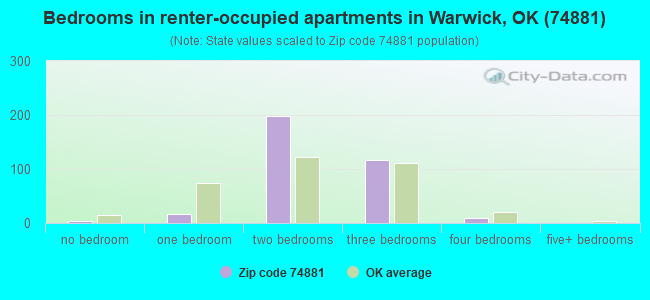
Houses and condos: 2,291 Renter-occupied apartments: 348
% of renters here:
16%
State:
35%
March 2022 cost of living index in zip code 74881: 78.7 (low, U.S. average is 100)
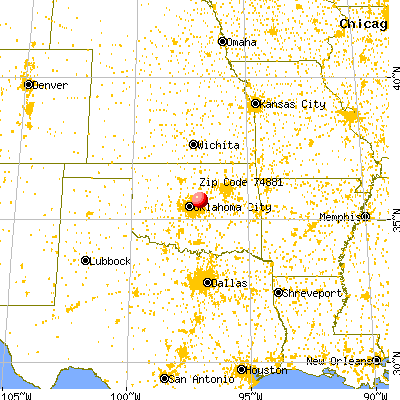
Land area: 154.4 sq. mi. Water area: 0.9 sq. mi.
Population density: 35 people per square mile
(very low).
OSM Map
General Map
Google Map
MSN Map
OSM Map
General Map
Google Map
MSN Map
OSM Map
General Map
Google Map
MSN Map
OSM Map
General Map
Google Map
MSN Map
Please wait while loading the map...
Real estate property taxes paid for housing units in 2022:
This zip code:
0.5% ($764)
Oklahoma:
0.8% ($1,501)
Median real estate property taxes paid for housing units with mortgages in 2022: $1,261 (0.6%) Median real estate property taxes paid for housing units with no mortgage in 2022: $554 (0.6%)
Averages for the 2020 tax year for zip code 74881, filed in 2021:
Average Adjusted Gross Income (AGI) in 2020: $49,121 (Individual Income Tax Returns)
Here:
$49,121
State:
$63,060
Salary/wage: $47,825 (reported on 78.6% of returns)
Here:
$47,825
State:
$52,427
(% of AGI for various income ranges: 1051.7% for AGIs below $25k, 3390.2% for AGIs $25k-50k, 6472.3% for AGIs $50k-75k, 9582.3% for AGIs $75k-100k, 16752.9% for AGIs $100k-200k)
Taxable interest for individuals: $585 (reported on 25.9% of returns)
This zip code:
$585
Oklahoma:
$1,603
(% of AGI for various income ranges: 12.9% for AGIs below $25k, 10.2% for AGIs $25k-50k, 22.3% for AGIs $50k-75k, 18.5% for AGIs $75k-100k, 79.3% for AGIs $100k-200k)
Ordinary dividends: $1,925 (reported on 8.0% of returns)
Here:
$1,925
State:
$7,001
(% of AGI for various income ranges: 10.7% for AGIs below $25k, 12.5% for AGIs $25k-50k, 35.9% for AGIs $50k-75k, 80.0% for AGIs $100k-200k)
Net capital gain/loss in AGI: +$10,159 (reported on 8.5% of returns)
Here:
+$10,159
State:
+$19,855
(% of AGI for various income ranges: 15.3% for AGIs below $25k, 10.5% for AGIs $25k-50k, 120.9% for AGIs $50k-75k, 198.5% for AGIs $75k-100k, 762.9% for AGIs $100k-200k)
Profit/loss from business: +$5,656 (reported on 19.4% of returns)
Here:
+$5,656
State:
+$9,904
(% of AGI for various income ranges: 178.8% for AGIs below $25k, 119.1% for AGIs $25k-50k, 212.7% for AGIs $50k-75k, 13.8% for AGIs $75k-100k, 113.6% for AGIs $100k-200k)
Taxable individual retirement arrangement distribution: $12,769 (reported on 6.5% of returns)
74881:
$12,769
Oklahoma:
$20,476
(% of AGI for various income ranges: 48.4% for AGIs below $25k, 57.3% for AGIs $25k-50k, 213.2% for AGIs $50k-75k, 470.0% for AGIs $100k-200k)
Total itemized deductions: $36,929 (reported on 3.5% of returns)
Here:
$36,929
State:
$39,736
(% of AGI for various income ranges: 470.5% for AGIs $50k-75k, 1107.1% for AGIs $100k-200k)
Charity contributions: $8,433 (reported on 3.0% of returns)
Here:
$8,433
State:
$17,288
(% of AGI for various income ranges: 86.4% for AGIs $50k-75k, 225.7% for AGIs $100k-200k)
Taxes paid: $6,700 (reported on 3.5% of returns)
74881:
$6,700
State:
$7,046
(% of AGI for various income ranges: 53.6% for AGIs $50k-75k, 250.7% for AGIs $100k-200k)
Earned income credit: $2,647 (reported on 21.4% of returns)
Here:
$2,647
State:
$2,435
(% of AGI for various income ranges: 125.2% for AGIs below $25k, 93.6% for AGIs $25k-50k)
Percentage of individuals using paid preparers for their 2020 taxes: 94.0%
Here:
94%
State:
94%
(% for various income ranges: 93.3% for AGIs below $25k, 94.2% for AGIs $25k-50k, 93.5% for AGIs $50k-75k, 94.4% for AGIs $75k-100k, 95.5% for AGIs $100k-200k, 100.0% for AGIs over 200k)
Averages for the 2012 tax year for zip code 74881, filed in 2013:
Average Adjusted Gross Income (AGI) in 2012: $42,421 (Individual Income Tax Returns)
Here:
$42,421
State:
$58,581
Salary/wage: $40,339 (reported on 82.3% of returns)
Here:
$40,339
State:
$45,973
(% of AGI for various income ranges: 76.1% for AGIs below $25k, 80.2% for AGIs $25k-50k, 77.6% for AGIs $50k-75k, 83.2% for AGIs $75k-100k, 74.3% for AGIs $100k-200k)
Taxable interest for individuals: $572 (reported on 26.0% of returns)
This zip code:
$572
Oklahoma:
$1,625
(% of AGI for various income ranges: 0.5% for AGIs below $25k, 0.3% for AGIs $25k-50k, 0.5% for AGIs $50k-75k, 0.3% for AGIs $75k-100k, 0.3% for AGIs $100k-200k)
Ordinary dividends: $2,267 (reported on 8.3% of returns)
Here:
$2,267
State:
$6,374
(% of AGI for various income ranges: 1.1% for AGIs below $25k, 0.7% for AGIs $25k-50k, 0.4% for AGIs $50k-75k, 0.1% for AGIs $100k-200k)
Net capital gain/loss in AGI: +$3,692 (reported on 7.2% of returns)
Here:
+$3,692
State:
+$24,023
(% of AGI for various income ranges: 0.3% for AGIs $25k-50k, 0.8% for AGIs $50k-75k, 1.7% for AGIs $100k-200k)
Profit/loss from business: +$7,643 (reported on 19.3% of returns)
Here:
+$7,643
State:
+$11,913
(% of AGI for various income ranges: 8.6% for AGIs below $25k, 3.2% for AGIs $25k-50k, 3.5% for AGIs $50k-75k, 4.0% for AGIs $75k-100k, 0.7% for AGIs $100k-200k)
Taxable individual retirement arrangement distribution: $10,018 (reported on 6.1% of returns)
74881:
$10,018
Oklahoma:
$15,242
(% of AGI for various income ranges: 1.8% for AGIs below $25k, 1.6% for AGIs $25k-50k, 1.2% for AGIs $50k-75k, 3.2% for AGIs $75k-100k)
Total itemized deductions: $19,286 (24% of AGI, reported on 19.9% of returns)
Here:
$19,286
State:
$24,882
Here:
24.4% of AGI
State:
18.8% of AGI
(% of AGI for various income ranges: 5.7% for AGIs below $25k, 7.6% for AGIs $25k-50k, 9.0% for AGIs $50k-75k, 10.9% for AGIs $75k-100k, 11.0% for AGIs $100k-200k)
Charity contributions: $4,471 (reported on 15.5% of returns)
Here:
$4,471
State:
$6,591
(% of AGI for various income ranges: 0.8% for AGIs below $25k, 1.3% for AGIs $25k-50k, 1.6% for AGIs $50k-75k, 2.2% for AGIs $75k-100k, 2.1% for AGIs $100k-200k)
Taxes paid: $4,086 (reported on 19.9% of returns)
74881:
$4,086
State:
$7,196
(% of AGI for various income ranges: 0.6% for AGIs below $25k, 1.1% for AGIs $25k-50k, 1.7% for AGIs $50k-75k, 2.4% for AGIs $75k-100k, 3.4% for AGIs $100k-200k)
Earned income credit: $2,388 (reported on 23.8% of returns)
Here:
$2,388
State:
$2,354
(% of AGI for various income ranges: 7.7% for AGIs below $25k, 1.7% for AGIs $25k-50k)
Percentage of individuals using paid preparers for their 2012 taxes: 59.1%
Here:
59%
State:
56%
(% for various income ranges: 53.4% for AGIs below $25k, 59.6% for AGIs $25k-50k, 64.3% for AGIs $50k-75k, 68.8% for AGIs $75k-100k, 66.7% for AGIs $100k-200k)
Averages for the 2004 tax year for zip code 74881, filed in 2005:
Average Adjusted Gross Income (AGI) in 2004: $33,196 (Individual Income Tax Returns)
Here:
$33,196
State:
$41,245
Salary/wage: $32,273 (reported on 82.3% of returns)
Here:
$32,273
State:
$35,318
(% of AGI for various income ranges: 156.7% for AGIs below $10k, 73.5% for AGIs $10k-25k, 83.9% for AGIs $25k-50k, 85.6% for AGIs $50k-75k, 83.1% for AGIs $75k-100k, 56.1% for AGIs over 100k)
Taxable interest for individuals: $951 (reported on 34.5% of returns)
This zip code:
$951
Oklahoma:
$1,745
(% of AGI for various income ranges: 6.1% for AGIs below $10k, 1.4% for AGIs $10k-25k, 1.0% for AGIs $25k-50k, 0.8% for AGIs $50k-75k, 1.0% for AGIs $75k-100k, 0.4% for AGIs over 100k)
Taxable dividends: $1,272 (reported on 11.4% of returns)
Here:
$1,272
State:
$2,920
(% of AGI for various income ranges: 3.5% for AGIs below $10k, 0.5% for AGIs $10k-25k, 0.6% for AGIs $25k-50k, 0.1% for AGIs $50k-75k, 0.6% for AGIs $75k-100k, 0.1% for AGIs over 100k)
Net capital gain/loss: +$4,306 (reported on 9.9% of returns)
Here:
+$4,306
State:
+$10,653
(% of AGI for various income ranges: 0.3% for AGIs below $10k, 1.2% for AGIs $10k-25k, -0.2% for AGIs $25k-50k, 0.5% for AGIs $50k-75k, 1.3% for AGIs $75k-100k, 6.5% for AGIs over 100k)
Profit/loss from business: +$5,128 (reported on 19.2% of returns)
Here:
+$5,128
State:
+$8,532
(% of AGI for various income ranges: 16.2% for AGIs below $10k, 8.6% for AGIs $10k-25k, 2.5% for AGIs $25k-50k, 2.2% for AGIs $50k-75k, 0.2% for AGIs $75k-100k)
IRA payment deduction: $3,481 (reported on 1.6% of returns)
74881:
$3,481
Oklahoma:
$3,127
Total itemized deductions: $13,813 (24% of AGI, reported on 24.1% of returns)
Here:
$13,813
State:
$17,093
Here:
23.9% of AGI
State:
20.5% of AGI
(% of AGI for various income ranges: 11.7% for AGIs below $10k, 6.4% for AGIs $10k-25k, 8.9% for AGIs $25k-50k, 10.5% for AGIs $50k-75k, 15.0% for AGIs $75k-100k, 10.7% for AGIs over 100k)
Charity contributions deductions: $3,485 (6% of AGI, reported on 19.5% of returns)
Here:
$3,485
State:
$4,240
Here:
5.7% of AGI
State:
4.8% of AGI
(% of AGI for various income ranges: 1.3% for AGIs $10k-25k, 1.4% for AGIs $25k-50k, 2.0% for AGIs $50k-75k, 3.8% for AGIs $75k-100k, 3.0% for AGIs over 100k)
Total tax: $3,659 (reported on 71.1% of returns)
74881:
$3,659
State:
$6,542
(% of AGI for various income ranges: 6.2% for AGIs below $10k, 3.9% for AGIs $10k-25k, 5.5% for AGIs $25k-50k, 8.3% for AGIs $50k-75k, 9.9% for AGIs $75k-100k, 15.2% for AGIs over 100k)
Earned income credit: $1,936 (reported on 23.0% of returns)
Here:
$1,936
State:
$1,830
Percentage of individuals using paid preparers for their 2004 taxes: 64.3%
Here:
64%
State:
63%
(% for various income ranges: 61.7% for AGIs below $10k, 68.8% for AGIs $10k-25k, 60.9% for AGIs $25k-50k, 62.6% for AGIs $50k-75k, 70.2% for AGIs $75k-100k, 64.3% for AGIs over 100k)
Likely homosexual households (counted as self-reported same-sex unmarried-partner households)
Lesbian couples: 0.1% of all households
Gay men: 0.0% of all households
Household received Food Stamps/SNAP in the past 12 months: 328 Household did not receive Food Stamps/SNAP in the past 12 months: 1,795
Women who had a birth in the past 12 months: 59 (41 now married, 18 unmarried) Women who did not have a birth in the past 12 months: 954 (529 now married, 424 unmarried)
Housing units in zip code 74881 with a mortgage: 834 (9 second mortgage, 7 both second mortgage and home equity loan) Houses without a mortgage: 7
Median monthly owner costs for units with a mortgage: $1,203 Median monthly owner costs for units without a mortgage: $387
Residents with income below the poverty level in 2022:
This zip code:
15.3%
Whole state:
15.7%
Residents with income below 50% of the poverty level in 2022:
This zip code:
6.1%
Whole state:
8.3%
Median number of rooms in houses and condos:
Here:
5.7
State:
6.1
Median number of rooms in apartments:
Here:
4.4
State:
4.5
Notable locations in this zip code not listed on our city pages
Notable locations in zip code 74881: Belton (A), Captain Creek Community Center (B), Wellston Ambulance (C), Wellston Fire Department Main Station (D), Fallis Fire Department (E), Southwest Lincoln County Fire Protection District 1 Station 2 (F), Wellston Fire Department Substation (G). Display/hide their locations on the map
Churches in zip code 74881 include: Church of the Living God (A), Saint Pauls Lutheran Church (B), Pilgrim Church (C), Sweet Home Church (D). Display/hide their locations on the map
Cemeteries: Wellston Cemetery (1), Favor Cemetery (2), Forest Cemetery (3), Gardner Cemetery (4), Great Hope Cemetery (5), Bethlehem Cemetery (6), Iowa Mission Cemetery (7). Display/hide their locations on the map
Reservoirs: Bear Fall Coon Creek Site 5r Reservoir (A), Bear Fall Coon Creek Site 6 Reservoir (B), Bear Fall Coon Creek Site 17 Reservoir (C), Bear Fall Coon Creek Site 18 Reservoir (D), Bear Fall Coon Creek Site 19r Reservoir (E), Bear Fall Coon Creek Site 3r Reservoir (F), Oknoname 08106 Reservoir (G), Oknoname 08112 Reservoir (H). Display/hide their locations on the map
Size of family households: 628 2-persons, 438 3-persons, 176 4-persons, 92 5-persons, 53 6-persons, 33 7-or-more-persons
Size of nonfamily households: 580 1-person, 125 2-persons
742 married couples with children.
195 single-parent households (67 men, 128 women).
98.1% of residents of 74881 zip code speak English at home.
1.2% of residents speak Spanish at home (43% very well, 26% well, 25% not well, 7% not at all).
0.1% of residents speak other Indo-European language at home (67% very well, 33% well).
0.6% of residents speak other language at home (89% very well, 11% well).
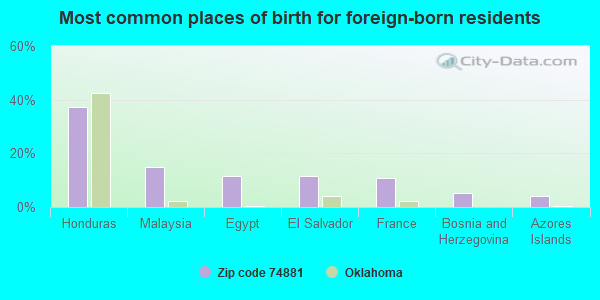
Foreign born population: 94 (1.8%) (45.4% of them are naturalized citizens)
This zip code:
1.8%
Whole state:
6.0%
37%Honduras
15%Malaysia
12%Egypt
12%El Salvador
11%France
5%Bosnia and Herzegovina
4%Azores Islands
15%German
13%American
12%Irish
11%English
3%European
2%Italian
1%Scottish
Year of entry for the foreign-born population
402010 or later
382000 to 2009
181990 to 1999
18Before 1990
Facilities with environmental interests located in this zip code:
Conditionally Exempt Small Quantity Generators, less than 100 kg/month of hazardous waste (Resource Conservation and Recovery Act (tracking hazardous waste)) - notification Organizations: GLEN BIGGS (CONTACT/OWNER)
ENOGEX GAS GATHERIN/WELLSTON STA (6 MI SW OF WELLSTON in WELLSTON, OK)
AIR SYNTHETIC MINOR (AIRS/AFS) CRITERIA AND HAZARDOUS AIR POLLUTANT INVENTORY (Inventory of air pollution sources) Business SIC classification: NATURAL GAS LIQUIDS; NATURAL GAS TRANSMISSION Business NAICS classification: NATURAL GAS LIQUID EXTRACTION. Alternative names: ENOGEX INC /WELLSTON STA
DCP MIDSTREAM LP/WEST CARNEY COMPRESS (6 MI N AND 6 MI W in FALLIS, OK)
AIR SYNTHETIC MINOR (AIRS/AFS) Business SIC classification: CRUDE PETROLEUM AND NATURAL GAS Alternative names: DUKE ENERGY FIELD S WEST CARNEY COMPRESS
Housing units lacking complete plumbing facilities: 2.5% Housing units lacking complete kitchen facilities: 1.8%
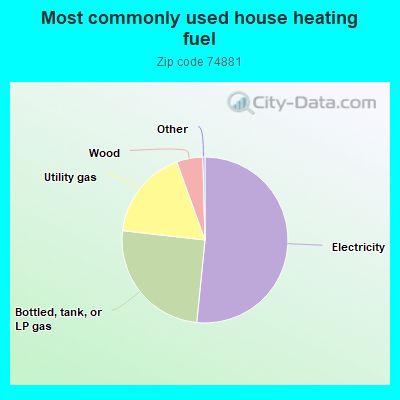
51.6%Electricity
25.2%Bottled, tank, or LP gas
17.7%Utility gas
5.1%Wood
Population in 1990: 3,452. Population change in the 1990s: +146 (+4.2%).
Place of birth for U.S.-born residents:
This state: 3,688
Northeast: 68
Midwest: 542
South: 325
West: 606
61% of the 74881 zip code residents lived in the same house 5 years ago. Out of people who lived in different houses, 35% lived in this county. Out of people who lived in different counties, 50% lived in Oklahoma.
91% of the 74881 zip code residents lived in the same house 1 year ago. Out of people who lived in different houses, 35% moved from this county. Out of people who lived in different houses, 57% moved from different county within same state. Out of people who lived in different houses, 10% moved from different state.
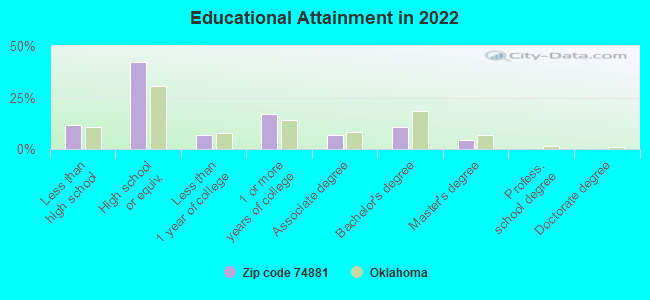
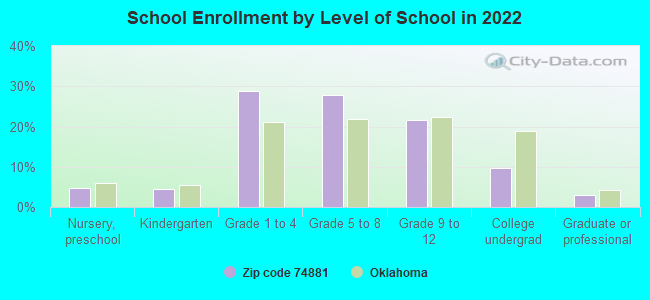
Private vs. public school enrollment:
Students in private schools in grades 1 to 8 (elementary and middle school): 113
Here:
19.0%
Oklahoma:
11.7%
Students in private schools in grades 9 to 12 (high school): 11
Here:
5.0%
Oklahoma:
11.7%
Students in private undergraduate colleges: 7
Here:
8.0%
Oklahoma:
19.3%
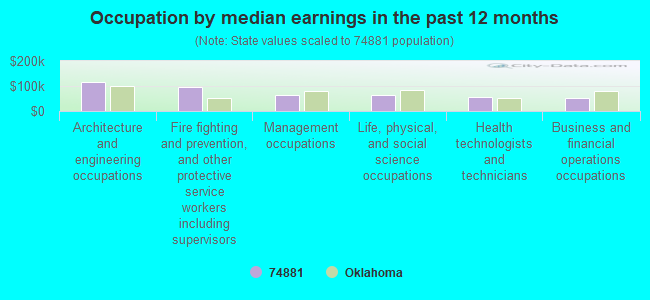
Occupation by median earnings in the past 12 months ($)
116,770Architecture and engineering occupations
94,044Fire fighting and prevention, and other protective service workers including supervisors
64,216Management occupations
62,563Life, physical, and social science occupations
57,326Health technologists and technicians
53,640Business and financial operations occupations
Top industries in this zip code by the number of employees in 2005:
Accommodation and Food Services: Limited-Service Restaurants (20-49 employees: 1 establishment)
Construction: Power and Communication Line and Related Structures Construction (10-19: 1, 5-9: 1, 1-4: 2)
Construction: Commercial and Institutional Building Construction (10-19: 1, 5-9: 1, 1-4: 1)
Construction: New Single-Family Housing Construction (except Operative Builders) (5-9: 1, 1-4: 1)
Construction: Other Building Finishing Contractors (5-9: 1)
Construction: Electrical Contractors (5-9: 1)
People in group quarters in 2000:
17 people in agriculture workers' dormitories on farms
Fatal accident statistics in 2014:
Fatal accident count: 2
Vehicles involved in fatal accidents: 3
Fatal accidents caused by drunken drivers: 0
Fatalities: 2
Persons involved in fatal accidents: 9
Pedestrians involved in fatal accidents: 0
Fatal accident statistics in 2013:
Fatal accident count: 2
Vehicles involved in fatal accidents: 3
Fatal accidents caused by drunken drivers: 1
Fatalities: 3
Persons involved in fatal accidents: 7
Pedestrians involved in fatal accidents: 0
Home Mortgage Disclosure Act Aggregated Statistics For Year 2009 (Based on 6 partial tracts)
A) FHA, FSA/RHS & VA Home Purchase Loans
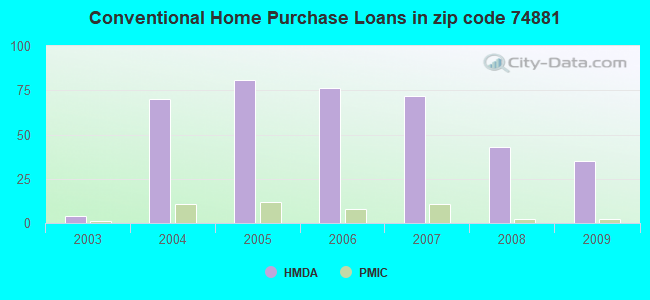
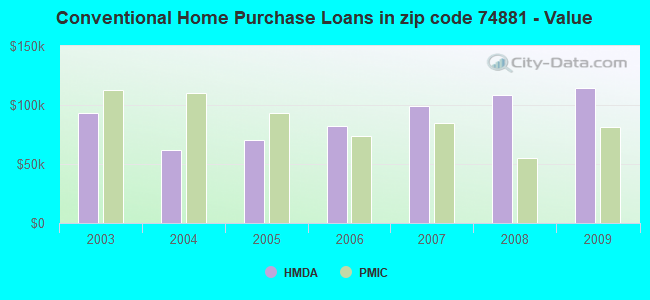
B) Conventional Home Purchase Loans
C) Refinancings
D) Home Improvement Loans
F) Non-occupant Loans on < 5 Family Dwellings (A B C & D)
G) Loans On Manufactured Home Dwelling (A B C & D)
Number
Average Value
Number
Average Value
Number
Average Value
Number
Average Value
Number
Average Value
Number
Average Value
LOANS ORIGINATED
17
$125,329
35
$114,202
109
$104,379
31
$50,657
11
$69,836
49
$66,264
APPLICATIONS APPROVED, NOT ACCEPTED
6
$124,823
6
$83,450
12
$108,622
7
$61,636
0
$0
8
$69,109
APPLICATIONS DENIED
4
$119,712
18
$63,375
42
$101,220
23
$24,813
0
$0
19
$57,413
APPLICATIONS WITHDRAWN
2
$93,780
3
$43,723
27
$130,990
1
$80,570
0
$0
5
$64,962
FILES CLOSED FOR INCOMPLETENESS
4
$129,192
0
$0
9
$95,344
0
$0
0
$0
1
$78,700
Aggregated Statistics For Year 2008 (Based on 6 partial tracts)
A) FHA, FSA/RHS & VA Home Purchase Loans
B) Conventional Home Purchase Loans
C) Refinancings
D) Home Improvement Loans
F) Non-occupant Loans on < 5 Family Dwellings (A B C & D)
G) Loans On Manufactured Home Dwelling (A B C & D)
Number
Average Value
Number
Average Value
Number
Average Value
Number
Average Value
Number
Average Value
Number
Average Value
LOANS ORIGINATED
14
$98,114
43
$108,058
82
$84,525
34
$30,651
20
$101,485
39
$42,977
APPLICATIONS APPROVED, NOT ACCEPTED
0
$0
12
$51,008
12
$105,570
5
$22,614
2
$20,145
14
$49,072
APPLICATIONS DENIED
6
$92,552
30
$61,657
51
$89,346
17
$25,176
5
$72,476
37
$58,422
APPLICATIONS WITHDRAWN
3
$92,487
8
$79,131
20
$117,368
0
$0
3
$48,840
3
$64,090
FILES CLOSED FOR INCOMPLETENESS
1
$178,610
0
$0
3
$177,360
2
$76,015
0
$0
1
$139,540
Aggregated Statistics For Year 2007 (Based on 6 partial tracts)
A) FHA, FSA/RHS & VA Home Purchase Loans
B) Conventional Home Purchase Loans
C) Refinancings
D) Home Improvement Loans
F) Non-occupant Loans on < 5 Family Dwellings (A B C & D)
G) Loans On Manufactured Home Dwelling (A B C & D)
Number
Average Value
Number
Average Value
Number
Average Value
Number
Average Value
Number
Average Value
Number
Average Value
LOANS ORIGINATED
14
$111,176
72
$98,982
74
$77,524
35
$33,120
17
$74,479
51
$64,492
APPLICATIONS APPROVED, NOT ACCEPTED
2
$74,995
8
$87,545
7
$86,104
2
$36,865
0
$0
6
$53,107
APPLICATIONS DENIED
2
$110,960
28
$46,888
82
$98,461
35
$30,811
4
$69,660
40
$58,760
APPLICATIONS WITHDRAWN
1
$202,330
12
$61,842
26
$90,522
7
$30,919
0
$0
6
$76,828
FILES CLOSED FOR INCOMPLETENESS
0
$0
0
$0
7
$110,016
3
$20,770
1
$94,890
1
$140,940
Aggregated Statistics For Year 2006 (Based on 6 partial tracts)
A) FHA, FSA/RHS & VA Home Purchase Loans
B) Conventional Home Purchase Loans
C) Refinancings
D) Home Improvement Loans
E) Loans on Dwellings For 5+ Families
F) Non-occupant Loans on < 5 Family Dwellings (A B C & D)
G) Loans On Manufactured Home Dwelling (A B C & D)
Number
Average Value
Number
Average Value
Number
Average Value
Number
Average Value
Number
Average Value
Number
Average Value
Number
Average Value
LOANS ORIGINATED
23
$97,997
76
$82,159
138
$76,462
40
$37,001
1
$221,870
16
$67,662
57
$56,504
APPLICATIONS APPROVED, NOT ACCEPTED
1
$80,930
18
$65,856
18
$128,941
5
$20,408
0
$0
1
$51,630
16
$57,676
APPLICATIONS DENIED
0
$0
39
$72,733
75
$96,367
29
$24,495
0
$0
8
$44,631
29
$81,954
APPLICATIONS WITHDRAWN
2
$115,640
11
$71,178
42
$102,387
8
$17,432
0
$0
2
$67,485
8
$76,159
FILES CLOSED FOR INCOMPLETENESS
0
$0
4
$140,092
7
$94,646
0
$0
0
$0
0
$0
0
$0
Aggregated Statistics For Year 2005 (Based on 6 partial tracts)
A) FHA, FSA/RHS & VA Home Purchase Loans
B) Conventional Home Purchase Loans
C) Refinancings
D) Home Improvement Loans
F) Non-occupant Loans on < 5 Family Dwellings (A B C & D)
G) Loans On Manufactured Home Dwelling (A B C & D)
Number
Average Value
Number
Average Value
Number
Average Value
Number
Average Value
Number
Average Value
Number
Average Value
LOANS ORIGINATED
11
$83,729
81
$70,485
103
$74,178
27
$30,306
16
$78,038
54
$54,444
APPLICATIONS APPROVED, NOT ACCEPTED
1
$87,910
36
$67,480
11
$105,753
2
$24,025
2
$85,030
27
$60,607
APPLICATIONS DENIED
4
$59,758
59
$59,931
82
$83,762
24
$22,585
7
$37,634
56
$55,364
APPLICATIONS WITHDRAWN
0
$0
14
$87,702
41
$84,858
6
$38,103
4
$70,858
7
$104,421
FILES CLOSED FOR INCOMPLETENESS
0
$0
2
$43,560
4
$139,695
2
$42,665
0
$0
0
$0
Aggregated Statistics For Year 2004 (Based on 6 partial tracts)
A) FHA, FSA/RHS & VA Home Purchase Loans
B) Conventional Home Purchase Loans
C) Refinancings
D) Home Improvement Loans
F) Non-occupant Loans on < 5 Family Dwellings (A B C & D)
G) Loans On Manufactured Home Dwelling (A B C & D)
Number
Average Value
Number
Average Value
Number
Average Value
Number
Average Value
Number
Average Value
Number
Average Value
LOANS ORIGINATED
19
$85,799
70
$62,244
117
$76,745
24
$30,073
21
$58,100
50
$46,394
APPLICATIONS APPROVED, NOT ACCEPTED
1
$84,430
7
$72,201
18
$74,546
3
$53,830
0
$0
11
$63,885
APPLICATIONS DENIED
8
$63,052
41
$51,316
112
$71,533
30
$19,039
7
$62,674
41
$43,562
APPLICATIONS WITHDRAWN
3
$70,027
8
$79,041
43
$83,472
5
$60,232
0
$0
3
$68,487
FILES CLOSED FOR INCOMPLETENESS
0
$0
2
$63,950
10
$80,337
2
$33,410
0
$0
2
$53,180
Aggregated Statistics For Year 2003 (Based on 2 partial tracts)
A) FHA, FSA/RHS & VA Home Purchase Loans
B) Conventional Home Purchase Loans
C) Refinancings
D) Home Improvement Loans
F) Non-occupant Loans on < 5 Family Dwellings (A B C & D)
2002 - 2018 National Fire Incident Reporting System (NFIRS) incidents
Based on the data from the years 2002 - 2018 the average number of fires per year is 50. The highest number of reported fires - 121 took place in 2008, and the least - 5 in 2005. The data has a dropping trend.
When looking into fire subcategories, the most incidents belonged to: Outside Fires (67.4%), and Structure Fires (20.7%).
Fire incident types reported to NFIRS in Zip Code 74881


 Nearest zip codes: 73054, 74832, 73058, 74834, 74875, 73045.


 Based on the data from the years 2002 - 2018 the average number of fires per year is 50. The highest number of reported fires - 121 took place in 2008, and the least - 5 in 2005. The data has a dropping trend.
 When looking into fire subcategories, the most incidents belonged to: Outside Fires (67.4%), and Structure Fires (20.7%).