Estimated zip code population in 2022: 4,308 Zip code population in 2010: 4,334 Zip code population in 2000: 3,540
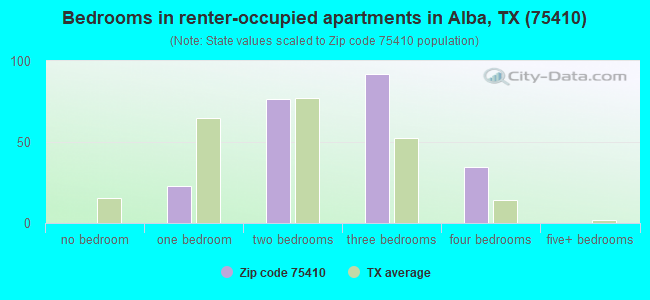
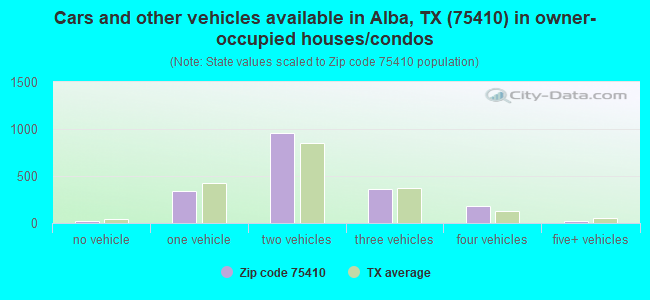
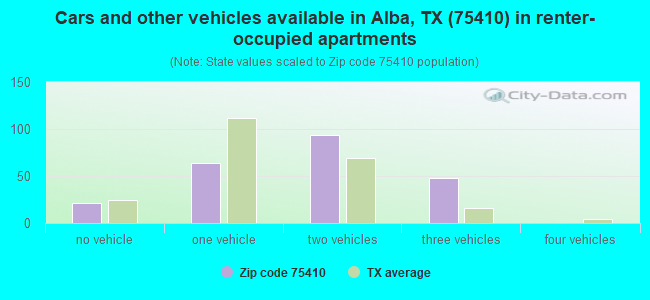
Houses and condos: 2,612 Renter-occupied apartments: 229
% of renters here:
11%
State:
38%
March 2022 cost of living index in zip code 75410: 79.0 (low, U.S. average is 100)
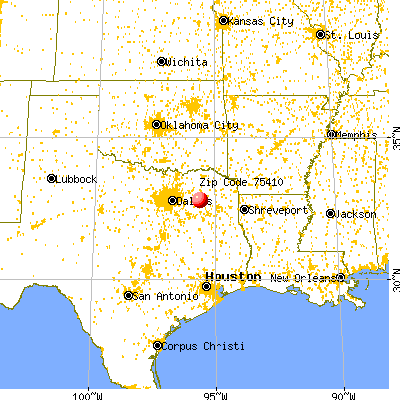
Land area: 82.3 sq. mi. Water area: 11.8 sq. mi.
Population density: 52 people per square mile
(very low).
OSM Map
General Map
Google Map
MSN Map
OSM Map
General Map
Google Map
MSN Map
OSM Map
General Map
Google Map
MSN Map
OSM Map
General Map
Google Map
MSN Map
Please wait while loading the map...
Real estate property taxes paid for housing units in 2022:
This zip code:
1.0% ($2,003)
Texas:
1.5% ($4,050)
Median real estate property taxes paid for housing units with mortgages in 2022: $2,178 (0.8%) Median real estate property taxes paid for housing units with no mortgage in 2022: $1,976 (1.0%)
Business Search- 14 Million verified businesses
Males: 2,089
(48.5%)
Females: 2,219
(51.5%)
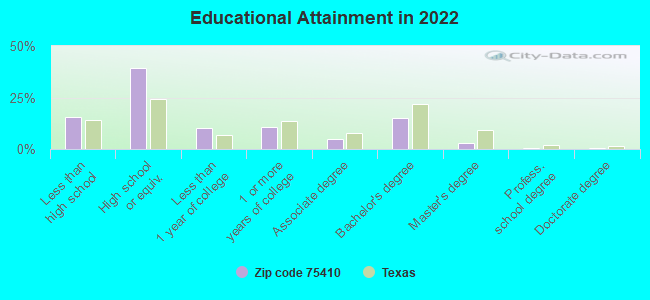
For population 25 years and over in 75410:
High school or higher: 83.8%
Bachelor's degree or higher: 18.9%
Graduate or professional degree: 4.0%
Unemployed: 1.9%
Mean travel time to work (commute): 32.5 minutes
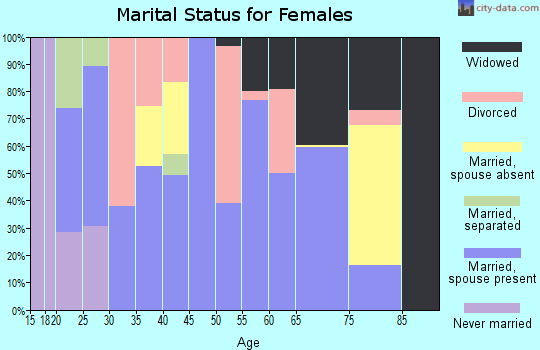
For population 15 years and over in 75410:
Never married: 9.6%
Now married: 72.5%
Separated: 0.9%
Widowed: 7.1%
Divorced: 9.9%
Zip code 75410 compared to state average:
Unemployed percentage below state average.
Black race population percentage significantly below state average.
Hispanic race population percentage significantly below state average.
Median age significantly above state average.
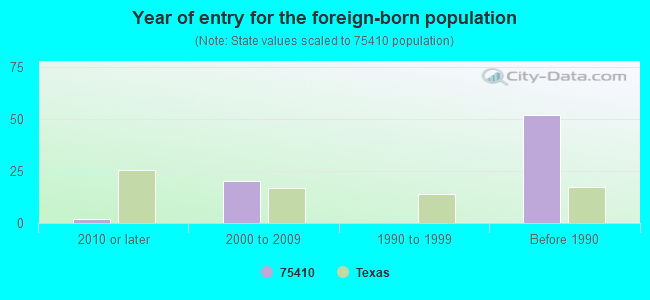
Foreign-born population percentage significantly below state average.
Renting percentage significantly below state average.
Length of stay since moving in significantly above state average.
Averages for the 2020 tax year for zip code 75410, filed in 2021:
Average Adjusted Gross Income (AGI) in 2020: $56,731 (Individual Income Tax Returns)
Here:
$56,731
State:
$77,054
Salary/wage: $49,204 (reported on 72.6% of returns)
Here:
$49,204
State:
$62,766
(% of AGI for various income ranges: 1031.4% for AGIs below $25k, 3235.8% for AGIs $25k-50k, 5616.7% for AGIs $50k-75k, 8877.3% for AGIs $75k-100k, 15088.1% for AGIs $100k-200k)
Taxable interest for individuals: $1,341 (reported on 33.2% of returns)
This zip code:
$1,341
Texas:
$2,665
(% of AGI for various income ranges: 22.4% for AGIs below $25k, 26.4% for AGIs $25k-50k, 65.0% for AGIs $50k-75k, 91.3% for AGIs $75k-100k, 145.6% for AGIs $100k-200k)
Ordinary dividends: $4,316 (reported on 13.7% of returns)
Here:
$4,316
State:
$10,044
(% of AGI for various income ranges: 16.9% for AGIs below $25k, 38.0% for AGIs $25k-50k, 96.7% for AGIs $50k-75k, 128.7% for AGIs $75k-100k, 238.1% for AGIs $100k-200k)
Net capital gain/loss in AGI: +$14,600 (reported on 14.2% of returns)
Here:
+$14,600
State:
+$39,590
(% of AGI for various income ranges: 12.0% for AGIs below $25k, 48.7% for AGIs $25k-50k, 81.7% for AGIs $50k-75k, 310.0% for AGIs $75k-100k, 440.0% for AGIs $100k-200k)
Profit/loss from business: +$8,742 (reported on 21.2% of returns)
Here:
+$8,742
State:
+$10,888
(% of AGI for various income ranges: 166.9% for AGIs below $25k, 145.8% for AGIs $25k-50k, 233.8% for AGIs $50k-75k, 486.0% for AGIs $75k-100k, 790.6% for AGIs $100k-200k)
Taxable individual retirement arrangement distribution: $23,185 (reported on 11.5% of returns)
75410:
$23,185
Texas:
$24,740
(% of AGI for various income ranges: 109.8% for AGIs below $25k, 148.4% for AGIs $25k-50k, 389.2% for AGIs $50k-75k, 542.0% for AGIs $75k-100k, 1853.1% for AGIs $100k-200k)
Total itemized deductions: $33,100 (reported on 3.1% of returns)
Here:
$33,100
State:
$40,428
(% of AGI for various income ranges: 213.3% for AGIs $50k-75k, 1128.1% for AGIs $100k-200k)
Charity contributions: $8,800 (reported on 2.7% of returns)
Here:
$8,800
State:
$18,201
(% of AGI for various income ranges: 330.0% for AGIs $100k-200k)
Taxes paid: $6,038 (reported on 3.5% of returns)
75410:
$6,038
State:
$7,821
(% of AGI for various income ranges: 54.2% for AGIs $50k-75k, 118.8% for AGIs $100k-200k)
Earned income credit: $2,380 (reported on 18.1% of returns)
Here:
$2,380
State:
$2,584
(% of AGI for various income ranges: 99.5% for AGIs below $25k, 86.4% for AGIs $25k-50k)
Percentage of individuals using paid preparers for their 2020 taxes: 93.4%
Here:
93%
State:
92%
(% for various income ranges: 92.6% for AGIs below $25k, 92.9% for AGIs $25k-50k, 93.9% for AGIs $50k-75k, 95.5% for AGIs $75k-100k, 96.3% for AGIs $100k-200k, 85.7% for AGIs over 200k)
Averages for the 2012 tax year for zip code 75410, filed in 2013:
Average Adjusted Gross Income (AGI) in 2012: $47,063 (Individual Income Tax Returns)
Here:
$47,063
State:
$65,384
Salary/wage: $42,739 (reported on 74.3% of returns)
Here:
$42,739
State:
$52,524
(% of AGI for various income ranges: 64.2% for AGIs below $25k, 71.1% for AGIs $25k-50k, 75.2% for AGIs $50k-75k, 65.9% for AGIs $75k-100k, 65.3% for AGIs $100k-200k, 58.3% for AGIs over 200k)
Taxable interest for individuals: $1,434 (reported on 34.5% of returns)
This zip code:
$1,434
Texas:
$2,372
(% of AGI for various income ranges: 1.9% for AGIs below $25k, 0.5% for AGIs $25k-50k, 0.6% for AGIs $50k-75k, 0.9% for AGIs $75k-100k, 1.5% for AGIs $100k-200k, 1.2% for AGIs over 200k)
Ordinary dividends: $2,508 (reported on 15.2% of returns)
Here:
$2,508
State:
$9,721
(% of AGI for various income ranges: 1.0% for AGIs below $25k, 0.9% for AGIs $25k-50k, 0.4% for AGIs $50k-75k, 1.1% for AGIs $75k-100k, 1.3% for AGIs $100k-200k)
Net capital gain/loss in AGI: +$6,500 (reported on 12.3% of returns)
Here:
+$6,500
State:
+$35,319
(% of AGI for various income ranges: 0.4% for AGIs below $25k, 0.3% for AGIs $50k-75k, 7.8% for AGIs $100k-200k)
Profit/loss from business: +$12,765 (reported on 21.6% of returns)
Here:
+$12,765
State:
+$13,732
(% of AGI for various income ranges: 15.4% for AGIs below $25k, 8.8% for AGIs $25k-50k, 2.7% for AGIs $50k-75k, 4.0% for AGIs $75k-100k, 6.7% for AGIs $100k-200k)
Taxable individual retirement arrangement distribution: $14,114 (reported on 12.3% of returns)
75410:
$14,114
Texas:
$19,511
(% of AGI for various income ranges: 5.3% for AGIs below $25k, 4.4% for AGIs $25k-50k, 2.7% for AGIs $50k-75k, 4.7% for AGIs $75k-100k, 4.5% for AGIs $100k-200k)
Total itemized deductions: $20,489 (24% of AGI, reported on 21.1% of returns)
Here:
$20,489
State:
$24,724
Here:
23.9% of AGI
State:
15.9% of AGI
(% of AGI for various income ranges: 7.9% for AGIs below $25k, 8.8% for AGIs $25k-50k, 10.7% for AGIs $50k-75k, 9.9% for AGIs $75k-100k, 9.6% for AGIs $100k-200k, 6.6% for AGIs over 200k)
Charity contributions: $5,375 (reported on 14.0% of returns)
Here:
$5,375
State:
$6,808
(% of AGI for various income ranges: 0.8% for AGIs below $25k, 1.5% for AGIs $25k-50k, 1.3% for AGIs $50k-75k, 1.3% for AGIs $75k-100k, 2.0% for AGIs $100k-200k, 2.8% for AGIs over 200k)
Taxes paid: $3,880 (reported on 20.5% of returns)
75410:
$3,880
State:
$6,921
(% of AGI for various income ranges: 1.0% for AGIs below $25k, 1.3% for AGIs $25k-50k, 1.4% for AGIs $50k-75k, 1.7% for AGIs $75k-100k, 2.2% for AGIs $100k-200k, 2.5% for AGIs over 200k)
Earned income credit: $2,268 (reported on 23.4% of returns)
Here:
$2,268
State:
$2,570
(% of AGI for various income ranges: 7.8% for AGIs below $25k, 1.6% for AGIs $25k-50k)
Percentage of individuals using paid preparers for their 2012 taxes: 59.1%
Here:
59%
State:
51%
(% for various income ranges: 56.3% for AGIs below $25k, 55.0% for AGIs $25k-50k, 59.3% for AGIs $50k-75k, 64.7% for AGIs $75k-100k, 69.2% for AGIs $100k-200k, 100.0% for AGIs over 200k)
Averages for the 2004 tax year for zip code 75410, filed in 2005:
Average Adjusted Gross Income (AGI) in 2004: $36,883 (Individual Income Tax Returns)
Here:
$36,883
State:
$47,881
Salary/wage: $33,103 (reported on 74.1% of returns)
Here:
$33,103
State:
$41,947
(% of AGI for various income ranges: 80.3% for AGIs below $10k, 68.8% for AGIs $10k-25k, 70.7% for AGIs $25k-50k, 72.1% for AGIs $50k-75k, 64.7% for AGIs $75k-100k, 55.2% for AGIs over 100k)
Taxable interest for individuals: $1,735 (reported on 43.6% of returns)
This zip code:
$1,735
Texas:
$2,255
(% of AGI for various income ranges: 6.1% for AGIs below $10k, 2.5% for AGIs $10k-25k, 1.8% for AGIs $25k-50k, 1.5% for AGIs $50k-75k, 2.0% for AGIs $75k-100k, 2.2% for AGIs over 100k)
Taxable dividends: $1,637 (reported on 17.3% of returns)
Here:
$1,637
State:
$4,261
(% of AGI for various income ranges: 2.2% for AGIs below $10k, 0.7% for AGIs $10k-25k, 0.5% for AGIs $25k-50k, 0.5% for AGIs $50k-75k, 0.7% for AGIs $75k-100k, 1.3% for AGIs over 100k)
Net capital gain/loss: +$6,193 (reported on 17.0% of returns)
Here:
+$6,193
State:
+$16,110
(% of AGI for various income ranges: -2.1% for AGIs below $10k, 0.1% for AGIs $10k-25k, 1.5% for AGIs $25k-50k, 1.3% for AGIs $50k-75k, 3.2% for AGIs $75k-100k, 7.5% for AGIs over 100k)
Profit/loss from business: +$7,363 (reported on 22.0% of returns)
Here:
+$7,363
State:
+$11,013
(% of AGI for various income ranges: -21.6% for AGIs below $10k, 11.3% for AGIs $10k-25k, 6.8% for AGIs $25k-50k, 0.9% for AGIs $50k-75k, 3.7% for AGIs $75k-100k, 4.3% for AGIs over 100k)
IRA payment deduction: $2,783 (reported on 1.6% of returns)
75410:
$2,783
Texas:
$3,120
Total itemized deductions: $17,480 (24% of AGI, reported on 21.4% of returns)
Here:
$17,480
State:
$19,631
Here:
24.2% of AGI
State:
18.9% of AGI
(% of AGI for various income ranges: 19.0% for AGIs below $10k, 7.9% for AGIs $10k-25k, 7.1% for AGIs $25k-50k, 11.4% for AGIs $50k-75k, 12.4% for AGIs $75k-100k, 11.2% for AGIs over 100k)
Charity contributions deductions: $4,473 (6% of AGI, reported on 16.7% of returns)
Here:
$4,473
State:
$4,753
Here:
6.0% of AGI
State:
4.2% of AGI
(% of AGI for various income ranges: 1.0% for AGIs below $10k, 1.1% for AGIs $10k-25k, 1.2% for AGIs $25k-50k, 2.1% for AGIs $50k-75k, 2.4% for AGIs $75k-100k, 3.2% for AGIs over 100k)
Total tax: $5,080 (reported on 71.7% of returns)
75410:
$5,080
State:
$9,058
(% of AGI for various income ranges: 4.2% for AGIs below $10k, 4.4% for AGIs $10k-25k, 6.2% for AGIs $25k-50k, 8.9% for AGIs $50k-75k, 11.1% for AGIs $75k-100k, 17.5% for AGIs over 100k)
Earned income credit: $1,828 (reported on 20.7% of returns)
Here:
$1,828
State:
$2,024
Percentage of individuals using paid preparers for their 2004 taxes: 65.4%
Here:
65%
State:
57%
(% for various income ranges: 55.9% for AGIs below $10k, 71.6% for AGIs $10k-25k, 64.3% for AGIs $25k-50k, 63.2% for AGIs $50k-75k, 74.4% for AGIs $75k-100k, 71.1% for AGIs over 100k)
Household received Food Stamps/SNAP in the past 12 months: 264 Household did not receive Food Stamps/SNAP in the past 12 months: 1,853
Women who had a birth in the past 12 months: 34 (7 now married, 25 unmarried) Women who did not have a birth in the past 12 months: 481 (285 now married, 192 unmarried)
Housing units in zip code 75410 with a mortgage: 562 Median monthly owner costs for units with a mortgage: $1,514 Median monthly owner costs for units without a mortgage: $551
Residents with income below the poverty level in 2022:
This zip code:
10.5%
Whole state:
14.0%
Residents with income below 50% of the poverty level in 2022:
This zip code:
3.0%
Whole state:
7.4%
Median number of rooms in houses and condos:
Here:
5.9
State:
6.3
Median number of rooms in apartments:
Here:
4.1
State:
4.0
Notable locations in this zip code not listed on our city pages
Notable locations in zip code 75410: Collins Ferry (A), Kendall Branch Library (B), Northwest Branch Library (C), Robinson - Westchase Branch Library (D), Tomball Branch Library (E), Alba Volunteer Fire Department (F). Display/hide their locations on the map
Churches in zip code 75410 include: Pleasant Ridge Church (A), Salem Church (B), Colony Church (C), Cottonwood Church (D), Enon Church (E), Pilgrims Rest Number 2 Church (F). Display/hide their locations on the map
Streams, rivers, and creeks: Wilson Branch (A), Williams Creek (B), White Oak Branch (C), Simpkins Creek (D), Number Five Branch (E), Mustang Creek (F), Franks Creek (G), Hill Branch (H), Cottonwood Creek (I). Display/hide their locations on the map
Size of family households: 1,155 2-persons, 192 3-persons, 144 4-persons, 22 5-persons, 5 6-persons, 1 7-or-more-persons
Size of nonfamily households: 407 1-person, 163 2-persons, 41 3-persons
345 married couples with children.
40 single-parent households (16 men, 24 women).
98.0% of residents of 75410 zip code speak English at home.
2.5% of residents speak Spanish at home (63% very well, 18% well, 18% not well).
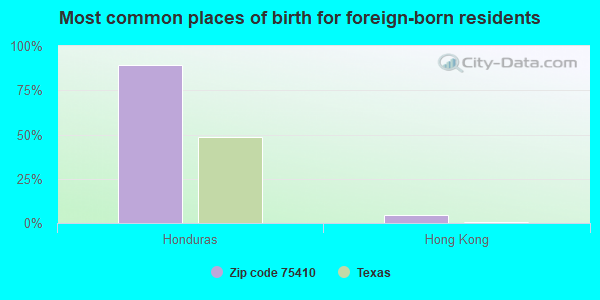
Foreign born population: 47 (1.1%) (53.8% of them are naturalized citizens)
This zip code:
1.1%
Whole state:
17.2%
89%Honduras
4%Hong Kong
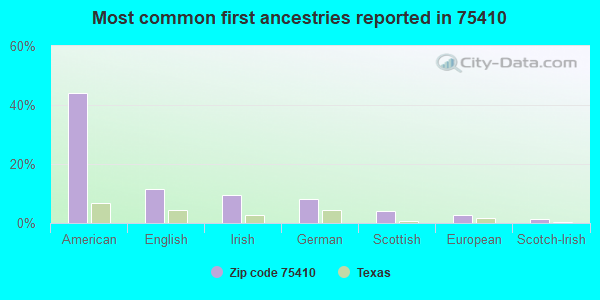
44%American
12%English
9%Irish
8%German
4%Scottish
3%European
1%Scotch-Irish
Year of entry for the foreign-born population
22010 or later
202000 to 2009
01990 to 1999
52Before 1990
Facilities with environmental interests located in this zip code:
ALBA-GOLDEN EL (1373 CR 2377 in ALBA, TX)
(National Center for Education Statistics) - STATE ID-250906101 Organizations: ALBA-GOLDEN ISD (SCHOOL DISTRICT)
ALBA-GOLDEN H S (1373 CR 2377 in ALBA, TX)
(National Center for Education Statistics) - STATE ID-250906001 Organizations: ALBA-GOLDEN ISD (SCHOOL DISTRICT)
ALBA-GOLDEN ISD (HWY 69 N / RT 2 BOX 22 in ALBA, TX)
COMPLIANCE ACTIVITY (Tracking inspections of insecticide, fungicide, and rodenticide, and toxic substances)
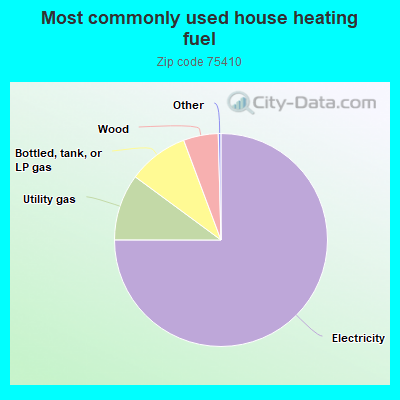
Housing units lacking complete kitchen facilities: 5.9%
75.1%Electricity
10.1%Utility gas
9.2%Bottled, tank, or LP gas
5.3%Wood
Population in 1990: 2,599. Population change in the 1990s: +941 (+36.2%).
Place of birth for U.S.-born residents:
This state: 2,354
Northeast: 69
Midwest: 690
South: 716
West: 407
52% of the 75410 zip code residents lived in the same house 5 years ago. Out of people who lived in different houses, 39% lived in this county. Out of people who lived in different counties, 50% lived in Texas.
91% of the 75410 zip code residents lived in the same house 1 year ago. Out of people who lived in different houses, 39% moved from this county. Out of people who lived in different houses, 43% moved from different county within same state. Out of people who lived in different houses, 21% moved from different state.
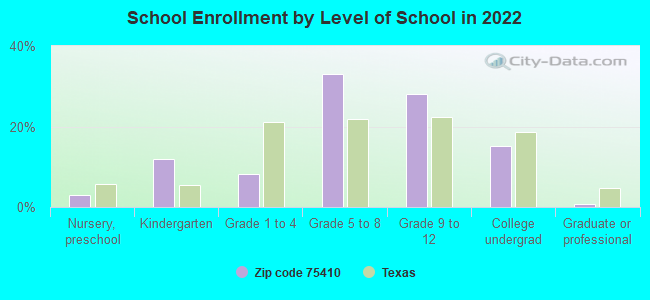
Private vs. public school enrollment:
Students in private schools in grades 1 to 8 (elementary and middle school): 40
Here:
22.5%
Texas:
8.8%
Students in private schools in grades 9 to 12 (high school): 1
Here:
0.9%
Texas:
8.0%
Students in private undergraduate colleges:
Here:
0.0%
Texas:
16.2%
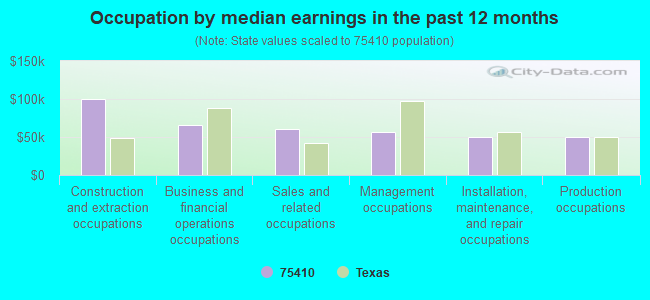
Occupation by median earnings in the past 12 months ($)
100,613Construction and extraction occupations
65,656Business and financial operations occupations
59,954Sales and related occupations
56,334Management occupations
50,180Installation, maintenance, and repair occupations
50,072Production occupations
Top industries in this zip code by the number of employees in 2005:
Accommodation and Food Services: Recreational and Vacation Camps (except Campgrounds) (20-49: 1)
Other Services (except Public Administration): Religious Organizations (10-19: 1, 5-9: 1, 1-4: 3)
Accommodation and Food Services: Hotels (except Casino Hotels) and Motels (10-19: 1, 1-4: 1)
Utilities: Water Supply and Irrigation Systems (5-9: 2)
Fatal accident statistics in 2013:
Fatal accident count: 2
Vehicles involved in fatal accidents: 4
Fatal accidents caused by drunken drivers: 0
Fatalities: 2
Persons involved in fatal accidents: 6
Pedestrians involved in fatal accidents: 0
Fatal accident statistics in 2012:
Fatal accident count: 1
Vehicles involved in fatal accidents: 2
Fatal accidents caused by drunken drivers: 0
Fatalities: 1
Persons involved in fatal accidents: 2
Pedestrians involved in fatal accidents: 0
2002 - 2018 National Fire Incident Reporting System (NFIRS) incidents
Based on the data from the years 2002 - 2018 the average number of fires per year is 8. The highest number of reported fire incidents - 15 took place in 2008, and the least - 2 in 2003. The data has an increasing trend.
When looking into fire subcategories, the most incidents belonged to: Outside Fires (52.5%), and Structure Fires (41.7%).
Fire incident types reported to NFIRS in Zip Code 75410


 Nearest zip codes: 75440, 75497, 75140, 75127, 75783, 75773.


 Based on the data from the years 2002 - 2018 the average number of fires per year is 8. The highest number of reported fire incidents - 15 took place in 2008, and the least - 2 in 2003. The data has an increasing trend.
 When looking into fire subcategories, the most incidents belonged to: Outside Fires (52.5%), and Structure Fires (41.7%).