Estimated zip code population in 2022: 4,000 Zip code population in 2010: 3,350 Zip code population in 2000: 2,093
Houses and condos: 2,039 Renter-occupied apartments: 266
% of renters here:
15%
State:
38%
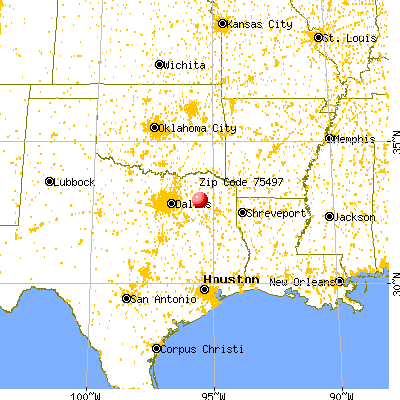
March 2022 cost of living index in zip code 75497: 80.0 (low, U.S. average is 100)
Land area: 64.7 sq. mi. Water area: 18.4 sq. mi.
Population density: 62 people per square mile
(very low).
OSM Map
General Map
Google Map
MSN Map
OSM Map
General Map
Google Map
MSN Map
OSM Map
General Map
Google Map
MSN Map
OSM Map
General Map
Google Map
MSN Map
Please wait while loading the map...
Real estate property taxes paid for housing units in 2022:
This zip code:
1.2% ($2,523)
Texas:
1.5% ($4,050)
Median real estate property taxes paid for housing units with mortgages in 2022: $2,042 (0.8%) Median real estate property taxes paid for housing units with no mortgage in 2022: $2,739 (1.3%)
Averages for the 2020 tax year for zip code 75497, filed in 2021:
Average Adjusted Gross Income (AGI) in 2020: $68,162 (Individual Income Tax Returns)
Here:
$68,162
State:
$77,054
Salary/wage: $50,353 (reported on 64.8% of returns)
Here:
$50,353
State:
$62,766
(% of AGI for various income ranges: 973.5% for AGIs below $25k, 3129.7% for AGIs $25k-50k, 5580.6% for AGIs $50k-75k, 7351.8% for AGIs $75k-100k, 11745.7% for AGIs $100k-200k, 58775.0% for AGIs over 200k)
Taxable interest for individuals: $2,406 (reported on 37.9% of returns)
This zip code:
$2,406
Texas:
$2,665
(% of AGI for various income ranges: 35.8% for AGIs below $25k, 59.1% for AGIs $25k-50k, 89.4% for AGIs $50k-75k, 76.4% for AGIs $75k-100k, 177.1% for AGIs $100k-200k, 4210.0% for AGIs over 200k)
Ordinary dividends: $8,289 (reported on 20.3% of returns)
Here:
$8,289
State:
$10,044
(% of AGI for various income ranges: 41.6% for AGIs below $25k, 72.2% for AGIs $25k-50k, 169.4% for AGIs $50k-75k, 269.1% for AGIs $75k-100k, 714.3% for AGIs $100k-200k, 5450.0% for AGIs over 200k)
Net capital gain/loss in AGI: +$21,951 (reported on 20.3% of returns)
Here:
+$21,951
State:
+$39,590
(% of AGI for various income ranges: 16.5% for AGIs below $25k, 71.9% for AGIs $25k-50k, 160.6% for AGIs $50k-75k, 330.9% for AGIs $75k-100k, 1192.9% for AGIs $100k-200k, 27650.0% for AGIs over 200k)
Profit/loss from business: +$12,292 (reported on 20.9% of returns)
Here:
+$12,292
State:
+$10,888
(% of AGI for various income ranges: 262.1% for AGIs below $25k, 175.9% for AGIs $25k-50k, 289.4% for AGIs $50k-75k, 196.4% for AGIs $75k-100k, 1644.3% for AGIs $100k-200k)
Taxable individual retirement arrangement distribution: $32,275 (reported on 17.6% of returns)
75497:
$32,275
Texas:
$24,740
(% of AGI for various income ranges: 74.0% for AGIs below $25k, 232.5% for AGIs $25k-50k, 609.4% for AGIs $50k-75k, 1082.7% for AGIs $75k-100k, 2857.9% for AGIs $100k-200k, 15495.0% for AGIs over 200k)
Total itemized deductions: $40,155 (reported on 6.0% of returns)
Here:
$40,155
State:
$40,428
(% of AGI for various income ranges: 780.0% for AGIs $50k-75k, 764.3% for AGIs $100k-200k, 10495.0% for AGIs over 200k)
Charity contributions: $13,512 (reported on 4.4% of returns)
Here:
$13,512
State:
$18,201
(% of AGI for various income ranges: 30.3% for AGIs $25k-50k, 185.7% for AGIs $100k-200k, 3620.0% for AGIs over 200k)
Taxes paid: $6,155 (reported on 6.0% of returns)
75497:
$6,155
State:
$7,821
(% of AGI for various income ranges: 95.6% for AGIs $50k-75k, 142.1% for AGIs $100k-200k, 1625.0% for AGIs over 200k)
Earned income credit: $2,331 (reported on 17.6% of returns)
Here:
$2,331
State:
$2,584
(% of AGI for various income ranges: 106.3% for AGIs below $25k, 90.3% for AGIs $25k-50k)
Percentage of individuals using paid preparers for their 2020 taxes: 91.2%
Here:
91%
State:
92%
(% for various income ranges: 90.5% for AGIs below $25k, 92.9% for AGIs $25k-50k, 87.5% for AGIs $50k-75k, 94.1% for AGIs $75k-100k, 92.3% for AGIs $100k-200k, 90.0% for AGIs over 200k)
Averages for the 2012 tax year for zip code 75497, filed in 2013:
Average Adjusted Gross Income (AGI) in 2012: $58,790 (Individual Income Tax Returns)
Here:
$58,790
State:
$65,384
Salary/wage: $42,183 (reported on 69.1% of returns)
Here:
$42,183
State:
$52,524
(% of AGI for various income ranges: 61.9% for AGIs below $25k, 66.7% for AGIs $25k-50k, 61.2% for AGIs $50k-75k, 48.6% for AGIs $75k-100k, 53.7% for AGIs $100k-200k, 26.5% for AGIs over 200k)
Taxable interest for individuals: $2,315 (reported on 40.9% of returns)
This zip code:
$2,315
Texas:
$2,372
(% of AGI for various income ranges: 2.4% for AGIs below $25k, 1.2% for AGIs $25k-50k, 1.2% for AGIs $50k-75k, 0.9% for AGIs $75k-100k, 2.0% for AGIs $100k-200k, 1.8% for AGIs over 200k)
Ordinary dividends: $5,263 (reported on 20.1% of returns)
Here:
$5,263
State:
$9,721
(% of AGI for various income ranges: 1.9% for AGIs below $25k, 1.5% for AGIs $25k-50k, 0.6% for AGIs $50k-75k, 2.4% for AGIs $75k-100k, 2.2% for AGIs $100k-200k, 2.0% for AGIs over 200k)
Net capital gain/loss in AGI: +$28,684 (reported on 16.8% of returns)
Here:
+$28,684
State:
+$35,319
(% of AGI for various income ranges: 0.4% for AGIs below $25k, 0.3% for AGIs $25k-50k, 0.7% for AGIs $50k-75k, 1.0% for AGIs $75k-100k, 3.1% for AGIs $100k-200k, 27.5% for AGIs over 200k)
Profit/loss from business: +$10,877 (reported on 20.8% of returns)
Here:
+$10,877
State:
+$13,732
(% of AGI for various income ranges: 13.1% for AGIs below $25k, 4.6% for AGIs $25k-50k, 1.5% for AGIs $50k-75k, 1.9% for AGIs $75k-100k, 6.5% for AGIs $100k-200k)
Taxable individual retirement arrangement distribution: $20,948 (reported on 16.8% of returns)
75497:
$20,948
Texas:
$19,511
(% of AGI for various income ranges: 6.5% for AGIs below $25k, 4.6% for AGIs $25k-50k, 6.9% for AGIs $50k-75k, 9.4% for AGIs $75k-100k, 10.5% for AGIs $100k-200k)
Total itemized deductions: $26,682 (22% of AGI, reported on 25.5% of returns)
Here:
$26,682
State:
$24,724
Here:
21.6% of AGI
State:
15.9% of AGI
(% of AGI for various income ranges: 15.4% for AGIs below $25k, 9.3% for AGIs $25k-50k, 10.9% for AGIs $50k-75k, 11.6% for AGIs $75k-100k, 10.8% for AGIs $100k-200k, 12.6% for AGIs over 200k)
Charity contributions: $5,252 (reported on 18.1% of returns)
Here:
$5,252
State:
$6,808
(% of AGI for various income ranges: 1.2% for AGIs below $25k, 1.1% for AGIs $25k-50k, 1.1% for AGIs $50k-75k, 1.6% for AGIs $75k-100k, 1.6% for AGIs $100k-200k, 2.4% for AGIs over 200k)
Taxes paid: $5,618 (reported on 25.5% of returns)
75497:
$5,618
State:
$6,921
(% of AGI for various income ranges: 2.4% for AGIs below $25k, 1.8% for AGIs $25k-50k, 2.0% for AGIs $50k-75k, 2.4% for AGIs $75k-100k, 3.1% for AGIs $100k-200k, 2.4% for AGIs over 200k)
Earned income credit: $2,214 (reported on 18.8% of returns)
Here:
$2,214
State:
$2,570
(% of AGI for various income ranges: 6.3% for AGIs below $25k, 1.2% for AGIs $25k-50k)
Percentage of individuals using paid preparers for their 2012 taxes: 61.1%
Here:
61%
State:
51%
(% for various income ranges: 59.0% for AGIs below $25k, 61.8% for AGIs $25k-50k, 57.9% for AGIs $50k-75k, 69.2% for AGIs $75k-100k, 64.7% for AGIs $100k-200k, 60.0% for AGIs over 200k)
Averages for the 2004 tax year for zip code 75497, filed in 2005:
Average Adjusted Gross Income (AGI) in 2004: $49,755 (Individual Income Tax Returns)
Here:
$49,755
State:
$47,881
Salary/wage: $36,916 (reported on 70.0% of returns)
Here:
$36,916
State:
$41,947
(% of AGI for various income ranges: 131.0% for AGIs below $10k, 66.2% for AGIs $10k-25k, 65.0% for AGIs $25k-50k, 60.8% for AGIs $50k-75k, 62.4% for AGIs $75k-100k, 35.8% for AGIs over 100k)
Taxable interest for individuals: $3,017 (reported on 51.6% of returns)
This zip code:
$3,017
Texas:
$2,255
(% of AGI for various income ranges: 23.2% for AGIs below $10k, 4.2% for AGIs $10k-25k, 2.9% for AGIs $25k-50k, 1.9% for AGIs $50k-75k, 3.5% for AGIs $75k-100k, 3.0% for AGIs over 100k)
Taxable dividends: $2,730 (reported on 23.6% of returns)
Here:
$2,730
State:
$4,261
(% of AGI for various income ranges: 5.6% for AGIs below $10k, 1.9% for AGIs $10k-25k, 1.1% for AGIs $25k-50k, 0.6% for AGIs $50k-75k, 1.9% for AGIs $75k-100k, 1.3% for AGIs over 100k)
Net capital gain/loss: +$7,284 (reported on 22.8% of returns)
Here:
+$7,284
State:
+$16,110
(% of AGI for various income ranges: 4.5% for AGIs below $10k, 0.5% for AGIs $10k-25k, 2.5% for AGIs $25k-50k, 2.0% for AGIs $50k-75k, 1.9% for AGIs $75k-100k, 5.1% for AGIs over 100k)
Profit/loss from business: +$2,286 (reported on 20.8% of returns)
Here:
+$2,286
State:
+$11,013
(% of AGI for various income ranges: -51.2% for AGIs below $10k, 7.7% for AGIs $10k-25k, 3.6% for AGIs $25k-50k, -0.7% for AGIs $50k-75k, -0.2% for AGIs $75k-100k, 0.6% for AGIs over 100k)
IRA payment deduction: $3,778 (reported on 2.3% of returns)
75497:
$3,778
Texas:
$3,120
Total itemized deductions: $19,949 (19% of AGI, reported on 22.2% of returns)
Here:
$19,949
State:
$19,631
Here:
19.1% of AGI
State:
18.9% of AGI
(% of AGI for various income ranges: 29.3% for AGIs below $10k, 12.5% for AGIs $10k-25k, 9.2% for AGIs $25k-50k, 9.9% for AGIs $50k-75k, 12.2% for AGIs $75k-100k, 6.3% for AGIs over 100k)
Charity contributions deductions: $3,509 (3% of AGI, reported on 18.3% of returns)
Here:
$3,509
State:
$4,753
Here:
3.0% of AGI
State:
4.2% of AGI
(% of AGI for various income ranges: 2.2% for AGIs below $10k, 0.8% for AGIs $10k-25k, 0.9% for AGIs $25k-50k, 1.5% for AGIs $50k-75k, 2.5% for AGIs $75k-100k, 1.2% for AGIs over 100k)
Total tax: $8,851 (reported on 72.9% of returns)
75497:
$8,851
State:
$9,058
(% of AGI for various income ranges: 7.2% for AGIs below $10k, 3.7% for AGIs $10k-25k, 6.6% for AGIs $25k-50k, 8.9% for AGIs $50k-75k, 10.2% for AGIs $75k-100k, 20.0% for AGIs over 100k)
Earned income credit: $1,619 (reported on 17.0% of returns)
Here:
$1,619
State:
$2,024
Percentage of individuals using paid preparers for their 2004 taxes: 62.8%
Here:
63%
State:
57%
(% for various income ranges: 59.5% for AGIs below $10k, 65.6% for AGIs $10k-25k, 61.4% for AGIs $25k-50k, 61.8% for AGIs $50k-75k, 62.9% for AGIs $75k-100k, 69.7% for AGIs over 100k)
Household received Food Stamps/SNAP in the past 12 months: 99 Household did not receive Food Stamps/SNAP in the past 12 months: 1,637
Women who had a birth in the past 12 months: 7 (7 now married, 0 unmarried) Women who did not have a birth in the past 12 months: 414 (214 now married, 199 unmarried)
Housing units in zip code 75497 with a mortgage: 504 (14 second mortgage) Median monthly owner costs for units with a mortgage: $1,620 Median monthly owner costs for units without a mortgage: $669
Residents with income below the poverty level in 2022:
This zip code:
11.8%
Whole state:
14.0%
Residents with income below 50% of the poverty level in 2022:
This zip code:
5.2%
Whole state:
7.4%
Median number of rooms in houses and condos:
Here:
5.7
State:
6.3
Median number of rooms in apartments:
Here:
5.0
State:
4.0
Notable locations in this zip code not listed on our city pages
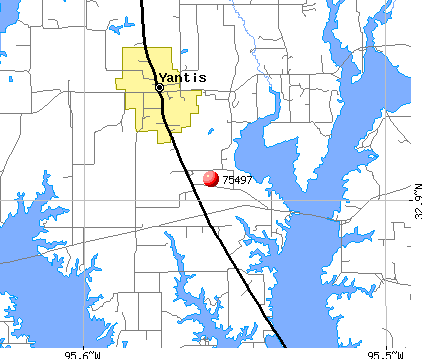
Notable locations in zip code 75497: The Links at Land's End (A), Sulphur Springs Public Library (B), Yantis Volunteer Fire Department (C), Lands End Volunteer Fire Department (D). Display/hide their locations on the map
Churches in zip code 75497 include: Pleasant Divide Church (A), White Oak Church (B), County Line Church (C), Midway Church (D), Oak Valley Church (E). Display/hide their locations on the map
Streams, rivers, and creeks: Wolf Branch (A), Running Creek (B), Ray Branch (C), Penson Spring Branch (D), Carroll Creek (E), Glade Creek (F), Kintchloe Branch (G), Linn Branch (H), Little Caney Creek (I). Display/hide their locations on the map
Size of family households: 854 2-persons, 203 3-persons, 58 4-persons, 12 5-persons, 34 6-persons, 14 7-or-more-persons
Size of nonfamily households: 384 1-person, 193 2-persons, 6 4-persons
235 married couples with children.
70 single-parent households (53 men, 17 women).
96.8% of residents of 75497 zip code speak English at home.
0.8% of residents speak Spanish at home (97% very well, 3% not well).
2.6% of residents speak other Indo-European language at home (72% very well, 28% not well).
0.8% of residents speak Asian or Pacific Island language at home (100% very well).
Foreign born population: 208 (5.2%) (73.9% of them are naturalized citizens)
This zip code:
5.2%
Whole state:
17.2%
27%France
24%India
8%Bhutan
7%China, excluding Hong Kong and Taiwan
5%Sweden
4%England
0%Honduras
23%English
19%German
11%American
9%Irish
5%Dutch
4%Scottish
4%Welsh
Year of entry for the foreign-born population
1502010 or later
02000 to 2009
51990 to 1999
78Before 1990
Housing units lacking complete plumbing facilities: 4.0% Housing units lacking complete kitchen facilities: 4.2%
80.2%Electricity
12.8%Bottled, tank, or LP gas
4.8%Utility gas
1.2%Wood
1.1%Fuel oil, kerosene, etc.
Population in 1990: 1,554. Population change in the 1990s: +539 (+34.7%).
Place of birth for U.S.-born residents:
This state: 2,388
Northeast: 267
Midwest: 496
South: 378
West: 247
56% of the 75497 zip code residents lived in the same house 5 years ago. Out of people who lived in different houses, 27% lived in this county. Out of people who lived in different counties, 50% lived in Texas.
90% of the 75497 zip code residents lived in the same house 1 year ago. Out of people who lived in different houses, 44% moved from this county. Out of people who lived in different houses, 44% moved from different county within same state. Out of people who lived in different houses, 13% moved from different state.
Private vs. public school enrollment:
Students in private schools in grades 1 to 8 (elementary and middle school):
Here:
0.0%
Texas:
8.8%
Students in private schools in grades 9 to 12 (high school): 52
Here:
36.5%
Texas:
8.0%
Students in private undergraduate colleges: 5
Here:
9.7%
Texas:
16.2%
Occupation by median earnings in the past 12 months ($)
110,794Business and financial operations occupations
69,511Health diagnosing and treating practitioners and other technical occupations
62,959Management occupations
46,610Material moving occupations
41,461Production occupations
34,313Construction and extraction occupations
Top industries in this zip code by the number of employees in 2005:
Construction: New Single-Family Housing Construction (except Operative Builders) (20-49: 1, 1-4: 1)
Arts, Entertainment, and Recreation: Golf Courses and Country Clubs (20-49: 1)
Wholesale Trade: Medical, Dental, and Hospital Equipment and Supplies Merchant Wholesalers (10-19: 1)
Construction: Poured Concrete Foundation and Structure Contractors (10-19: 1)
Professional, Scientific, and Technical Services: Geophysical Surveying and Mapping Services (10-19: 1)
Construction: Plumbing, Heating, and Air-Conditioning Contractors (10-19: 1)
Construction: Commercial and Institutional Building Construction (5-9: 1)
Administrative and Support and Waste Management and Remediation Services: Landscaping Services (1-4: 2)
Fatal accident statistics in 2014:
Fatal accident count: 1
Vehicles involved in fatal accidents: 2
Fatal accidents caused by drunken drivers: 0
Fatalities: 1
Persons involved in fatal accidents: 2
Pedestrians involved in fatal accidents: 0
Fatal accident statistics in 2013:
Fatal accident count: 1
Vehicles involved in fatal accidents: 2
Fatal accidents caused by drunken drivers: 0
Fatalities: 1
Persons involved in fatal accidents: 2
Pedestrians involved in fatal accidents: 0
2003 - 2018 National Fire Incident Reporting System (NFIRS) incidents
Based on the data from the years 2003 - 2018 the average number of fire incidents per year is 54. The highest number of fires - 95 took place in 2005, and the least - 18 in 2003. The data has a growing trend.
When looking into fire subcategories, the most incidents belonged to: Outside Fires (70.6%), and Structure Fires (19.9%).
Fire incident types reported to NFIRS in Zip Code 75497


 Nearest zip codes: 75431, 75410, 75783, 75440, 75420, 75471.


 Based on the data from the years 2003 - 2018 the average number of fire incidents per year is 54. The highest number of fires - 95 took place in 2005, and the least - 18 in 2003. The data has a growing trend.
 When looking into fire subcategories, the most incidents belonged to: Outside Fires (70.6%), and Structure Fires (19.9%).